Nomenclature
- TR
-
throttling ratio
- A e
-
exit area of intake [m2]
- A c
-
capture area of intake [m2]
- P s
-
ctatic pressure [Pa]
- P 0,∞
-
freestream total pressure [Pa]
-
 ${\bar t_n}$
-
normalised time for each buzz cycle
-
${t_{bi}}$
-
start time of a typical buzz cycle
-
${t_{be}}$
-
end time of the buzz cycle
- t
-
local instantaneous time within the buzz cycle


1.0 Introduction
Supersonic aircraft utilise air-breathing engines that require specially designed diffusers to decelerate incoming supersonic airflow to subsonic speeds before combustion. These supersonic diffusers, known as air intakes, achieve pressure rise using the kinetic energy of the incoming air, eliminating the need for mechanical or rotating components. As described by Seddon and Goldsmith [Reference Seddon and Goldsmith1], supersonic intakes consist of both a supersonic and a subsonic diffuser, which regulate the quantity and quality of airflow into the combustion process.
The supersonic diffuser features a converging section that gradually reduces the flow area to a minimum point, known as the throat. At this location, the flow reaches sonic speed before entering the subsonic diffuser, which is a diverging section that further decelerates the airflow. Depending on mission requirements, supersonic intakes can adopt either a rectangular or an axisymmetric duct configuration. Axisymmetric intakes incorporate a central spike or centre body protruding through a hollow cylindrical duct, with the outer surface called the cowling. The spike facilitates supersonic diffusion, while the internal duct – formed by the centre body and cowling – primarily governs subsonic diffusion. These diffusers dynamically adjust to engine demands, ensuring a sustainable air supply with variable mass flow rates.
For optimal engine operation, the intake functions in a critical state, where the supersonic-to-subsonic transition occurs precisely at the designed throat. However, when engine demand decreases, the terminal shock moves upstream into the supersonic diffuser’s converging section, leading to subcritical operation. At this position, the normal shock becomes unstable due to interactions between the shock wave and the boundary layer, progressively developing into oscillatory behaviour. This oscillation, characterised by high amplitude and low frequency, is widely known as intake buzz.
Since its initial observation in axisymmetric intakes by Oswatitsch [Reference Oswatitsch2], the phenomenon of intake buzz has been the subject of many researchers. It is clear from the research reports on the subject that two main instability features control the onset and characteristics of buzz: one is the Ferri criterion [Reference Ferri and Nucci3] which causes early intake problems due to cowl shock impingement and shock-vortex interaction, and the other is the Dailey criterion [Reference Dailey4], which is linked to severe choking and unstarting due to shock-induced flow separation from the spike body surface.
Fisher et al. [Reference Fisher, Neale and Brooks5] further classify the buzz phenomenon into two subcategories: ‘Little Buzz’ and ‘Big Buzz’. Little Buzz refers to low-amplitude oscillations that emerge as the intake mass flow rate decreases, whereas Big Buzz is characterised by large-amplitude oscillations that develop with a further reduction in mass flow rate appearing to be simply an extension of Little Buzz. While Little Buzz generally aligns with Ferri’s criterion and Big Buzz with Dailey’s criterion, this relationship is not always absolute. Initially, Fisher et al. [Reference Fisher, Neale and Brooks5] suggested that both forms of buzz exhibit similar frequencies. However, subsequent studies by Trapier et al. [Reference Trapier, Duveau and Deck6] refuted this claim by observing that Little Buzz is likely associated with an acoustic resonance within the intake, influenced by the presence of the Ferri criterion, while Big Buzz appears to be initiated according to Dailey’s criterion. This implies that the change from Little to Big Buzz is not just an extension of the similar process.
One-dimensional wave analysis by Nagashima et al. [Reference Nagashima, Obokata and Asanuma7] shows that precise 3D flow separation modelling is not necessary to estimate buzz frequency, and also results indicate that the presence of acoustic wave influence frequency and amplitude which was later confirmed by other researchers as well. Experiments were done by Chang et al. [Reference Chang, Wang, Bao, Qin, Niu and Xue8] to study hypersonic intake unstart. They found two new unstart patterns: a nonoscillatory violent mode with minimal shock motion, and a mixed oscillatory mode that included strong and weak oscillations.
Soltani et al. [Reference Soltani, Daliri and Sepahi Younsi9] with their findings show that various flow interaction events affect the inlet’s performance and stability. A pseudo-shock is created when the internal duct boundary layer interacts with the terminal normal shock, causing flow distortion and decreasing total pressure recovery. Buzz instability is triggered due to the Dailey criterion in which the normal shock travels to the exterior compression cone under subcritical circumstances, where it may interact with the boundary layer and cause flow separation. Soltani and Younsi [Reference Soltani and Sepahi-Younsi10] demonstrated that the phenomenon of buzz triggering is greatly affected by the acoustic properties of the intake duct. During certain phases of the buzz cycle, significant flow separation occurs, leading to the development of Big Buzz at high frequencies. These fluctuations exhibit characteristics of both Little and Big Buzz. As the freestream Mach number rises, the buzz frequency falls.
Abedi et al. [Reference Abedi, Askari, Sepahi Younsi and Soltani11] conducted a notable investigation comparing 3D and axisymmetric simulations for supersonic air intakes. Their findings indicated that both types of simulations accurately matched experimental data regarding total and static pressure distributions. In contrast, axisymmetric simulations provided precise forecasts for performance metrics, 3D simulations allowed for a more comprehensive analysis of supersonic intakes. Hirchen et al. [Reference Hirschen, Herrmann and Gülhan12] investigated a ramjet intake model’s performance and unsteady behaviour at supersonic speeds in the German Aerospace Center’s trisonic wind tunnel. Focusing on a design optimised for a shock-on-lip Mach number of 2.5, researchers tested four different boundary layer bleed configurations. The results helped identify the optimal intake design by comparing the performance and unsteady behaviour of each configuration. Preliminary numerical studies done by Jagannathan and Johansen [Reference Jagannathan and Johansen13] with injecting solid nanoparticles on the ramp side of intake designed for Mach 2.0 displayed buzz elimination using Open foam. The method of repetitive laser energy deposition on subcritical and buzz modes was experimentally studied by Myokan et al. [Reference Myokan, Kubota, Iwakawa and Sasoh14] with effective results in the delay of buzz and stable operation on a supersonic intake with conical compression at Mach 1.92. This method moderates using a laser pulse and, in a way, generates a high-temperature region which interacts with the complex shock-associated instabilities.
Use of movable cowl to demonstrate numerically the starting behaviour of hypersonic intakes has been reported by Donde et al. [Reference Donde, Marathe and Sudhakar16]. Restarting the intake using typical turning of a portion of the cowling about the pivot point by an order of 15° could address the unstart characteristics of intake. The sliding door mechanism dynamically at various door speeds for starting scramjet intake at Mach 6.0 is investigated by Grainger et al. [Reference Grainger, Brieschenk, Boyce, Malpress and Buttsworth17]. The method of sliding cowl in translational motion on the influence of shock train behaviour in the intake duct at hypersonic freestream flow has been reported by Shi et al. [Reference Shi, Chang, Zhang, Wang, Hou and Bao18]. Inward cowl deflection to reduce the impact of interactions in a hypersonic intake is reported by Idris et al. [Reference Che Idris, Saad and Kontis19]. The use of cowl deflection with various angles leading to improvements in flow and intake performance to the tune of bleeding is reported by Das and Prasad [Reference Das and Prasad20].
Numerous researchers have investigated the nature of intake buzz over the decades, identifying two primary types: Little Buzz and Big Buzz. Table 1 summarises key studies that have contributed to understanding this phenomenon.
Summary of contributed reports on buzz and studies with cowl operation as control

By integrating these findings, the research landscape continues to evolve, providing critical insights into buzz suppression, intake stability and overall supersonic and hypersonic propulsion efficiency. The research directions so far on the cowl adjustment, sliding, deflection, translation, etc. focuses on the intake start/unstart characteristics, performance benefits, SBLI etc. Adoption of dynamic or active cowl deflection appropriate to the feedback requirements based on engine operating conditions with intake buzz will be a new area of exploration for the mitigation of such problems. Our study investigates buzz characteristics in axisymmetric intakes with dynamic cowl deflection angles, specifically focusing on active deflection during intake buzz cycle. The primary objective is to examine how these angles influence buzz instability in supersonic intakes. By systematically analysing various cowl deflection angles under different engine demand conditions, this research aims to enhance the understanding and mitigation of the buzz phenomenon in such intake systems.
2.0 Intake Geometry
The base design of the axisymmetric mixed compression intake in the present study is similar to Abedi et al. [Reference Abedi, Askari, Sepahi Younsi and Soltani11] for a design Mach number of 2, with modifications on the length of model suiting the conditions of present experimental setup, shown in Fig. 1. The intake has a spike with a 16° half angle, with the maximum length and diameter of the intake as 100 mm and 26.44 mm, respectively. To simulate different operations of intake technique of variations in throttling ratios (TR) were made by moving a plug positioned at the exit of the intake. This plug at the exit of the intake was varied such that the area of exit changes, thereby altering the net exit mass flow rate. TR is defined as:
 \begin{align}{\rm{TR}} = 1 - \frac{{{A_e}}}{{{A_c}}}\end{align}
Dimensional details of axisymmetric intake used in this study. (All dimensions in mm.)

Where A e corresponds to the total exit area available and A c is the capture area of the intake. TR of 1 represents that the throttling plug entirely blocks the exit area. In contrast, TR tending to 0 represents that the plug is fully open and corresponds to an area nearing to the capture area of intake. In the present work, a small portion of the cowl was deflected about a pivot point (CP), as shown in Fig. 1, to demonstrate the angular deflection of the cowl on buzz phenomenon using numerical simulations.
3.0 Numerical Methods
Axisymmetric simulations have been made by adopting the finite volume method, and where Reynolds-averaged Navier-Stokes (RANS) equations are solved with the SST k-ω turbulence closure model. The RANS equations govern the transport of the averaged flow quantities, with all scales of turbulence being modelled. The SST k-ω turbulence model is opted for its capability in modelling separated flows and flows with adverse pressure gradients. A structured grid, as shown in Fig. 2 has been generated for the domain using Fluent meshing. Near wall region has fine meshing with first cell height near the wall, corresponding to y + < 5 and capturing effects in the viscous sublayer for the turbulence model.
Grid topology used for the simulations around intake with near wall grid clustering and also showing the pressure monitoring points.

To check and confirm on the adequacy of number of cells, grid independency studies have been performed before freezing on the number of cells for the present study. The fluid was modelled as an ideal gas, and its viscosity was determined using Sutherland’s three-coefficient method. A density-based solver with a second-order implicit scheme is adopted with Advection Upstream Splitting Method (AUSM)-based flux splitting method. After using steady equations to create initial simulations, unsteady simulations were started. The incremental time step size of dt = 10−6 was used for present simulations to capture all scales of oscillations.
For the validation of the present set of simulations, an almost similar geometry was adopted by Abedi et al. [Reference Abedi, Askari, Sepahi Younsi and Soltani11]. The same operating conditions reported in the literature were fed in the validation simulation, and results were obtained. Figure 3 shows the Mach contour comparison for a typical currently defined throttle ratio of TR = 0.48 and corresponding to the reported back pressure ratio of P se /P s∞ = 5.5, indicating a similar classification of external and internal flow dynamics with shock waves qualitatively. The pressure distribution on the centre body spike for the above two cases are plotted together in Fig. 4, and shows quantitatively the analogy between the back pressure ratio and throttling ratio concept taken together. Both the comparisons made through qualitative and quantitative means describe the confidence of grids, solver settings and the post-processing, which are used to describe the outcomes and conclusions.
Validation comparison for pressured exit (PsePs∞ = 5.5) obtained by Abedi et al. [Reference Abedi, Askari, Sepahi Younsi and Soltani11] with current approach of throttled exit (TR = 0.48), performed with the similar intakes.

Comparison of spike pressure distribution at TR = 0.48, with the literature having back pressure ratio of 5.5 at exit.

4.0 Dynamic Meshing and UDF for Active Cowl Deflection
Dynamic meshing has been used here to accommodate the active movement of the cowl during flow simulation. To achieve the mesh motion with time in fluent, the smoothening operations were adopted, which adjusts the mesh of an area by moving or deforming the meshed area, keeping the number of nodes and their connections intact.
In the present work, a small leading portion of the cowl was put on active motion with a pivot situated on the cowl itself. Hence, angular displacement and motions could be imparted to the piece of cowl about the pivot point with a maximum angular deflection of 21 degrees. This extreme situation of angle was sufficiently handled by smoothening methodology. Diffusion-based smoothening has been adopted with a diffusion parameter of 0.2, where a value of zero represents uniform diffusion. Figure 5 shows the mesh adaptation to the moving boundary.
Mesh deformation with finite active cowl deflection.

To prescribe the motion of the moving boundary, a user-defined function (UDF), which uses a macro to specify rigid body deformation motion, has been used to deflect a portion of the cowl. This is done by providing angular velocities at every time step.
The focus of this work is to study the effect of active deflection of cowl on intake buzzing. The least angular deflection required to restrict the buzz cycle is determined at three different throttling ratios. Various angular velocities will lead to various flow physics which could be a possible area of extended study. Here, for the present study, a typical angular velocity of 174 rad/s is used for each case.
5.0 Experiments
An axisymmetric intake model has been fabricated and experimented upon in the supersonic blowdown wind tunnel facility, which has a test section size of 150 mm × 100 mm at the Aerodynamics Laboratory of BIT Mesra, Ranchi, India. Figure 6 shows the axisymmetric intake model mounted in the test section of the wind tunnel facility. The model has been scaled such that its blockage ratio in the test section is less than 5%. A conical plug with a 30 deg half angle is used at the exit of the intake as a throttle and also to control the TR.
Assembled axisymmetric intake model mounted in the test section of supersonic wind tunnel.

The cowl and centre body are held together with four staggered struts positioned such that, it has a minimum interference. Two locations have been identified for the measurement of static pressure, the first on the spike compression ramp and the second on the subsonic diffuser. The static ports are located at x/L = 0.1 (P1) and x/L = 0.5 (P4) from the spike centre body tip, as also depicted in Fig. 2.
Wika S10 piezo resistive sensors with a range of 0–30 psi were used for static pressure measurements. The pressure measurement setup consists of tubes connected from the static ports to the Wika sensors. The sensors are supplied with a power supply of 15 V DC. The output of the sensors is connected using NI SCXI 1,314 and is fed to an NI PXIe-8820 embedded controller. The LabVIEW software is used to capture and analyse the acquired data. The experiments were conducted for supercritical and subcritical cases, with TRs of 0, 0.48 and 0.68.
Wind tunnel facility runs on dry compressed air stored in an external reservoir having a capacity of 30 m3. A butterfly valve supplies compressed air from the reservoir, and a pressure-regulating control valve is positioned in front of the settling chamber. A National Instruments (NI) Programmable Logic Controller (PLC) is used to operate the tunnel. A pressure-regulating valve is used to keep the settling chamber’s pressure at the desired level. The overall pressure in the settling chamber was kept constant at 30 psi (gauge) for the purposes of this investigation. Every experiment was carried out at a freestream Mach number of 2.0.
The flow visualisation experimental setup consisted of a light source, suitable lens, rectangular slit, parabolic mirrors and a high-speed camera suitably arranged to obtain the schlieren images. The light rays emitted from the source are reflected by a pair of parabolic mirrors positioned on either side of the test section and onto a third plane mirror. The camera is located at the focus of the third mirror.
First, a Basler camera is used to capture images at 60 fps with a resolution of 1,280 × 1,024 pixels. In the next phase, a Photron Fastcam mini high-speed camera is used for subcritical operations of intake to capture images at a high frame rate of 25,000 fps with a resolution of 95 × 148 pixels.
6.0 Results and Discussions
Initially, intake at various TRs tested are presented here, with a special emphasis on subcritical operation of intake leading to buzz. The onset of buzz and its prime cause is highlighted, and one of the methods to delay this onset is discussed. The technique of active cowl deflection during the throttling and with subsequent buzz is being demonstrated. The active cowl deflection method adopted here is also demonstrated for various throttling ratios to understand its effectiveness.
6.1 Supercritical operation of intake
Supersonic intake operated at a design Mach number of 2.0 without any throttling at the exit and corresponding to a near supercritical operation of intake is shown through the comparison between the experimental shadowgraph on the top half and numerical schlieren on the bottom half at the spike region of the intake as seen in Fig. 7. The internal shock dynamics are seen through the numerical schlieren, which exhibits several internal reflections. The shadowgraph image shows the oblique shock surrounding the spike surface in the flow. The boundary layer separates slightly downstream of the spike shoulder due to the cowl shock’s impingement on the spike side. Satisfactory agreement with the external flow over the spike could be observed between experiments and the computed results.
Comparison between shadowgraph and density gradient contour operated at supercritical condition (TR = 0).

The static pressures measured at locations x/L = 0.1 (P1) and 0.5 (P4) on the centre body are also compared with the data obtained computationally for the intake operated without any throttle. Figure 8 shows the comparison between them, showing a good agreement at locations on the spike’s external surface and one point at internal duct, which is at the diffuser surface.
Comparison between computed spike surface pressure distribution and the measured pressures at two selected locations on the spike surface at TR = 0.

6.2 Onset of buzz
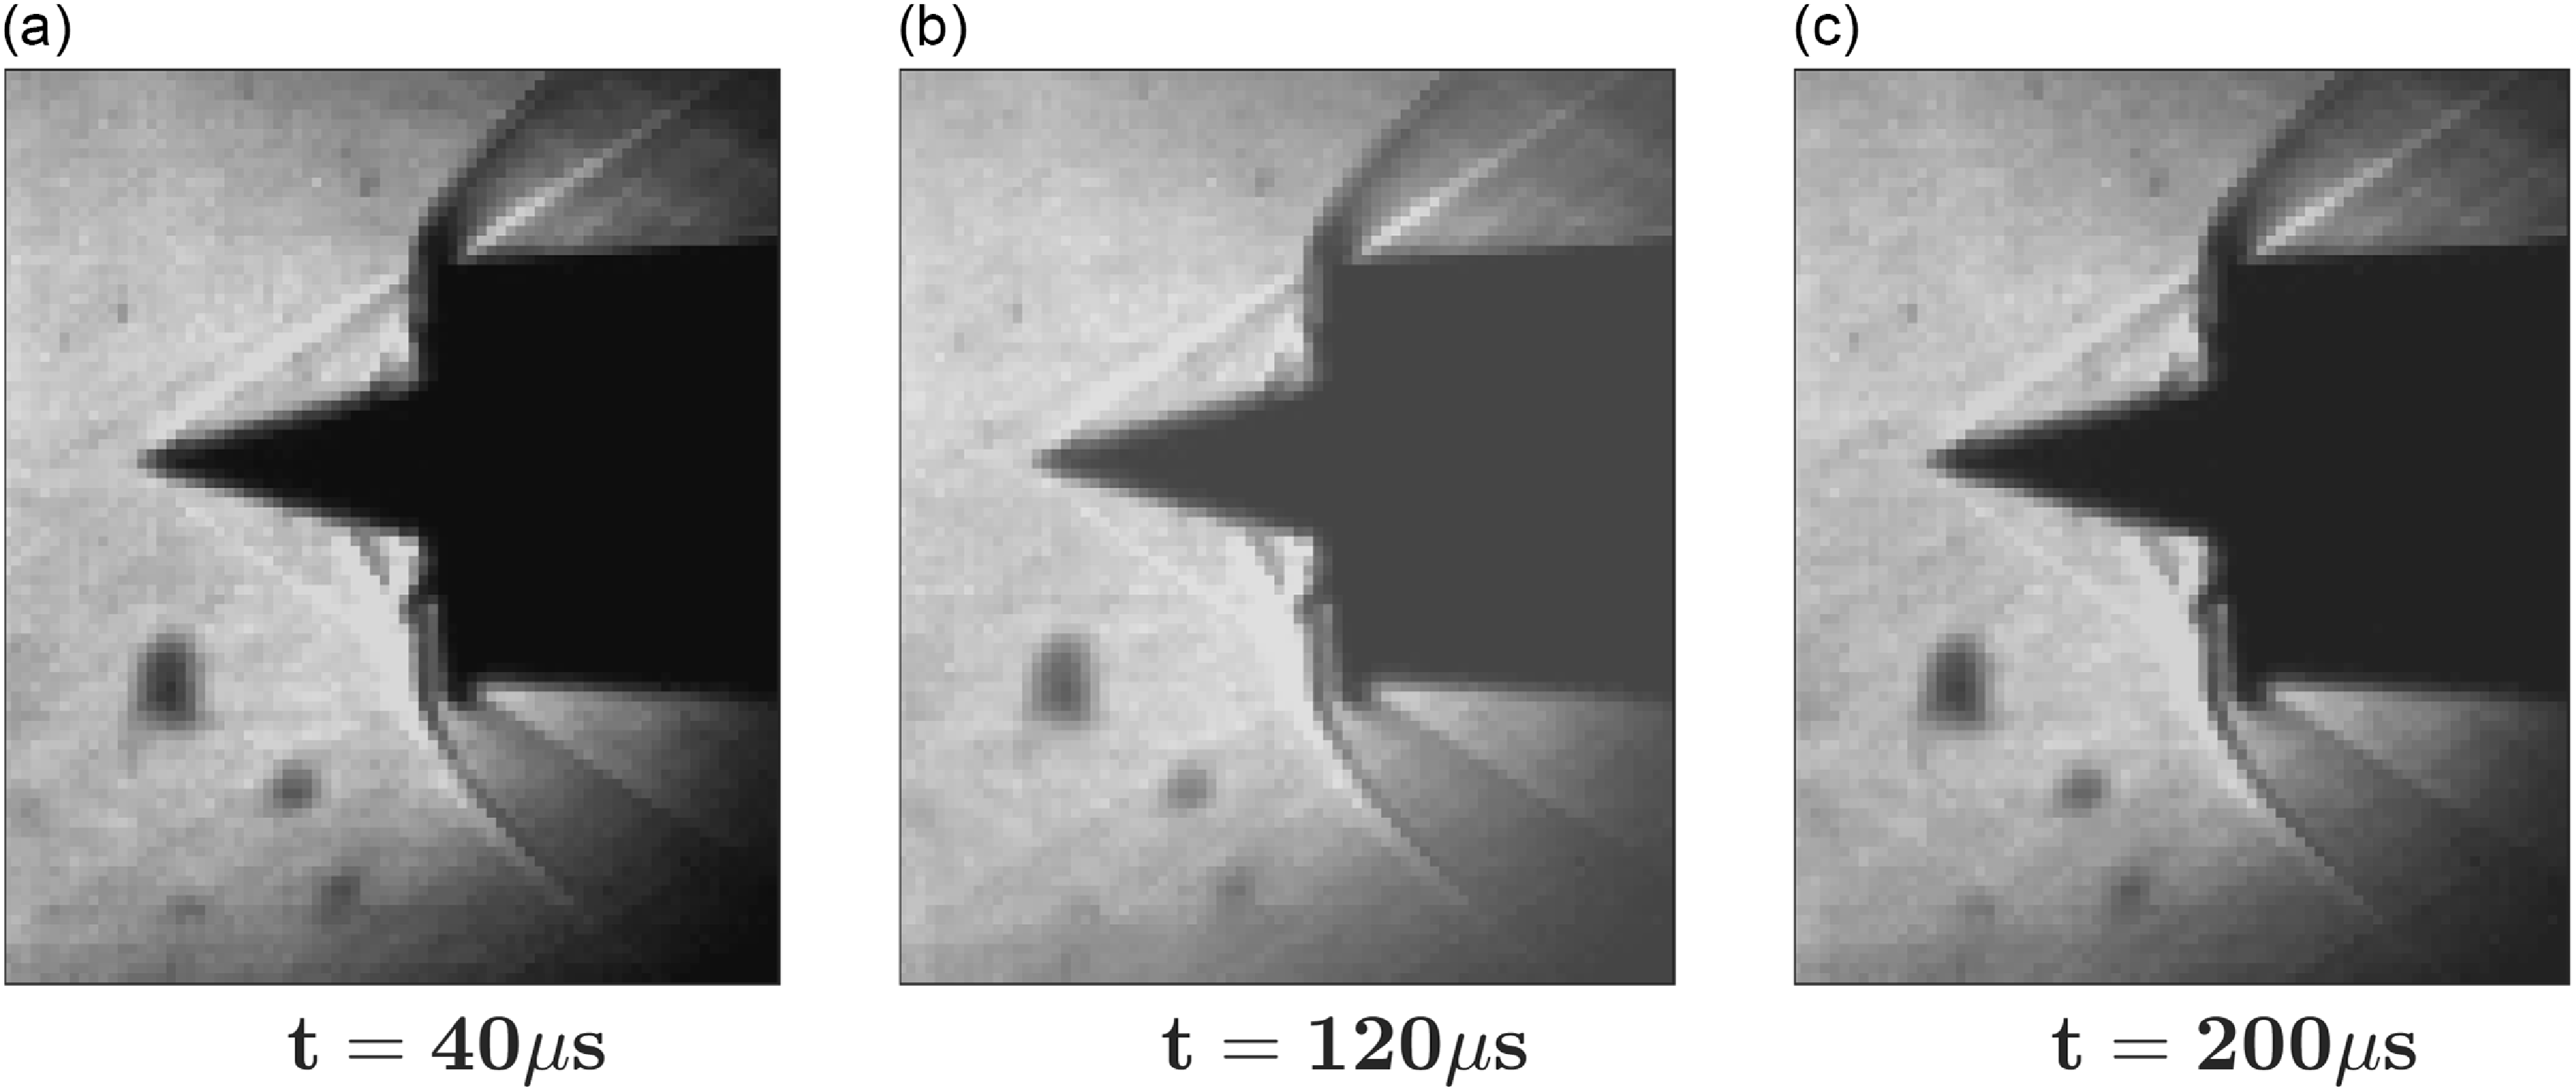
Shadowgraph images of the intake at TR = 0.5 were captured to obtain the critical operating condition. At this throttling ratio, the normal shock is observed to be just outside the cowl lip, and there, the shock becomes curved and appears like a bow shock. On the spike surface, there exists to have a separation bubble type activity, which has a transient character. This is when the intake is transitioning from a near-critical to a subcritical regime. Very mild back-and-forth displacement of the separation bubble and the terminal normal shock are visible through frames grabbed from the shadowgraph. To visualise this unsteadiness, a high-speed camera was employed to grab the frames at the rate of 25,000 fps with a resolution of 95 × 148 pixels. Figure 9 describes the flow fluctuation in three frames taken at an incremental time of 80 µs. These frames show clearly the feature on the spike varying in time, as well as the cowl shock shape variations.
Shadowgraph of onset of buzz for intake operated at TR = 0.5, showing the transient behaviour of cowl lip shock.

Although there was a transient behaviour (mild), at TR = 0.5; still measurement of the spike mean pressures were attempted out at slightly less TR, corresponding to a steady flow inside intake and a comparison for TR = 0.48 is presented in Fig. 10 showing similar trends both in experiments and computations. Due to terminal normal shock downstream of the cowl lip, the monotonous pressure rise at the subsonic diffuser of the intake signifies the presence of a pseudo shock Ram and Kim [Reference Ram and Kim15] and mixing zone, which has been captured quite well from both techniques.
Spike mean pressure distribution obtained from experiments and computations at TR = 0.48.

6.3 Subcritical operation of intake
Intake configuration operated at various throttling conditions revealed a transition from supercritical to subcritical operating conditions as backpressure in terms of throttling increases. At a typical TR of 0.5, the intake demonstrated a near-critical regime, where the normal shock happens to be just at the cowl lip location and about to be pushed out from the internal duct. Further throttling leads to the terminal normal shock being pushed out of the cowl lip, initiating spillage. In the present investigation, three throttling ratios have been adopted, which indicated the subcritical operation of intake and demonstrated the phenomena of intake buzz. These throttling ratios were selected as TR = 0.54, 0.62 and 0.68 to study the effect of throttling on the intensity of buzz phenomena. Experiments were only performed at a throttle ratio of TR = 0.68; however, the computations were made with all the selected throttles. To qualitatively demonstrate the buzz cycle, the typical throttle of TR = 0.68 in both computation and experiments are detailed below.
6.3.1 Computed pressure time history during throttles of TR = 0.54, 0.62 and 0.68
To obtain the quantitative details of the flow with various throttles, specific points were monitored in time throughout the simulations. For the present demonstration of buzz cycles and its characteristics, during computations, two specific points P1 (x/L = 0.1) and P4 (x/L = 0.5) were chosen due to getting trends one on the spike external surface and one on the diffuser surface internal to the intake. The pressure time data was then post-processed to obtain the pressure spectrum and its contents through fast Fourier transform (FFT) using Matlab. All these results for throttling ratios of TR = 0.54, 0.62 and 0.68 are presented in Figs 11–13, respectively. Pressure time history at TR = 0.54 shows variations of pressures with time on a regular pattern. The mean levels of P1 and P4 indicate oscillations locally and not affecting the entire internal duct or sweeping of the oscillations through the points that were monitored. The FFT of these points (Fig. 11(b)) show a dominant frequency of 386 Hz. While the throttle increases to TR = 0.62, there is an indication of pressure fluctuations being intensified and the mean pressures vary, subscribing to the oscillation occurring in the entire duct. The pressure spectrum shows a frequency of 461 Hz (Fig. 12(b)) for such a character of oscillation. Further intensification of pressure fluctuations and its frequency is being observed for the TR = 0.68 as seen in Fig. 13(a) and (b). The buzz is evident at this throttle ratio with a frequency of 530 Hz.
Pressure-time history and pressure spectrum at P1 & P4 during operation at TR = 0.54.

Pressure-time history and pressure spectrum at P1 & P4 during operation at TR = 0.62.

Pressure-time history and pressure spectrum at P1 & P4 during operation at TR = 0.68.

6.3.2 Qualitative results of buzz at TR = 0.68
Density gradient magnitude contours, along with superimposed streamlines for one complete cycle of buzz oscillation, is presented in Fig. 14 for a throttle ratio of TR = 0.68. Instantaneous frames at the non-dimensional time instances are presented in Fig. 14(a)–14(j). The time has been normalised based on the time taken for one complete oscillation and is given by
 \begin{align}{\bar t_n} = \frac{{t - {t_{bi}}}}{{{t_{be}} - {t_{bi}}}}\end{align}
where
 ${\bar t_n}$
is the normalised time of n
th buzz cycle,
 ${t_{bi}}$
is the start time of the buzz cycle,
 ${t_{be}}$
is the end time of the buzz cycle and t is the local instantaneous time. These 10 instantaneous frames in Figs 14(a)–14(j) are also indicated in the pressure-time curve shown as an insert to this figure. It could be observed that the dynamic movement of terminal normal shock is being influenced by the spike side boundary layer disturbances and leads to a large separation bubble moving upstream (Figs. 14(a)–14(d)). This phenomenon could be attributed to the explanations listed based on Dailey’s criterion of intake buzz [Reference Dailey4–Reference Trapier, Duveau and Deck6].
Superimposed density gradient magnitude contours and streamlines for intake with throttle of TR = 0.68. (i) Descriptive pressure plot for a typical cycle; (ii) streamlines superimposed on density gradient.

As the separation bubbles grow, pushing the shock system upstream, it finally exhibits the shock system out of the duct (Fig. 14(d)). Prior to the complete expulsion of the shock system, there appears a frame that explains the first instance of adversity which might be responsible for the entire buzz phenomenon. The separation bubble on the spike shoulder grows big enough to block the entire passage of the intake duct. The shock which was incident to this bubble if not controlled, would interact. This is due to this growing bubble and shock interaction with the separation bubble, which causes the entire buzz cycle to initiate. The bubble inflates and makes the inclined shock move out from the cowl tip, blocking the entire duct. This makes the incoming flow deflecting away completely as spilled air. At this instant, as seen from Fig. 14(d)–14(f), there appears to have intensified shock oscillations on the spike itself for some duration, covering from 66% to 77% of the overall buzz cycle time. This intense pattern of to and fro motion of shock on the space between the spike tip and cowl tip happens for quite a duration and could be leading to pulsation of flow. Just after this feature, the pressure intensification decreases and the shock system is being swallowed again inside the duct. Due to probable dynamic instabilities (Fig. 14(j)), the freestream mass flow again enters the duct and the appearance of normal shock is observed again. A similar feature continues, and the cycle repeats itself with a self-sustaining pattern called intake buzz.
In a similar manner, the buzz phenomenon was also captured through experiments at a throttle ratio of TR = 0.68. Shadowgraph frames were captured using a high-speed camera, and frames were grabbed every 40 µs. Figure 15 shows the typical cycle of the intake buzz, having frames presented with normalised time relative to the buzz cycle. The onset of buzz by the normal shock at the cowl lip and progression with an upstream moving separation bubble is quite evident in Fig. 15(a)–15(c). The forming of the bow shock at the spike tip and its streamwise movement with time on the spike could be observed in Figs. 15(d) and 15(e). At this moment, the portion of mass flow could have entered into the duct, which, due to non-sustenance, could have again made an expulsion upstream, leading to upstream thrusting of the bow shock on the spike tip (Fig. 15(f)). The flow again returns back to the internal duct via the process as indicated in Figs 15(g)–15(i). The cycle repeats almost similarly and is the representation of the intake buzz. The process as observed in Figs 15(d)–15(f) describes the phenomena of shock pulsation, characterised by the inflating and deflating of the bow shock envelop. This, for instance, occurs multiple times before shock is swallowed inside the duct, as seen through Fig. 15(g)–15(i), which also corroborates the observations obtained through computation.
Shadowgraph of the intake in the subcritical regime at TR = 0.68, showing one complete buzz cycle.

6.3.3 Characteristics of oscillation cycle with throttle operations
One complete cycle of oscillation is defined as the starting behaviour of the shock pattern being propelled outside the duct till a similar situation is arrived after the complete oscillations are over and to be repeated again. This is exhibited through a typical pressure-time curve in Fig. 16(a), where the time taken for one its oscillation is also shown as
 ${{\Delta }}$
time
 ${\bar t_n}$
. The oscillation time is defined as
 ${\bar t_n}$
, where n denotes the number of oscillation. The measured oscillation cycle time with the subsequent number of oscillations at various throttles operated is plotted in Fig. 16(b). It is clearly observed that the low throttles corresponds to a large oscillation cycle time and with increase in throttle, the time decreases owing to an increase in the frequency of oscillation. Near critical operation or onset of buzz, the
 $\Delta $
time almost stay linear with subsequent cycles. The cycle time rapidly varies with the number of oscillations while diving into the buzz oscillation.
Oscillation cycle time and its characteristics.

6.4 Simulation results of dynamic active cowl deflection
Buzz instability causes high amplitude fluctuations and drastic reduction in mass flow, which could lead to intake unstart and engine malfunction. As it has been identified in the previous section the inception of buzz occurs at the region of the throat of the intake close to the cowl lip and the spike shoulder region; the flow alteration/improvement there could lead to avoidance of buzz phenomena. An active control technique involving angular deflection of a portion of the cowl is proposed here, which could do precisely the same of avoiding such complex interaction near to the throat of intake. The cowl deflection operated dynamically, and its effect on buzz instability and intake performance is discussed in this section. Here, three subcritical conditions are considered: TR = 0.54, TR = 0.62 and TR = 0.68. In this section, the active cowl deflection results demonstrating the influence towards the shock boundary layer interactions during the buzz cycle is presented. The dynamic deflection of a pivoted small portion of the cowl, as described in the numerical methods section, has been adopted. The angular displacements of the cowl about the pivot is performed at a rate of 174 rad/sec.
6.4.1 Simulations with throttling operated with TR = 0.54
The initiation of cowl deflection is implemented after the completion of several cycles of buzz oscillations. To demonstrate the effectivity of dynamic cowl deflection, the application of angular displacement was made in a cycle of oscillation initiated from
 ${\bar t_n} = 4.95$
to
 ${\bar t_n} = 5$
at a rate of 174 rad/s and kept like that for subsequent operations of intake with TR = 0.54. The pressure time history of the dynamic cowl deflection operation at TR = 0.54, showing the influence of the deflected cowl on the pressure oscillation, is demonstrated by P1 monitoring point and is shown in Fig. 17. The numerical Density gradient magnitude contour obtained for solutions at TR = 0.54 is shown in Fig. 18. It has been found that a dynamic angular deflection till 7 degrees is sufficient to restrict the intake from transitioning to the subcritical regime.
Pressure time history at P1 during throttling at TR 0.54 showing the influence of cowl deflection on flow oscillation. (i) Descriptive pressure plot for a typical cycle; (ii) streamlines superimposed on density gradient.

Computational density gradient magnitude contours for intake with TR 0.54 under dynamically deflected cowl till 7°.

Computational density gradient magnitude contours for intake with TR 0.62 under dynamically deflected of cowl by 12.5°. (i) Descriptive pressure plot for a typical cycle; (ii) streamlines superimposed on density gradient.

Pressure time history at P1 during throttling at TR 0.62 showing the influence of cowl deflection on flow oscillation.

The Density gradient magnitude contours in Fig. 18(a) and 15(b) shows a large flow separation bubble on the spike, making the intake duct constricted at the minimum area of the intake shoulder, also shown in the pressure plot insert as point (a) and (b). The angular displacement of the portion of the cowl was initiated at point (c), corresponding to
 ${\bar t_n} = 4.95$
(Fig. 18(c)) with a small cycle angle and then gradually incremented to an angle of 7 degrees over time. The application of even a smaller angle demonstrates an improvement in the state of boundary layer observed in Figs 18(c)–18 (i). Hence, the objective of altering the reflected wave from the cowl tip has clearly restrained the adversity observed over the intake duct. No further oscillation cycle was observed after full deployment of the cowl deflection angle designed for TR = 0.54.
6.4.2 Simulations with throttling operated with TR = 0.62
With increase in throttle to TR = 0.62, as discussed in section 6.31, indicated intensified pressure fluctuations and affecting the entire internal duct of the intake. A similar adaptation of dynamic cowl deflection during one of the cycle at point (a), shown in the insert of Fig. 19 shows the influence demonstrated through Mach contours and streamlines in Fig. 19 for various non-dimensional times (
 ${\bar t_n}$
). The entire chaotic flow structure inside the intake on the initiation of angular deflection of the cowl portion at
 ${\bar t_n} = 0.3$
(Fig. 19(a)), shows a behavioural alteration leading to improved flow structure inside the intake from
 ${\bar t_n} = 0.6$
onwards. The gradual increase of cowl deflection to a level of 12.5 degrees is found to sufficiently prevent the intake from having spillage and internal flow oscillations. Beyond
 ${\bar t_n} = 1.825$
, the complete pressure fluctuation is seized (Fig. 19(i)). The pressure history shown in Fig. 20 indicates the exact location of implementation of the angular displacement of cowl in one of the oscillating cycles, which took some time to settle the disoriented flow inside intake. At a large time after the initiation of cowl deflection, the insert of Fig. 20 shows a contour at
 ${\bar t_n} = 4$
, which clearly shows a static behaviour of the entire flow field inside the intake. The generated flow-separated bubble stands at a typical location on the spike of the intake which is at a location not widely influenced by the incipient shock from the cowl tip.
Computational density gradient magnitude contours for intake with TR 0.68 under dynamic deflection of cowl. (i) Descriptive pressure plot for a typical cycle; (ii) streamlines superimposed on density gradient.

Density gradient magnitude contour and streamlines for intake operation with TR = 0.68 at
 ${{\;}}{{\bar{ t}}_{{n}}} = 7.4$
.

6.4.3 Simulations with throttling operated with TR = 0.68
The active cowl deflection of a small portion of the cowl implemented at TR = 0.68 also exhibits similar behaviour in action, helping to modify the flow inside the intake, as shown in Fig. 21. With an increase in the throttling ratio, the cowl deflection requirement angle also increases, and it is observed that an angle of 21° was sufficient to obtain the present objective at TR = 0.68. It is also observed that at very high throttles, the current method is helpful in mitigating the complete unstarting of the flow due to shock oscillations and pulsation of intake buzz, however the quality of the flow inside the intake duct needs further treatment for better performance. Figures 21(g)–21(i) shows the contours after the complete deployment of the cowl angle of 21°, though fixing the issue of any further forward movement of shock patterns. Still, the recirculating bubble remains inside the duct. It is also ensured after a longer time duration that the recirculating flow does not come in the way of cowl tip shock impingement point on the spike and does not flip towards shock expulsion further from the intake, which is also shown in Fig. 22, at a non-dimensional time of 7.4; however, the bi-stable nature of the recirculation bubble have not been confirmed here, which is a common behaviour with divergent diffusers (Greitzer et al. [Reference Greitzer, Tan and Graf21]).
7.0 Conclusions
Studies on a supersonic axisymmetric mixed compression intake at Mach 2 have been carried out. The onset of intake buzz has been captured and analysed using computed results and experimentally in a supersonic wind tunnel. The method of throttle at the intake exit have been performed to obtain the different operations of intake. Intake buzz and its influence on different throttles are obtained with an indicated change in buzz frequency. It has also been observed that the oscillation cycle time for subsequent cycles vary rapidly for buzz oscillations. The established intake buzz phenomena have been mitigated by an active dynamic cowl tip deflection at an angular velocity of 174 rad/s. Three typical throttling ratios of TR = 0.54, 0.62, and 0.68 are tested with computationally deflecting the cowl at 7°, 12.5°, 21°, respectively. It has been observed that the Big Buzz due to Dailey-type characteristics of flow is predominant, and it is also confirmed that intake does not seem to encounter Ferri-type (Little Buzz) buzzing. This is also in accordance with observations made by Abedi et al. [Reference Abedi, Askari, Sepahi Younsi and Soltani11] and could be a special characteristic of axisymmetric intake. A pulsation phenomenon is obtained at the spike tip for high throttling ratios. At these high throttling ratios, the shock oscillations do not have a constant time period. It has been confirmed that the current method of cowl deflection could resolve the basic issues of shock system expulsion leading to intake unstart and violent oscillations. There appears to be different threshold values of cowl deflection angles with operation at different throttles. The overall quality of flow inside the intake duct does not improve much with this method at higher throttles. It is proposed that a hybrid method of flow enhancements could be attempted to completely improve the intake buzz situations with better intake performance as well such as involving bleeding methods along with this dynamic method of cowl deflection.