Congenital malformations of the heart and vessels occur in from 5 to 8 of each 1000 live births.1, 2 Up to one-sixth of these malformations do not require correction. The majority of the remaining malformations can now be corrected, or palliated in definitive fashion, and an increasing number of therapeutic procedures can be performed by interventional catheterisation, avoiding the need for open heart surgery.3 Definitive therapeutic procedures are increasingly carried out in early infancy, hoping to avoid the long-term complications known to result from the haemodynamic burden, or from chronic cyanosis. Such early definitive correction provides optimal conditions for successful “catch-up” growth, and a normalization of physical development.Reference Singer, Bjarnason-Wehrens and Dordel4
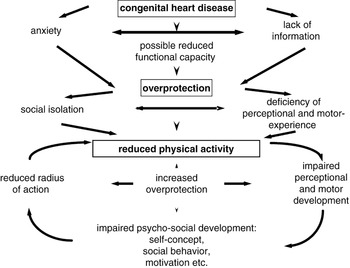
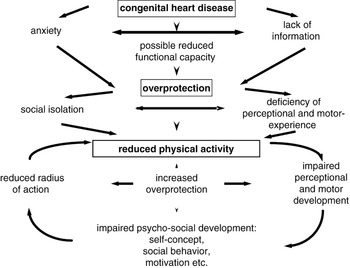
Children have a basic need for physical activity. Their perceptual and motor experiences determine not only their physical and motor development, but also impact decisively on their emotional, psychosocial, and cognitive development. Physical inactivity in childhood is abnormal, regardless of whether it is due to physical, emotional, psychosocial, or cognitive factors.Reference Bar-Or5 Oftentimes, a cardiac disease means a restriction of the perceptual and motor experience of the afflicted child. Complex and severe defects may, at least temporarily, because of the symptoms, reduce exercise tolerance. Periods of admission to hospital as inpatients, or for corrective surgery, are always periods of immobilization. Depending on the duration of such hospitalisations, and the age and mental stability of the child, they can lead to developmental stagnation or regression. Anxiety and worries about the ill child, furthermore, often cause parents to adopt an overprotective behaviour.Reference Brandhagen, Feldt and Williams6–Reference Utens, Verhulst and Erdman9 Great uncertainty still exists regarding the danger that might be exposed to the child with congenital cardiac disease by permitting engagement in physical activity. This is often, albeit unnecessarily, also the case with children whose physical capacities are grossly normal.Reference Uzark and Jones10, Reference DeMaso, Campis, Wypij, Bertram, Lipshitz and Freed11 In Figure 1, we show the conditional network of possible causes and effects of physical inactivity in children with cardiac disease. Considering the high relevance of physical activity and sports for current day social awareness, participation in physical activity together with healthy peers is known to improve the quality of life for children and adolescents. Particularly for them, physical activity and sports play an important social and socializing role. Children with congenital cardiac diseases, if they experience an exclusion from sports, and/or a restriction of their activity, can perceive this as extremely unpleasant. For example, when asked about their disadvantages in comparison to their peers, 62 children and adolescents with congenitally malformed hearts placed their physical restrictions in first place, even ahead of life expectancy and opportunities for employment.Reference Ratzmann, Schneider and Richter12
Vicious circle of reduced physical activity.
Physical inactivity in the youth leads not only to reduced physical performance, but also influences the entirety of physical and motor development. While numerous studies have investigated the exercise tolerance of children with various forms of congenital cardiac disease, relatively few studies have focused on the motor abilities of these children.Reference Bellinger, Wypij and duDuplessis13–Reference Unverdorben, Singer and Trägler17 Thus far, the scientific focus has predominantly been on children with complex cardiac malformations. The aim of our study, therefore, was to evaluate the motor development in a greater cohort of children with a wide spectrum of congenital cardiac disease of varied severity, and to compare the findings with those obtained from a representative cohort of healthy peers.
Materials and methods
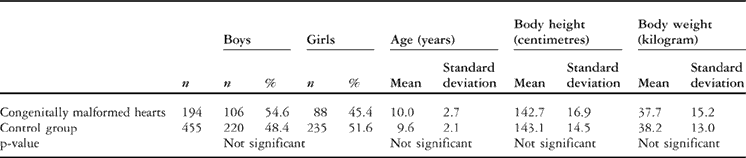
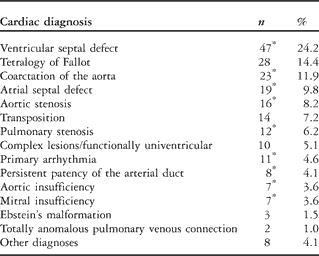
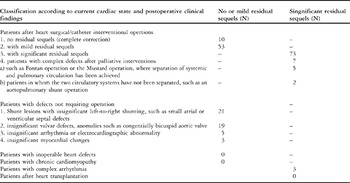
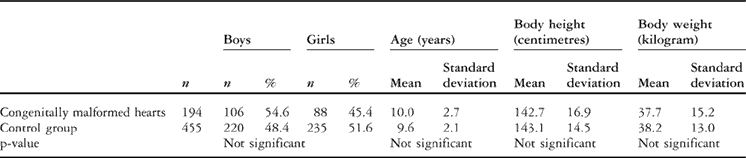
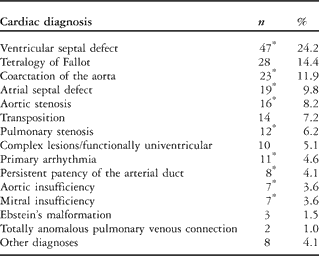
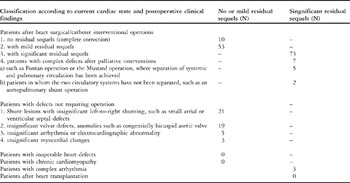
Between January, 2002, and December, 2005, we assessed the motor development in patients with congenitally malformed hearts attending for routine outpatient visits at the paediatric cardiology department of the university hospital of Cologne. We excluded all children with syndromes, disabilities, or co-morbidities with direct consequences for their motor abilities. This was also true for all children with obvious mental retardation, and those with other risk factors than the congenitally malformed heart for an abnormal neurological development, such as perinatally acquired cerebral lesions, auditory, and visual problems, Down’s syndrome, or other genetic alteration. We evaluated, therefore, a sample of 194 children, 106 boys and 88 girls, with a mean age of 10.0 years, standard deviation of 2.7 years, median of 10.0 years, and range from 5 to14.11 years. The sample represented the complete spectrum of congenital cardiac disease. Most of these children, 92.3%, reported regular participation in physical education at school, and a further 4.1% reported at least occasional participation. Only 2.6% of the children reported that they were excluded from participation, 4 children on medical advice, and 1 because of parental request. For the representative control group, we tested in 2005 complete school classes of children of the same age from Cologne. The control group included a total sample of 455 healthy children, made up of 220 boys and 235 girls, with a mean age 9.6 years, standard deviation of 2.17 years, median of 9.0 years, and a range from 7 to 14.11 years. In Table 1, we show the anthropometric data of both groups. In Tables 2 and 3, we list the primary cardiac diagnoses and the classification according to postoperative clinical findings in the group of children with congenitally malformed hearts.
Anthropometric data in the group of children with congenitally malformed hearts compared to the control group.
The primary cardiac diagnosis present in the group of children with congenitally malformed hearts (*also in combination with other diagnosis).
Classification of cardiac diagnosis according to current cardiac state and postoperative clinical findings. (adapted and modified according to 20).
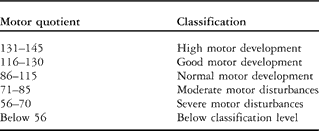
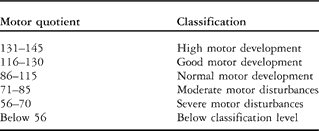
We used the bodily coordination test designed for children aged from 5.0 to 14.11 years18 to establish their development, especially the development of gross motor coordination. This test was developed in 1974 with the special aim of identifying deficits in motor development in children with minimal cerebral palsy, particularly those deficits that are not conspicuous in every day motor activities. The test is also useful in identifying deficits in motor development in children with other diseases or handicaps, as well as those based on physical inactivity, independent of its causes. The test is now the most commonly used procedure used to evaluate motor development in children in Germany, as well as in other German-speaking countries. It is a standardised objective test, which has been proven to have high retest-reliability and validity.19 In a substantial test manual,18 precise instructions are given for the implementation of its four exercises, as well as the evaluation and interpretation of the results. The test consists of two low speed components, namely the first motor quotient involving balancing backwards, and the second quotient involving monopedal jumping, and two high speed components, the third quotient involving sidewise jumping, and the fourth quotient requiring sidewise movement on boards. We summarise the test procedure in Table 4. The results allow the calculation of motor quotients adjusted for age and gender, and hence the classification of motor development (Table 5).18
The body coordination test for children.18

Classification of motor development depending on the motor quotient adjusted for age and gender, classification according to18.
Statistical analysis
The descriptive statistics of the anthropometric data, cardiac diagnosis, and the classification according to postoperative clinical findings, are provided in Tables 1 through 3. For statistical analysis, one-factorial variance analyses and Chi-Quadrate tests were performed with standard software. Values for p of less than 0.05 were considered statistically significant, and values less than 0.01 highly significant. All analysis was performed using the Statistical Package of Social Science 11.0.
Results
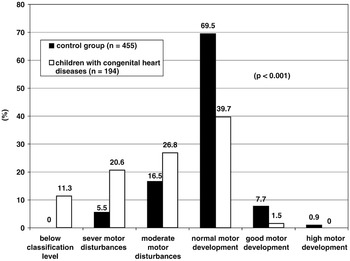
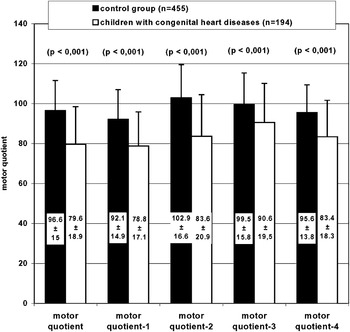
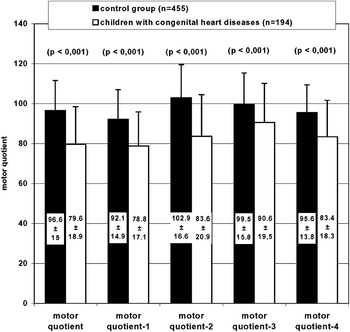
We demonstrate the classification of the motor development in children with congenitally malformed hearts compared to the representative control group of healthy peers in Figure 2. According to the classification, 58.7% of the children with congenitally malformed hearts had moderate to severe deficits in gross motor skills, and 31.9% were classified as having severe deficits. The results of the test revealed 78.1% of the control group to have a motor development that was normal or above average. The differences between the groups were significant at values for p of less than 0.001. Differences were not found for gender, but older children with congenitally malformed hearts, aged from 11 to 15 years, had more severe deficits compared with the younger children aged from 5 to 10 years, the value for p for this difference being less than 0.01. In Figure 3, we show the mean motor quotient, and the mean results for all subtests, in the group of children with congenitally malformed hearts compared to their healthy peers. The mean quotient, when adjusted for age and gender, was significantly lower in the group of children with congenitally malformed hearts, with a mean quotient of 79.6, and standard deviation of 18.9, as opposed to a mean quotient of 96.6, with standard deviation of 15 for the healthy peers, the value of p for the difference being less than 0.001. This was also true for the results of all the subtests.
Classification of the motor development18 in children with congenitally malformed hearts compared to a representative control group of healthy peers.

The mean motor quotient, and the mean results, in children with congenitally malformed hearts compared to a representative control group of healthy peers.
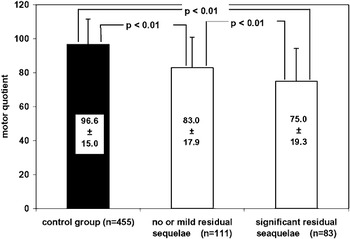
In order to find out if these differences were related to residual haemodynamic sequels, we divided the children with congenitally malformed hearts according to the presence and degree of residual sequels.Reference Bjarnason-Wehrens, Sticker and Lawrenz20 We classified 83 children as having none or mild residual sequels, and the remaining 111 as having significant residual sequels (Figure 4, Table 6). As expected, the mean motor quotient in those with significant residual sequels was significantly lower than for those with no or mild residual sequels, at a mean of 75, with standard deviation of 19.3 versus mean of 83, with standard deviation of 17.9. The value of p for this difference is less than 0.01. This was true also for the results of the second, third, and fourth subtests, but not for the first subtest, which tests the ability to balance backwards. More meaningful are the findings that, in both subgroups, the mean motor quotient was significantly lower, with a value for p of less than 0.01, than in the control group. This was true for the results of all subtests.
The mean motor quotient in children with no or mild residual sequels compared with those having significant residual sequels and to a representative control group of healthy peers.

The mean motor quotient, and the mean results from the test, for children having no or mild residual sequels compared to those with significant residual sequels and a representative control group of healthy peers.

** = p-value less than 0.01 compared to control group, * = p-value less than 0.05 compared to control group, ## = compared to children with no or mild residual sequels.
In Table 7, we demonstrate the results of analysis of the subgroups in which we compare primary cyanotic with primary acyanotic cardiac diseases. Of the children, 4 were cyanosed at testing. The results show significant differences between the two groups. The mean motor quotient in the cyanotic patients was significantly lower than for those who were acyanotic, with a mean of 69.9, and standard deviation of 18.9 as opposed to a mean of 83.1, and standard deviation of 17.6. The value of p for this difference is less than 0.001. This was also true for the results of the second, third and fourth subtests, but not for the first subtest for balancing backwards. In both subgroups, and also in the group of children with acyanotic cardiac diseases, the mean motor quotient was significantly lower, with a value of p of less than 0.01, than in the control group, with a significant difference for the results of all subtests.
The mean motor quotient, and the mean results for children born with congenital cyanotic defects compared to those born with acyanotic disease, and a representative control group of healthy peers.

** = p-value less than 0.01 compared to control group, * = p-value less than 0.05 compared to control group, ## = p-value less than 0.01 compared to children with acyanotic congenital heart diseases.
In Table 8, we compare the results from children which had undergone open heart surgery with those who had not. The group not undergoing surgery includes those who had required no treatment at all, as well as those with closed heart or interventional catheterisation procedures. The mean motor quotient in those undergoing open heart surgery was significantly lower than for those not having surgery, at a mean of 77.2, with standard deviation of 18.6, versus a mean of 83.3, and standard deviation of 18.7, giving a value of p of less than 0.05. This was also true for the results in the both high speed exercise subtests, but not for the tests exploring low-speed exercise. In both subgroups, the mean motor quotient was significantly lower, with a value of p of less than 0.01, than in the control group, as well as for the results of all subtests.
The mean motor quotient, and the mean results for children after open heart surgery compared with those who did not require surgery, and to a representative group of healthy peers.

** = p-value less than 0.01 compared to control group, * = p-value less than 0.05 compared to control group, ## = p-value less than 0.01 compared to children without open heart surgery, # = p-value less than 0.05 compared to children without open heart surgery.
Discussion
Numerous studies have investigated the exercise tolerance of children with various forms of congenitally malformed hearts. Depending on the severity of the malformation, the success of corrective procedures, the presence and degree of residual sequels, physical performance may be limited.Reference Fredriksen, Ingjer, Nystad and Thaulow21–Reference Weipert, Koch, Haehnel and Meisner29 Even children with mild uncorrected lesions, or without residual sequels after previous surgery, may reveal a substantial reduction in their physical performance.
Few studies have focused on the motor abilities of children with congenitally malformed hearts. Bellinger at al.Reference Bellinger, Wypij and Kuban14 demonstrated a retardation of motor development for both gross and fine motor skills after follow-up of 4 years following an uncomplicated neonatal arterial switch operation. The duration of total circulatory arrest was closely linked to gross, but not to fine motor skills. Distinctive limitations in fine motor skills and visual spatial skills were observed after follow-up of 8 years in the same cohort.Reference Bellinger, Wypij and duDuplessis13 In their assessment of gross and fine motor skills of children with congenitally malformed hearts compared to healthy peers, Stieh et al.Reference Stieh, Kramer, Harding and Fischer16 discovered significant deficits in motor development of children with cyanotic defects, as opposed to those with acyanotic diseases. In contrast to the data of Stieh et al.,Reference Stieh, Kramer, Harding and Fischer16 however, an earlier investigation from our group had revealed deficits in both fine and gross motor skills for both cyanotic and acyanotic lesions, with twothirds of our sample showing moderate to severe deficits in gross motor skills.Reference Dordel, Bjarnason-Wehrens and Lawrenz15 Unverdorben et al.Reference Unverdorben, Singer and Trägler17 demonstrated comparable results. They made the interesting observation that, independent of the severity of the disease, children who were excused from physical education classes showed significantly reduced motor performance when compared to children participating in physical education in school.
The findings of our current study confirm the results of these earlier investigations. We have found deficits in motor development in almost three-fifths of the children with congenitally malformed hearts, and significant differences when compared with their healthy peers. The mean motor quotient, when adjusted for age and gender, was significantly lower in the setting of congenital cardiac disease. This was also true for all components of the test, and was seen in those with significant residual sequels, as well as in those with no or mild residual sequels. While some restrictions regarding physical activity might be recommended in children with significant postoperative clinical findings, the group of children with no or mild residual sequels do not require any restrictions, and should be taking part in normal physical activity. Especially in this group, overprotection, and the resulting lack of physical activity, may contribute to the reduced motor development.
The impact of a congenital cardiac malformation on the development of the affected child depends on the type and severity of the malformation, as well as the timing and success of therapeutic measures. For some complex malformations with functionally univentricular physiology, only palliative solutions are available. Lesions such as tetralogy of Fallot,Reference Norgaard, Lauridsen, Helvind and Pettersson30 atrio-ventricular septal defectReference Schaffer, Berdat, Stolle, Pfammatter, Stocker and Carrel31 and transpositionReference Hutter, Kreb, Mantel, Hitchcock, Meijboom and Bennink32 can now successfully be corrected in infancy with good long-term outcomes. After such successful correction in infancy, most of the children borne with cyanotic congenital cardiac malformations are able to participate in all physical activities appropriate to their age along with their healthy peers.
Our findings confirm the results of Stieh et al.,Reference Stieh, Kramer, Harding and Fischer16 showing that children with cyanotic diseases have a significantly lower mean motor quotient than those with acyanotic disease. This was true for all components of the test, apart from the first subtest which explored balancing backwards. In contrast to the results of Stieh et al.,Reference Stieh, Kramer, Harding and Fischer16 however, our investigations show a significantly lower mean motor quotient in children with cyanotic as well as acyanotic defects when compared to healthy peers. Children who had undergone open heart surgery performed less well than those not subjected to open heart surgery. This was significant for the mean motor quotient, as well as for the high speed exercises producing the third and fourth motor quotients. In both subgroups, the mean motor quotient was significant lower than that found in healthy peers.
It is well recognised that neurological impairment might be caused by persistent preoperative low cardiac output, acidosis, and/or hypoxia,Reference Deanfield, Thaulow and Warnes33 or from ischaemia related to surgery.Reference Wernovsky and Newburger34 The duration of hypothermic circulatory arrest during surgery,Reference Bellinger, Wypij and duDuplessis13, Reference Wypij, Newburger and Rappaport35 as well as the duration of a persistent low output state requiring intensive medical care after surgery, are associated with later neurologic deficits.Reference Newburger, Wypij and Bellinger36, Reference Dunbar-Masterson, Wypij and Bellinger37 To avoid such potentially confounding factors, we excluded all children with recognised syndromes, disabilities, or co-morbidities which might have affected their motor development. We also excluded children with obvious mental retardation or abnormal neurological development from other causes. We suggest that a significant proportion of the deficits in motor development observed are primarily due to lack of efficient perception and experience of movement due to restrictions in physical activity.
Overprotection of the children by the parents and teachers could be the main reason for the observed deficits. It is well known that parents and other caregivers play an important role in childhood development.Reference Collins, Maccoby, Steinberg, Hetherington and Bornstein38 One factor that might influence the style of parenting is the state of health of the child.Reference Dolgin, Phipps, Harow and Zeltzer39 Parental attitude may significantly influence global development of the child, as well as influencing the strategies used for coping. Parents of children with congenitally malformed hearts might consider altering the patterns used to rear their children so as to assimilate their special needs.Reference Carey, Nicholson and Fox40 This recent studyReference Carey, Nicholson and Fox40 has revealed that mothers of children with congenitally malformed hearts report higher levels of vigilance with their children than mothers of healthy age-matched children. The attitude and anxiety of overprotective parents might also reduce the exposure of their children to peers, not least regarding physical activity, and this might influence the social competence and motor development of the children, contributing to the observed retardation.Reference Brandhagen, Feldt and Williams6, Reference Kong, Tay, Yip and Chay7, Reference Utens, Verhulst and Erdman9 Parents of children with congenitally malformed hearts are more likely to report significant evaluated levels of parental stress compared to the normal population.Reference Uzark and Jones10, Reference Morelius, Lundh and Nelson41 This high level of stress is unrelated to the severity of the disease suffered by the child. Parents of children with less severe malformations experience as much stress as do those with children having more complex cardiac malformations.Reference Uzark and Jones10, Reference Morelius, Lundh and Nelson41 Parental stress tends to be higher in those with older children, when it becomes more difficult for them to set limits and maintain control.Reference DeMaso, Campis, Wypij, Bertram, Lipshitz and Freed11 Mothers are most concerned about the medical prognosis of their child, and also have concerns regarding the quality of life, including aspects like function and physical limitations.Reference Van Horn, DeMaso, Gonzalez-Heydrich and Erickson42 A questionnaire focussing on the extent and nature of advice concerning exercise given over the previous years in young adults with congenitally malformed hearts revealed that, in seven-tenths of the individuals, the topic of exercise had never spontaneously been raised by either the paediatrician, the general practitioner, or the cardiologist.Reference Swan and Hillis43 To avoid the style of parenting that produces anxiety and overprotection, as well as reducing concerns about physical limitations and safe activities, it is of outmost importance that physicians regularly address this aspect in their interviews with parents, and give clear and comprehensive advice in addition to offering the parents the opportunity to bring up their concerns and special questions.Reference Van Horn, DeMaso, Gonzalez-Heydrich and Erickson42
It is of interest that deficits in motor abilities were present even though over nine-tenths of the children reported regular participation in physical education at school. This demonstrates that the physical education at school is not able to compensate for deficits potentially occurring in preschool age. It is of outmost importance to integrate these children into school sport, but this does not normally take into account the special needs of these children, especially their need for additional specific motor training. The existing deficit could easily be compensated through specific motor training. Results of empirical studies show that physical and motor performance of children and adolescents with congenitally malformed hearts can be enhanced through regular engagement in autonomous or supervised physical activity.Reference Dordel, Bjarnason-Wehrens and Lawrenz15, Reference Fredriksen, Kahrs and Blaasvaer22, Reference Longmuir, Tremblay and Goode24, Reference Longmuir, Turner, Rowe and Olley25 Furthermore emotional, psychosocial, and cognitive developmental processes can also be positively influenced by such programmes.Reference Dordel, Bjarnason-Wehrens and Lawrenz15, Reference Fredriksen, Kahrs and Blaasvaer22, Reference Longmuir, Tremblay and Goode24, Reference Longmuir, Turner, Rowe and Olley25 The required improvement of physical activity in children with congenitally malformed hearts should start as early as possible. In this way, deficits in perceptual and motor experience, and their negative consequences, can be minimized. Children need to be provided with the opportunity to act out their basic need for physical activity, and should only be stopped if there is a specific danger of sudden death. They should participate in physical activity, both indoors and outdoors, and with their peers, in an as unrestricted fashion as is possible. This applies to play and guided activity in kindergarten, school, and/or sports clubs. Participation in specific, possibly medically supervised, programmes for the promotion of motor abilities can help to limit motor deficits, and prepare and support the integration of children into their peer groups.Reference Ratzmann, Schneider and Richter12, Reference Mitchell, Maron and Epstein50
With improved life expectancy, growing attention is given to the question of whether, and to what extent, physical activity should be recommended in order to improve the quality of life. Numerous groups of experts have provided recommendations concerning exercise for children with congenitally malformed hearts.Reference Driscoll44–Reference Washington55 Additionally, recommendations for the implementation of medically supervised heart groups have been published in Germany.Reference Bjarnason-Wehrens, Sticker and Lawrenz20 These recommendations can contribute to avoiding unnecessary exclusion of children and adolescents with cardiac disease from physical activity and sport. Moreover, they can minimize the insecurity of the children, their parents, and their teachers with regard to the abilities of the afflicted child.
In keeping with these recommendations, all youths with congenitally malformed hearts who fulfil the necessary requirements should have the opportunity to participate in physical activity. If needed, they should take part in specially adapted programs of physical education.
In conclusion, our results have demonstrated deficits in motor development not only in children with significant postoperative clinical finding, but also in those with no or only mild residual sequels. The abnormal findings were discovered in those with acyanotic lesions, as well as in those who did not require an open heart operation. Most of these children do not necessarily require any restrictions regarding their physical activity due to their cardiac disease. Paediatricians, cardiologists, and others caring for these children, should link their focus on future motor development in order to identify deficits as early as possible, and if necessary, to implement appropriate therapeutic measures. It is crucial, therefore, to take sufficient time and patience to educate the parents concerning the physical activity and education required by their offspring.