INTRODUCTION
Wheat is one of the most important agricultural commodities in Turkey, and the country ranks among the top ten producers in the world. It is a strategic crop and an essential component in the Turkish diet. Most of the wheat production comes from rainfed areas and total annual wheat production fluctuated between 18 and 20 million metric tons during the 1995–2004 period (FAO, 2008). Wheat production increased in the late 1970s, enabling the country to become a wheat exporter. With its research infrastructure and a core of well-trained scientists, Turkey has also made significant contributions to international efforts to improve winter wheat production.
In 1986, the Government of Turkey and CIMMYT, joined by ICARDA in 1990, established the International Winter Wheat Improvement Program (IWWIP). More than 40 improved wheat varieties have since been jointly developed, disseminated and grown by producers both in Turkey and elsewhere in the world (IWWIP, 2009). Other varieties were also introduced into the country, and both private companies and public agencies contributed to this effort. However, there has been no systematic monitoring of the adoption of the new varieties, and economic impacts on producers were not evaluated. Key socio-economic research questions remain unanswered, especially whether these improved varieties have effectively contributed to achieve their intended impacts.
Turkish government policy stimulates agricultural production through input subsidies, low taxation, price supports, subsidized credit, research and education programs, and the establishment of model farms (Mazid et al., Reference Mazid, Amegbeto, Keser, Morgounov, Peker, Bagc, Akin, Kucukcongar, Kan, Karabak, Semerci, Altikat and Yaktubay2009). Generally and for nearly all crops, the Government provides subsidy for the use of certified seeds.
Between 1938 and 2002, the wheat market has been state-controlled through the Turkish Grain Board (TGB), which announces official prices and aims to purchase all wheat grain from producers. However, since 2002, the market has been highly liberalized, and the TGB now only announce the minimum buying prices. The actual purchasing price of wheat has since been determined by market forces, depending on the quality and quantity of the grain. In 2007, there was a direct subsidy to producers of wheat of 45 TL per metric tons (around US$ 37.5) (MARA, 2008).
The objectives of this paper are to document the adoption of five new winter and spring wheat cultivars in Turkey, and to assess their economic impacts under rainfed and irrigated conditions in different agricultural zones in selected provinces of Turkey (Figure 1). These varieties were developed by the national breeding program and through international collaboration over the past 10–15 years. Specifically, the study evaluated the technical, economic and social impacts of the monitored varieties on the livelihoods of producers through increased wheat productivity, profitability and household income.
Agricultural zones of Turkey.

MATERIALS AND METHODS
Fundamental to economic analysis is the idea of a production function, which describes the maximum output obtainable at the existing state of technological knowledge and with given amounts of factor inputs. Production function analysis provides a theoretical framework to estimate the comparative productivity of inputs used in a production process. The most straightforward approach to link formally the notions of technical change with measured rates of productivity growth is to assume that an index of the state of technology can be incorporated directly in a production function. Hence, technological progress is perceived as an upward shift in production function.
Many functional forms have been defined in the literature for the analytic study of production process (Griffin et al., Reference Griffin, Montgomery and Rister1987; Semerci et al., Reference Semerci, Mazid, Amegbeto, Keser, Morgounov, Peker, Bagci, Akin, Kucukcongar, Kan, Karabak, Altikat and Yaktubay2012). However, economic theory provides mainly generic conditions of specification and provides little guidance for specifying a function. Any attempt to fit a production function immediately confronts the specification problem, i.e. choosing arguments, and the algebraic form of the function. Satisfactory specification must consider the technological conditions governing each production process.
The Cobb-Douglas function is by far the most widely used in agricultural economics because of its simplicity and ease of estimation. It permits the calculation of returns to scale and embodies the entire marginal productivity theory of distribution. The disadvantage is that the Cobb-Douglas function implies perfect substitutability between the factors of production. The general form for the Cobb-Douglas function is:
 \begin{equation}
{Y} = A\mathop \Pi \limits_{i = 1}^n X_i^{\beta _i } ,\quad \beta _i \succ 0;i = 1,2,...,n.,\end{equation}
where Y is the output, and X is a vector of essential inputs used in production, and n is number of inputs used. The parameter A is the combined effects on the production function of all inputs (rainfall, weather, disease outbreaks, etc.) that are not under the strict control of the farmer. Empirically, a logarithmic transformation in the following format was made, and dummy variables included distinguishing the impact of the improved varieties being monitored on crop productivity:
 \begin{eqnarray}
\ln (Y) &=& \ln (A) + \sum\limits_{i = 1}^n \beta _i \ln (X_i ) + \sum\limits_{j = 1}^J {\delta _j D_j } + \varepsilon; \quad \beta _i \succ 0,\nonumber\\
i &=& 1,2,\ldots ,n;\quad j = 1,2,\ldots, J.\end{eqnarray}
where Y is the output measured per unit land area, Xi are variable inputs such as seeds and fertilizers used per unit of land, Dj are dummy variables for varieties, production system, and variety type, which take the value of 1 for monitored varieties, irrigated system, or durum wheat variety, and zero otherwise; and ε is the error term of the regression equation. A significantly positive/negative coefficient estimated on the dummy variable representing the improved variety reflects an upward/downward shift in the intercept of the production function due to the new technology. Alternatively, it means an increase/decrease in total factor productivity as a result of variety adoption. The same interpretation is valid for other dummies included in the model. After the estimation of the log-linear form above, the anti-log of the intercept term ln(A) gives the actual value of A when one is interested in the contribution of factors not controlled by the farmer such as weather condition, diseases, etc.
Agricultural research for development is largely a social process in which people construct solutions to their problems, often by modifying both new technologies and their own production systems to take advantage of new opportunities offered by the technologies (Douthwaite et al., Reference Douthwaite, Kuby, de Fliert and Schulz2003). Hence, agricultural change is an immensely complex process, with a high degree of non-linearity; therefore, an impact assessment approach is needed.
One main point in the impact assessment is to show how a new technology affects farmers of different socio-economic status. Cavendish (Reference Cavendish1999) in Shindi Ward of Chivi area in Zimbabwe, and Campbell et al. (Reference Campbell, Jeffrey, Kozanayi, Luckert, Mutambo and Zindi2002) in semi-arid regions of Indonesia, used wealth index and wealth quartiles methods to study the impact of new technology on household livelihoods in semi-arid regions in Indonesia. This can be done by first classifying households into different socio-economic types using their assets (e.g. human, natural, physical, social and financial) and then determining the adoption of technology in these household types, and this allows determining whether the technology is beneficial to both poor and better-off households. For this purpose, the wealth index was created using factor analysis, which is a statistical technique similar to principal components analysis. These analyses have the common objective of reducing relationships between many interrelated variables to a small number of factors. However, the primary purpose of factor analysis is to describe the relationships among the many variables in terms of a few underlying but unobservable factors; thus, many original variables are combined into a few derived variables. In calculating the wealth index (Mazid et al., Reference Mazid, Shideed, El-Abdullah, Zyadeh and Moustafa2013), the coefficients of variables estimated by factor analysis were multiplied by standardized values of the respective variables for each factor (Xi). Household-specific wealth indices were constructed from scores obtained from factor analysis, according to:
 \begin{equation*}
X^* = \sum w_i X_i,
\end{equation*}
where X* is the score for each household, Xi is the value of factor i and has a mean of zero and standard deviation of 1, and wi is weight, specified for the maximum variance of factor i.
The analysis focused on estimates of sample averages as well as the distribution of selected indicators on productivity, income and poverty. It also used econometric analysis to determine productivity increases (Mazid et al., Reference Mazid, Amegbeto, Keser, Morgounov, Peker, Bagc, Akin, Kucukcongar, Kan, Karabak, Semerci, Altikat and Yaktubay2009). However, this paper concentrates on descriptive analyses, which are useful techniques for organizing and summarizing the data, and are particularly useful when large amounts of data need to be interpreted.
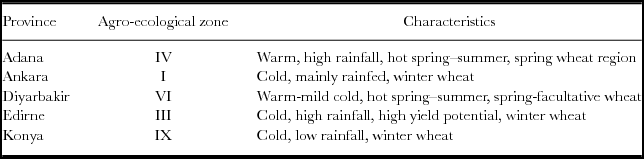
Multi-stage-stratified random sampling was applied to five provinces, and dominant production systems by district or cluster of districts, communities, and wheat-producing households. The provinces of Adana, Ankara, Diyarbakir, Edirne and Konya were selected, based on information about the distribution and use of improved varieties being monitored. These also have diverse agro-ecologies (Table 1), and represent the largest wheat production provinces, accounting for 1.9 million hectares of the national total of 8.6 million hectares of cultivated wheat in 2007.
The main agricultural characteristics of the selected provinces.

Within each province, districts were classified into two predominant wheat production systems (rainfed and irrigated) and to the two types of wheat (bread or durum) predominantly cultivated. Farmers in rural communities were randomly selected in the respective systems using lists obtained from census offices of Turkish Statistical Institute (TSI), with distribution of farm households across production systems proportional to their relative importance in terms of area of wheat cultivated. The survey was implemented between January and May 2008, and a total of 781 questionnaires were completed from direct interviews of producers.
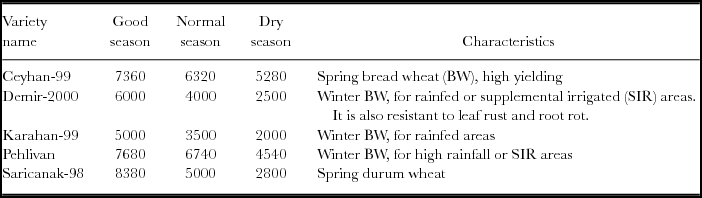
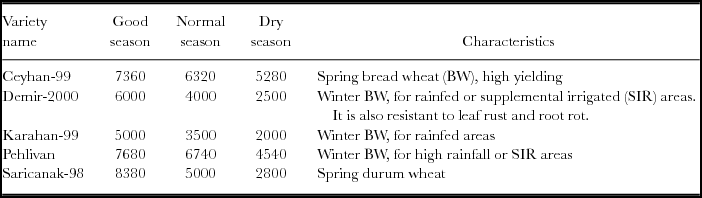
A total of 45 different wheat varieties were found during the survey. The five monitored varieties (Ceyhan-99, Demir-2000, Karahan-99, Pehlivan and Saricanak-98) were released a relatively short time ago compared to other cultivars grown, and these are the most promising in much of their target areas according to agricultural research results (Table 2). There were 13 wheat varieties released before 1995 that are classified as ‘old improved varieties’, and 27 released during or after 1995 are classified as ‘other new varieties’ (Mazid et al., Reference Mazid, Amegbeto, Keser, Morgounov, Peker, Bagc, Akin, Kucukcongar, Kan, Karabak, Semerci, Altikat and Yaktubay2009).
Potential yields of monitored wheat varieties (kg ha−1).
Source: MARA Variety Registration and Seed Certification Center, Agricultural Research Institutions (2008).
Many impact studies focus on measuring yield increase and profitability of new technologies. This paper, in addition, evaluates the notions of adoption, productivity, yield stability, economic and social impacts derived from the monitored improved wheat varieties.
RESULTS AND ANALYSIS
The wealth index
A livelihood comprises the assets, activities and access to these as regulated by institutions and social relations – together they determine the living gained by individuals or households (Chambers and Conway, Reference Chambers and Conway1992; Haidar, Reference Haidar2009). Building livelihoods is an ongoing process with constantly changing elements, and alterations in the quality and quantity of natural resources. These elements affect crops that farmers can grow and have direct implications on the livelihoods of those who depend on them. In the short-term, such changes in resources and crops grown have a great effect on people's livelihoods.
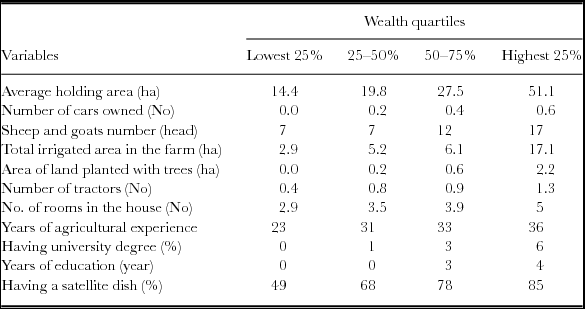
The wealth index was created considering human, natural, physical, social and financial household assets for ranking households in the sample. In the wealth ranking, variables important in distinguishing households from each other were identified (Mazid et al., Reference Mazid, Amegbeto, Keser, Morgounov, Peker, Bagc, Akin, Kucukcongar, Kan, Karabak, Semerci, Altikat and Yaktubay2009). The wealth index was sorted into categories and classified households in the sample into four welfare quartiles. Five elements were used to represent household well-being: human, natural, financial, physical and social capitals (Carney, Reference Carney1998; Haidar, Reference Haidar2009); and several variables were selected as indices for assessing welfare status. The variables included in creating the wealth index were total holding area, number of cars owned by the household, livestock numbers, total irrigated area in the farm, area of land planted with trees, number of tractors, number of rooms in the house, years of agricultural experience, having a university degree, years of education and having a satellite dish. Every variable has been increased when wealth index is increased (Table 3). Even in the lowest quartile, 25% of the farmers have tractors, which is the main asset in farming. However, the efficiency of the tractors usage in lowest quartile is questionable, as their land is not enough to fully occupy the tractor in their land.
Households characteristics by wealth quartiles.
Source: Survey data.
Variety adoption
Variety diversity at household level
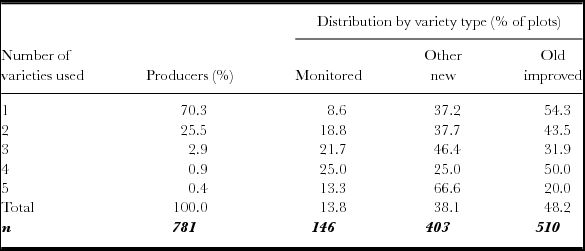
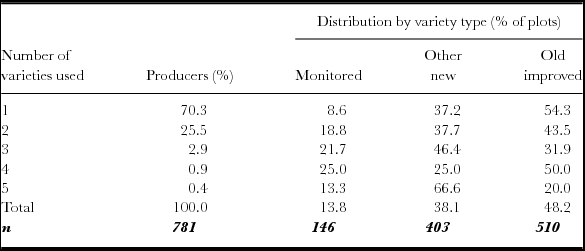
Given the high diversity of wheat varieties available for producers in the study areas, their distribution according to the number grown during the crop year was investigated. Results show that from the sample of 781 households surveyed, 70% of producers reported growing single variety, and 30% used several varieties on their farm, 26% of them cultivated two varieties, and a considerably lower number of producers produce higher number of varieties (Table 4), with only 0.4% of the sampled producers cultivating five different wheat varieties during that cropping year.
Distribution of producers by number and type of wheat varieties grown.
Source: Survey data.
Bold italic values indicate the number of observations in the sample and no statistics analysis was done.
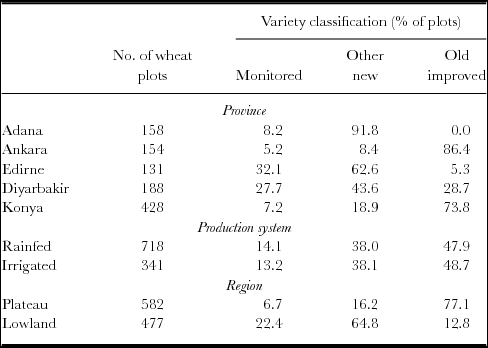
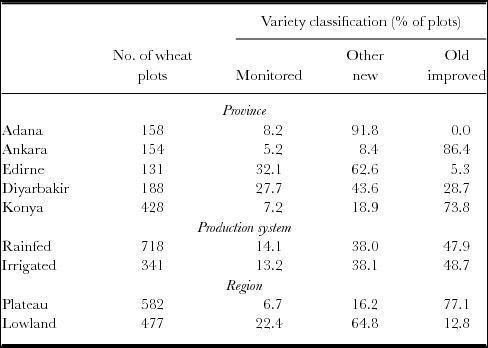
Regardless of the pool of different improved varieties, providing a great opportunity for selection and on-farm genetic diversity in the study area, results show a tendency of producers to specialize with respect to varieties and to stick to the most preferred one. This pattern is observed equally across provinces and regions as well as rainfed and irrigated systems. Thus, wheat biodiversity, although very high at country level, is very low at the household level. A possible reason is that producers may be minimizing the risks of on-farm grain mixing, and the potential of losing market value for their harvest because they are priced according to strict purity and other quality characteristics. The rate of adoption of the monitored varieties on the sample level as measured by the percentage of wheat fields on which they were cultivated is 13.8% against 38.1% for other new varieties, and 48.2% for the old improved varieties (Table 4).
Adoption of wheat varieties
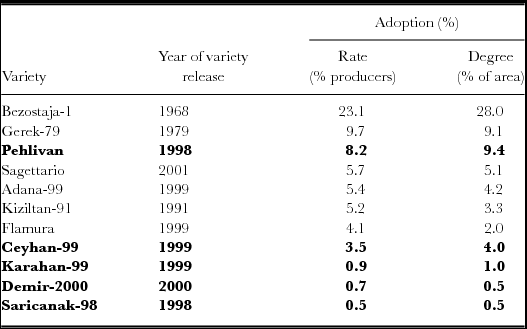
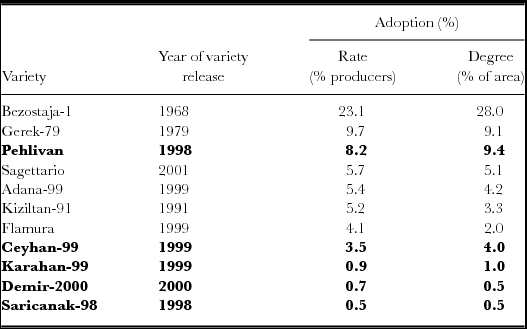
The adoption rate is commonly measured as the proportion of producers using the improved variety being studied, while degree of adoption represents the proportion of area under the new varieties (Shideed and El Mourid, Reference Shideed and El Mourid2005). In the context of the present study where producers used more than one variety, some of these producers simultaneously used a monitored variety and other varieties that fall in other classifications. Taking advantage of the fact that different varieties are rarely grown together in the same field, the proportion of fields cultivated with each type of variety is used as a measure for adoption degree. Among all varieties cultivated by the sampled producers, Pehlivan specifically ranks third in terms of adoption rate (8.2%), after Bezostaja-1 (23%) and Gerek-79 (10%). The adoption rate is 3.5% for Ceyhan-99, 0.9% for Karahan-99, 0.7% for Demir-2000 and 0.5% for Saricanak-98. Among all 45 different varieties recorded in the survey, the variety ranking according to adoption rate is 8th position for Ceyhan-99, 20th for Karahan-99, 21st for Demir-2000 and 28th for Saricanak-98. The adoption degrees for individual varieties follow a similar trend (Table 5).
Adoption rate and degree of wheat varieties.
Source: Survey data.
The bold values indicate the monitored varieties and no statistical tests were made.
Adoption of the monitored varieties differs substantially across provinces, with the highest adoption rate in Edirne (32%) and Diyarbakir (28%) and the lowest in Ankara (Table 6), whereas adoption is nearly the same across rainfed and irrigated production systems (13–14%). Other new varieties were widely adopted in some provinces, highest for Adana (92%), followed by Edirne (63%) and Diyarbakir (44%), and similarly, old improved varieties are widely used in Ankara (86%) and in Konya (74%). Therefore, there is much competition between the monitored varieties and others available, particularly in Ankara and Konya (plateau region), and also in Adana where adoption rates are very low (below 10%). Several factors may explain this, particularly the criteria used by producers to define their preferences, such as agro-ecological zone having high adoption rate in higher yield potential areas, such as in Edirne, low income of farmers, residency outside the village and having off-farm activity.
Adoption rates of wheat varieties by province, production system and the region.
Source: Survey data.
The survey results indicated that adoption of the five monitored varieties was low where adoption rate was 13.8% and adoption degree was 15.4% of the total growing area, while 49% of the area under wheat is still cultivated with old varieties. Two main reasons can explain the low adoption: these are farmers’ perceptions towards characteristics of these varieties and the activities of the institutions responsible for seed production and dissemination.
The characteristic, which scored highest among wheat producers of the new varieties was the high yield, reported by 65–100%. Other old improved varieties also scored highly among producers. Farmers perceived that the variety Adana-99, Bezostaja-1, Cesit-1252, Firat-93, Gelibolu, Flamura-85, Gerek-79, Kiziltan-91, Konya-2002, Nurkent, Sagettario and Ukrayna are high-yielding varieties. For disease resistance, 28–50% of producers preferred Adana-99, Golia, Cesit-1252, Guadelope and Sagettario. For resistance to waterlogging, 38–80% listed Adana-99, Diyarbakir-81, Golia, Pandas and Sagettario. For fetching a good market price, 60–100% listed Aydin-93, Bezostaja-1, Dariel, Ekiz, Flamura, Gonen, Kiziltan-91, Pandas, Sagettario and Tekirdag. For drought resistance, 60–100% preferred Dagdas-94 and Gerek-79; this also explains why old varieties, such as Gerek79 have been grown, especially under rainfed condition and low-yielding locations like in Ankara. In short, producers have the choice between diverse wheat germplasm, some of which are as good as the new varieties. On the other hand, some negative characteristics were mentioned by producers regarding the new wheat varieties: some farmers perceived Saricanak-98 yields to decline over time, Ceyhan-99 was susceptible to cold or frost, and Pehlivan was perceived by 11% of farmers as susceptible to diseases.
Seed availability of new varieties for farmers at an acceptable price is essential for technology uptake. Turkey has made major economic changes and adopted a free market economy. These reforms affected the agricultural sector in general and the seed sector in particular. The state monopoly on seed sector is eliminated and opening up opportunities for the private sector and liberalizing seed prices. Farmers in this study indicated that they faced difficulties in finding certified wheat seed for the wheat varieties they wanted to grow and indicated that the price is relatively high, and the private seed sector is focusing on more profitable crops such as vegetables more than wheat. Other farmers mentioned that they were not aware of the existence of new wheat varieties.
Impact of the new varieties on productivity
Comparison of wheat yields
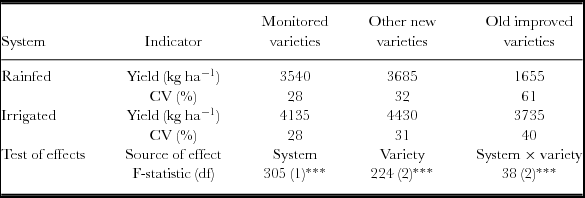
The impact of different varieties on productivity is assessed through a comparison of average yields between variety groupings (using data provided by farmers). In the rainfed system, the average yield obtained from the monitored varieties is 3540 kg ha−1 compared to 3685 kg ha−1 for other new varieties and 1655 kg ha−1 for old improved varieties (Table 7). Under irrigation, monitored and other new varieties gave average yields of 4135 and 4430 kg ha−1, respectively, and old improved varieties is 3735 kg ha−1 (Table 7). There was no statistical difference between the monitored varieties and the other new varieties under either rainfed or irrigated conditions, but both gave higher yields than the old improved varieties. However, for monitored varieties, if divided by region and irrigation regime, results indicated that monitored varieties were superior in the plateau region under rainfed conditions.
Comparison of yield and standard deviations by variety and production system.
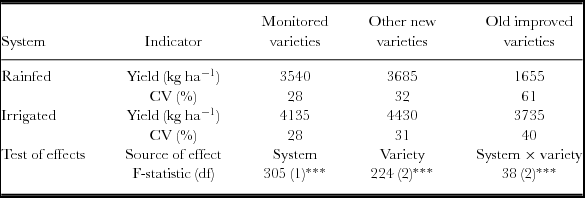
Note: F-statistics derived from univariate analysis of variance; ***Yield differences are significant at 1% level.
Source: Survey data.
Comparative yield stability
Achieving high and stable yields is an important selection criterion in wheat-breeding programs. Stability may be reached over time or across several production locations. Following Barkley and Porter (Reference Barkley and Porter1996) and Barkley and Peterson (Reference Barkley and Peterson2008), yield stability is measured by the coefficient of variation of yields calculated across producers who use the respective varieties. The monitored wheat varieties have the lowest coefficients of variation among all wheat varieties under both rainfed (28%) and irrigated (28%) production systems (Table 7). Thus, they provided more stable yields compared to other groups especially to old improved variety, and irrigation contributes to lower yield variability and therefore to achieving greater stability.
Production function analysis
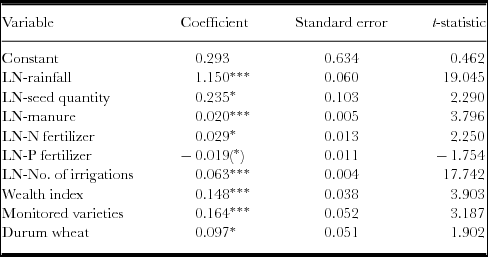
Results of the Cobb-Douglas production function are presented in Table 8. Estimated coefficients on the continuous variables represent elasticities measuring the percentage increase in yield in response to increases in the respective inputs. The coefficient for monitored varieties is positive (0.164) and significantly different from zero at the 1% level. This implies that with the same levels of other farm inputs, the monitored varieties do indeed increase wheat yields compared to other varieties.
Parameter estimates for determinants of wheat yield using the Cobb-Douglas function.
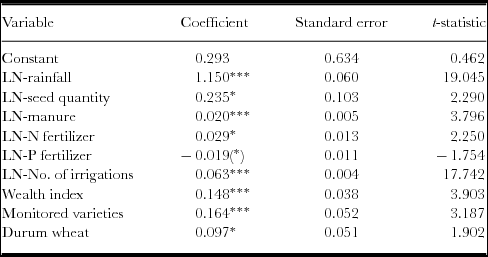
Note: Adj R-squared equals 39.4. Coefficient is statistically different from zero at 0.1% (***), 1% (**), 5% (*), and 10% (*) probability levels, respectively.
The other inputs that contribute significantly to increased productivity in wheat production in Turkey are the amount of water available to the crop through rainfall or irrigation, and the quantity of seed, manure and/or nitrogen fertilizer. The most important is water, which increases wheat production by 11.5% for a 10% increase in its level, or productivity may decline by 11.5% following a 10% reduction in rainfall as a result of drought. The importance of water is additionally stressed by the positive and significant coefficient estimate associated with the number of irrigations provided by producers. There is also a net increase of productivity by 10% for durum wheat varieties over the bread types.
However, wheat shows a negative response to phosphorus fertilizer application, because in many parts of the country, the soil is rich in this mineral. In addition, wheat productivity increases with the wealth level of the producer as indicated by the positive and significant coefficient on the wealth index. Given that the use of external inputs and mechanization is encouraged through government programs, it is not surprising that producers who can afford these inputs are more likely to increase productivity over those who cannot do so. The sum of all the main inputs is 1.45, thus suggesting there is potential for wheat production to increase more than the proportionate increase in these inputs.
Profitability of wheat varieties
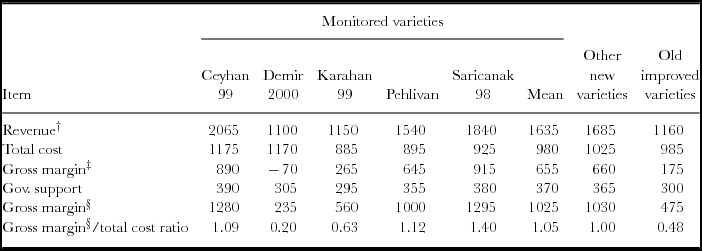
Net return is one measure of profitability commonly used by analysts, being the gross revenue minus operational costs and asset depreciation. Gross margin is a useful tool in farm management for selecting crop varieties or new technologies, measuring returns over variables costs and determining the contribution of each production activity to the profitability of the whole farm. It indicates likely returns or losses of a particular crop, but does not account for fixed costs relating to buildings, machinery or equipment depreciation. Table 9 shows the calculated gross revenues, variable production costs, government support received by producers and the resulting gross margins per hectare before and after such government support. On average, the gross margin per unit area for both the monitored varieties and other new varieties was 1030 TL ha−1 (1US$ = around 1.5 TL), and for old improved varieties was 475 TL ha−1. The same ranking is maintained when comparing gross margins before government support and the monitored varieties are associated with the highest profitability per unit area. However, results show that Demir-2000 is being produced at an economic loss of 70 TL ha−1 if government support is not considered and has the lowest gross margin even with support. Saricanak-98 and Ceyhan-99 generate the highest margins before government support, with Pehlivan and Ceyhan-99 being the most profitable varieties with government support.
Estimated revenues, costs and gross margin of wheat varieties (TL* ha−1).
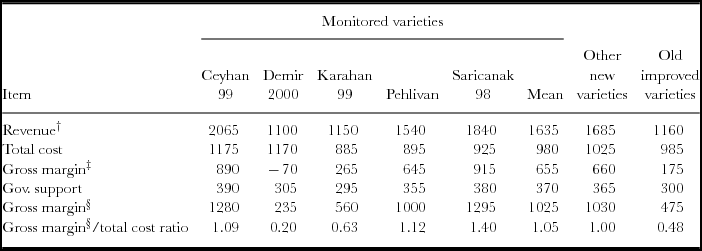
Notes: † includes revenues from grain and straw; ‡ before government supports; § after government supports.
*1US$ = around 1.5 TL.
In terms of the profitability of each variety, only Ceyhan-99 and Saricanak-98 performed better than all other varieties, whereas other new varieties generated a higher gross margin than Demir-2000, Karahan-99 and Pehlivan. Similarly, the old improved varieties on average generated higher gross margins than Demir-2000.
In rainfed wheat production systems, the monitored varieties are more profitable than other varieties, with gross margins of 1010 TL ha−1. In both rainfed and irrigated systems, the old improved varieties are the least profitable, thus creating an economic incentive and opportunity for their replacement with new wheat varieties. Gross margins for the monitored varieties are highest in Ankara, Adana and Konya compared to other varieties, with the reverse observed in Edirne and Diyarbakir. Thus, results provide evidence that Ceyhan-99, Pehlivan and Saricanak-98 outperform all other wheat varieties in terms of profitability, whereas Demir-2000 is the least profitable
Impact of new varieties on household income
The analysis indicated that the monitored varieties contribute more than all other wheat varieties to increasing household income from wheat production in Ankara, Adana and Konya provinces, and in both rainfed and irrigated systems.
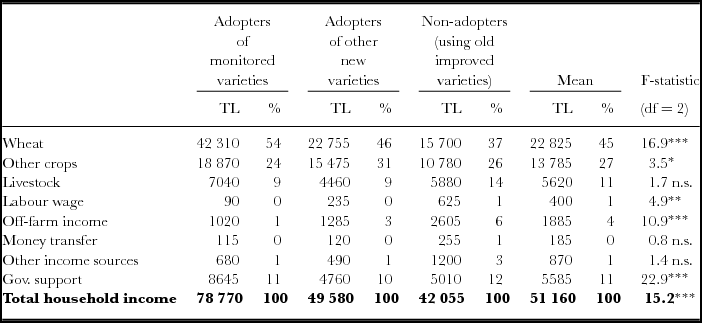
Producers’ incomes were calculated from all reported household activities including the production of wheat and other crops, livestock rearing, agricultural labour wage, revenues from share-cropping, renting farm machinery and other assets, off-farm incomes and amount of government support received. The distribution of household incomes by source and the type of varieties grown is summarized in Table 10. Across the alternative sources and three classifications of varieties, wheat leads over other crops, followed by payments received from government support and livestock production, for adopters of the monitored varieties or other new varieties. The order of importance of the latter sources is reversed for non-adopters of new varieties as they received relatively less income from government support. Estimated average income for adopters of the monitored varieties is the highest (TL 78 770 per household), statistically different with that of non-adopters at the 1% level. The contribution of wheat to their income is 54%, compared to 46% for adopters of other new varieties, and 37% for non-adopters. Wheat and other crops are relatively more important sources of income for adopters of new wheat varieties, whereas livestock and non-agricultural incomes, transfers and other incomes are relatively more important for farmers using old improved varieties.
Average household income by sources and adoption (TL/household).
Source: Survey data.
*Significance level of 5%; **significance level of 1%; ***significance level of 0.1%.
Results suggest that non-adopters of new wheat varieties are relatively more dependent on other sources of income and at the same time generate the lowest level of income across the classifications. It can be concluded that adoption of the monitored varieties significantly contributes to increased household incomes.
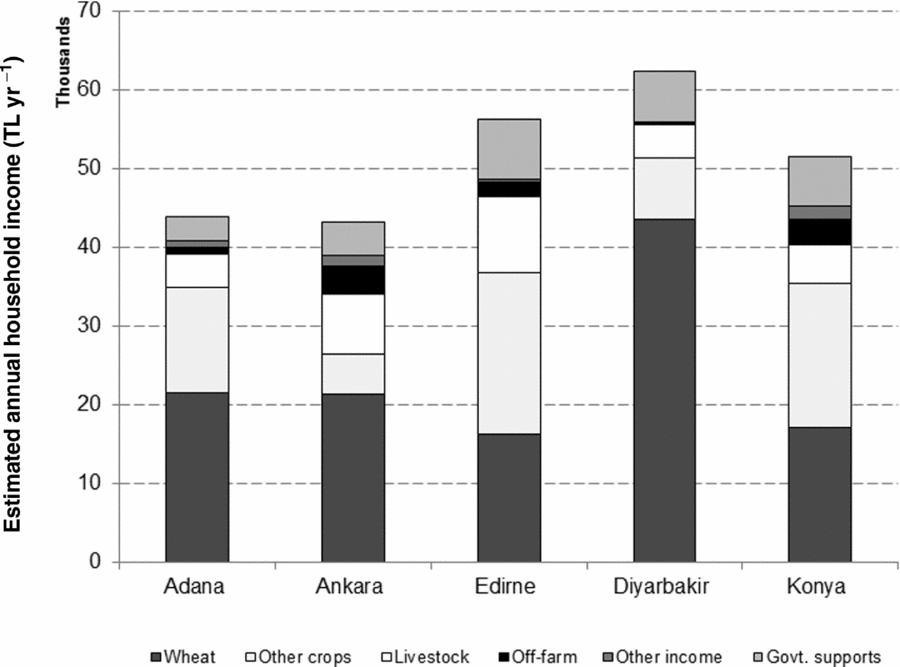
Wheat is relatively very important in Diyarbakir in terms of household income, equally important in Adana and Ankara, and less important in Konya and Edirne (Figure 2). In reverse order, other crops were more important in the respective provinces. Income from livestock activities is particularly high in Edirne and Ankara compared to other provinces. There is a statistically significant difference in incomes from wheat, other crops, livestock and from government programs across the three provinces. However, there is no statistically significant difference in total household income across the provinces, with the likelihood that there is some form of compensation effect.
Estimates of income sources by provinces.
Impact on poverty
Poverty line in the developing countries was defined by the World Bank under two scenarios (US$1.25 and US$ 2.0) per capita per day. The population living below US$2 a day in Turkey was estimated by the World Bank to be 18.1% in 2009, a reduction from 2002 levels of 27% (World Bank, 2013). Saatci and Akpinar (Reference Saatci and Akpinar2007) found that the absolute poverty line for Turkey was US$4 per capita per day, with the highest poverty rates among agricultural workers as well as in Eastern and Southeastern Anatolia. The Turkish Statistical Institute (2009) indicated that the poverty line in Turkey is $2.15 per capita per day, but that only 0.63% of the Turkish population lives below this figure. Turkey was ranked 90th out of 186 countries with moderate human development in the 2013 Human Development Report in terms of HDI ranks (UNDP, 2013), and rural poverty has declined in the Turkey over the past 10 years (IFAD, 2012).
Based on data collected for this study, 5.5% of the households in the survey area live below the Turkish poverty line (i.e. $2.15 per capita per day). This percentage is higher than the national average reported by the Turkish Statistical Institute. Farmers in the sample were relatively better-off than other farmers in Turkey for the reason that most of the poorest rural people are self-employed and unpaid family workers, living in the country's least developed areas in eastern and south-eastern Anatolia and parts of the coastal regions on the Black Sea (IFAD, 2012). The target area of this study was outside of the poorest rural areas, with most of surveyed farmers cultivating their own land and earning incomes that are relatively higher than other households in rural areas.
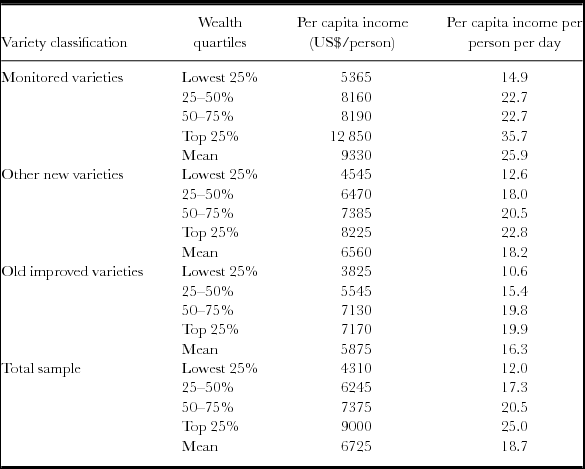
In this study, on average, per capita income per day was estimated at $18.70 for the sampled population and higher for households who adopted the monitored varieties or other new varieties. Across provinces, the highest per capita per day income was obtained in Edirne ($25.90), Konya ($19.10) and Diyarbakir ($18.50). Analysis by wealth quartiles and variety classification (Table 11) shows that relatively poor households increased their per capita income to $14.90 by adopting monitored varieties, relative to those in the same wealth quartile using other new varieties ($12.60) or older improved varieties ($10.60). Better-off farmers derived the highest per capita income per day in each variety classification or adoption group.
Household income by varieties adoption and wealth quartiles.
Source: Survey data.
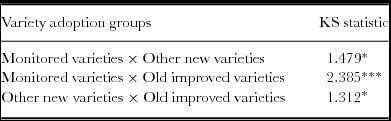
There is no significant difference in per capita income per day between adopters of the monitored varieties and other new varieties, but there is between these groups and farmers who used the old improved varieties. Similarly, the distribution of per capita income based on the Kolmogorov–Smirnov test is nearly the same for adopters of monitored varieties and other new varieties. On the contrary, there is a statistically significant difference in the distribution of per capita income between these two groups and the group of farmers using old improved varieties (Table 12).
Comparison of Kolmogorov–Smirnov statistics of per capita income distribution by variety adoption.
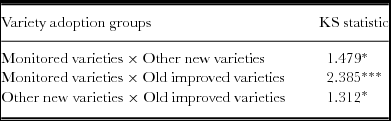
*Significance level of 5%; ***significance level of 0.1%.
While the sample farmers cannot be classified as living below the World Bank classification of a poverty line, this paper accepts the notion that poverty is multifaceted and relative. The average income of US$18.70 is well above the poverty line, but still at a level that restricts access to basic social services and long-term household security. It is posited that increased income obtained by the household due to adoption of new agricultural technologies can be directed to enhancing quality of life through better coping strategies for household food security, better access to education, primary and tertiary health care, and when agricultural innovation is designed appropriately, to improved measures of inter-household empowerment.
DISCUSSION AND CONCLUSION
This study documents and assesses the impacts of five improved varieties developed under the national and international programs in both rainfed and irrigated production systems in five provinces of Turkey, where located in different agro-ecological zones of Turkey. It specifically evaluated the technical and economic impacts of the varieties on the livelihoods of producers. The findings of this research indicated that the ability of varieties to produce high yields, and their resistance to drought, their ability to demand a good market price, adaptation to local conditions, frost resistance and good bread or durum quality are the most important characteristics indicated by farmers to choose any variety. The constraints to the adoption of the monitored varieties, based on farmers’ perceptions, are seed availability and awareness of new varieties. These perceptions may be specific to the study areas and need further investigation of the causes in order to increase their adoption rates.
Yield comparisons show that wheat productivity following the adoption of the monitored varieties was doubled under rainfed systems and increased by 11% in irrigated systems. The analysis by region indicated that monitored varieties were only superior in the plateau region under rainfed conditions, but other new varieties were superior in the lowlands and in the plateau region under irrigated conditions. However, the monitored varieties and other new varieties give higher yields, on average, compared to old improved varieties in most situations. Overall, the adoption of the monitored varieties generated a net increase of 18% in total factor productivity of wheat among producers. The increase in productivity is also accompanied by a substantial improvement in yield stability in the respective production systems and across the provinces.
Ceyhan-99, Pehlivan and Saricanak-98 outperform all wheat varieties cultivated by farmers in terms of profitability, measured by gross margin per unit of land. The monitored varieties contribute substantially to poverty reduction in the study area. The analysis by wealth quartiles and by variety classification shows that households which belong to the lowest wealth quartile (relatively poor farmers) increased their per capita income to $14.90 per day through the adoption of the monitored varieties compared to those in the same wealth quartile using other new varieties ($12.60) or old improved varieties ($10.60). The results show that both poor and high income farmers benefit from new variety adoption.
The distributions of per capita income from the monitored varieties and from the other new varieties dominate the distribution of income from old improved varieties, providing evidence of poverty reduction through variety adoption. The policy implication is that if existing government programs to increase wheat production are targeted specifically the monitored varieties, production increase could be achieved more rapidly.
Among all varieties cultivated by the sampled producers, Pehlivan ranks third in terms of adoption rate (8.2%), after Bezostaja-1 (23%) and Gerek-79 (10%). Other adoption rates are 3.5% for Ceyhan-99, 0.9% for Karahan-99, 0.5% for Saricanak-98 and 0.7% for Demir-2000. Among all 45 different varieties analysed in the survey, the variety ranking according to adoption rate is 8th for Ceyhan-99, 20th for Karahan-99, 21st for Demir-2000, and 28th for Saricanak-98. The adoption rates for individual varieties follow a similar trend. There is a need for more extension efforts to disseminate and increase the adoption rates of the monitored varieties in the respective provinces.
The study results suggest that the new wheat varieties are superior to the old varieties in terms of productivity and profitability and that adoption has the potential to substantially improve household income. While the yield potential and profitability of the new varieties over the old ones were clearly demonstrated through the survey results, their adoption was low. The five new varieties were grown on an aggregate 15% of the total wheat-growing area, and 49% of the area is still cultivated with old varieties. The main reasons for the low adoption rate are farmers’ perception for certain characteristics of the variety and the weak seed production systems. Increasing both adoption rate and adoption degree of the new varieties is needed. This will include improvements in the seed production system and in the information dissemination process, led by the national extension agency in Turkey in close cooperation with research institutes.
Addressing the needs for reviewing and recognition of Wheat Impact Pathway in Turkey is an essential part of any successful diffusion strategy to achieve impact. Impact pathway is described how the research interventions and who outside the project needs to use them to achieve developmental outcomes and impact. Part of the process of developing impact pathways involves mapping how knowledge and research products must scale out and scale up to achieve the development goals. Scaling up involves building a favourable institutional environment for the emerging change process through such mechanisms as positive word of mouth, organized publicity, political lobbying and policy change.
However, results of this study were deemed to be important in establishing research efforts to generate the expected positive impacts at the household level, and will therefore demonstrate to different stakeholders the positive impacts of the national and international breeding programs associated with improved soil and crop management and quality seed production on rural livelihoods.