I. INTRODUCTION
Thermoelectricity is the simplest technology applicable for direct thermal-to-electrical energy conversion in power generation and refrigeration.Reference Bell1–Reference Tritt3 The conversion efficiency is largely determined by the figure of merit ZT = α 2σT/κ of the materials of which the thermoelectric (TE) device is composed, where α is the Seebeck coefficient, σ the electrical conductivity, T the temperature in kelvin, and κ the thermal conductivity. The study of TE materials is thus an application-driven materials research. Although there is no known upper limit of ZT, most state-of-the-art TE materials such as filled skutterudites,Reference Shi, Chen, Bai, Huang, Zhao and Yao4 GeTe–AgSbTe2 and PbTe–AgSbTe2 alloys,Reference Yang, Zhu, Sun, He, Zhang and Zhao5, Reference Poudeu, Gueguen, Wu, Hogan and Kanatzidis6 and Tl-doped PbTeReference Heremans, Jovovic, Toberer, Saramat, Kurosaki, Charoephakdee, Yamanaka and Synder7 exhibit ZT values between 1 and 2 because α, σ, and κ are intercorrelated properties and the ability to change one property usually results in a change in another property, often in contrast to a desired change. In the past decade, while pursuing higher ZT materials remains the main theme in the investigation of TE materials, there is ever increasing attention being paid to the environmental impacts or “friendliness” of TE materials. An ideal TE material should not only have a high ZT but also be made of nontoxic, abundantly available, and low-cost elements, resulting in a stable reproducible material over the temperature range of interest.
Mg2Si1−xSnx-based compounds are a promising class of environmentally friendly TE materials as their constituent elements are light, abundant in the earth’s crust, and are nontoxic. There are three basic approaches to achieve high ZT values in Mg2Si1−xSnx-based compounds: (i) making a solid solution, (ii) doping on the Si/Sn site, and (iii) development of a nanostructuring process. Although these approaches can be independently implemented or combined, they are all influenced by the details of the phase diagram of Mg–Si–Sn.
Nikitin et al.Reference Nikitin, Bazanov and Tarasov8 first reported the pseudobinary phase diagram of Mg2Si and Mg2Sn, which featured a miscibility gap between x = 0.4 and 0.6 and a peritectic reaction. As Mg2Si and Mg2Sn are isostructural, a favorable low lattice thermal conductivity is expected in the solid solution due to the mass fluctuation between Sn and Si. In this same vein, Zaitsev et al.Reference Zaitsev, Fedorov, Gurieva, Eremin, Konstantinov, Samunin and Vedernikov9 reported a ZT value of 1.0–1.1 at 860 K in Sb-doped Mg2Si1−xSnx solid solutions with the Sb doping on the Si/Sn site. Interestingly, the best TE performance was found in compositions that were close to the edges of the miscibility gap, i.e., x = 0.4 and 0.6. Utilizing the “ex-solution” in the miscibility gap and Sb-doping on the Si/Sn site, Zhang et al.Reference Zhang, He, Zhu, Zhang, Zhao and Tritt10 reported a ZT value of 1.1 at 773 K in Mg2Si1−xSnx-based nanocomposites. There are several other reports on the doping approaches: the materials exhibited p-type conduction upon Li and Ag doping, whereas doping with Al, Sb, and Bi led to n-type conduction.Reference Isoda, Tada, Nagai, Fujiu and Shinohara11–Reference Sakmoto, Iida, Matsumoto, Honda, Nemoto, Sato, Nakajima and Taguchi13
Despite the advances mentioned above, sample preparation remains challenging in the study of the TE properties of these Mg2Si1−xSnx compounds. The inherent difficulty arises from the large difference in the melting point and specific gravity of constituent elements, as well as the high saturated vapor pressure, chemical activity, and easy oxidation of Mg, which led to a poor reproducibility in samples prepared by various methods such as direct melting, mechanical alloying, solid state reactions, and spark plasma sintering.Reference Song, Aizawa and Sun14 From the fundamental research and industrial production points of view, the poor reproducibility of the sample preparation profoundly affects the data analysis and the further optimization of these compounds. Therefore, we have recently developed a simple B2O3 flux method and successfully used it to prepare Sb-doped Mg2Si1−xSnx solid solutions. High ZT values of >0.9 have been reproducibly attained at x = 0.5.Reference Gao, Zhu, Liu, Chen and Zhao15 More importantly, despite the fact that the composition was in the miscibility gap, the as-obtained Mg2Si0.5−ySn0.5Sby samples were found to be single phase and were well reproducible in both composition and microstructure. Thus, the single phase of Mg2Si0.5−ySn0.5Sby system warrants a systematic study of the phase diagram of Mg2Si1−xSnx (without Sb doping), which is the main motivation of this work.
Although it is widely accepted that the miscibility gap exists between x = 0.4 and 0.6,Reference Nikitin, Tkalenko, Zaisev, Zaslavski and Kuznetsov16 we note that Isoda et al.,Reference Isoda, Nagai, Fujiu, Imai and Shinohara17 Riffel and Schilz,Reference Riffel and Schilz18 Mantyanu et al.,Reference Mantyanu, Sokolov and Makarov19 and Jung et al.Reference Jung, Kang, Park, Kim and Ahn20 reported very different values on the miscibility gap, and these values were scattered over a wide range between 8 and 72%. We believe that the discrepancy in the reported details of the phase diagram (and as well the poor reproducibility of the sample preparation) can be, at least, partially attributed to the sublimation and oxidation of Mg. Since the B2O3 flux synthesis has been proven to be effective in inhibiting sublimation and oxidation of Mg in our previous study,Reference Gao, Zhu, Liu, Chen and Zhao15 this led us to revisit the miscibility gap of Mg2Si1−xSnx in this study by extending the composition range to 0.1 ≤ x ≤ 0.8 using the B2O3 flux method.
II. EXPERIMENTAL
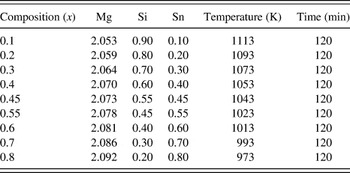
The stoichiometric amounts of elemental Si (99.9% purity), Sn (99.5% purity), and Mg (99.5% purity) powders were weighed, and a small amount of excess Mg (with respect to stoichiometric Mg) was added to compensate for the possible loss of Mg during the hot pressing process. The raw materials of 4 g were ground in an agate mortar in a glove box, then loaded to a cylindrical alumina crucible of Ø10 × 50 mm2 covered by about 3 g of B2O3 flux. The starting materials were heated at 973 K for 10 h in a chamber furnace. The as-obtained porous Mg2Si1−xSnx bulk materials were crushed, ground, and loaded into a graphite die for hot pressing at 973–1113 K for 2 h under a pressure of 80 MPa. The hot pressing temperature was varied to optimize the densities of different samples. The measured relative densities of all samples were ∼99% of the calculated theoretical densities. The design compositions and hot pressing parameters for all samples are shown in Table I.
Stoichiometric ratio and hot pressing parameter for Mg2Si1−xSnx samples.

The phase structure of all samples were characterized by powder x-ray diffraction (XRD) on a Rigaku D/MAX-2550 PC diffractometer (Rigaku, Tokyo, Japan) with Cu Kα radiation (λ = 1.5406 Å). The sample microstructure was observed on a Hitachi S-4800 field emission scanning electron microscope (Hitachi, Tokyo, Japan). The thermal conductivity κ was calculated from the measured sample properties using the relationship, κ = ρDC p, where ρ is the sample density, D is the thermal diffusivity, and C p is the specific heat. The thermal diffusivity and the specific heat were measured on a laser flash apparatus (Netzsch LFA 457, Netzsch, Selb, Germany). The electrical conductivity σ and the Seebeck coefficient α were simultaneously measured on a computer-assisted apparatus.Reference Zhang, He, Zhao, Zhang, Zhu, Yi and Tritt21 A diamond saw was used to cut the samples to the proper size and shape for the aforementioned measurements.
III. RESULTS AND DISCUSSION
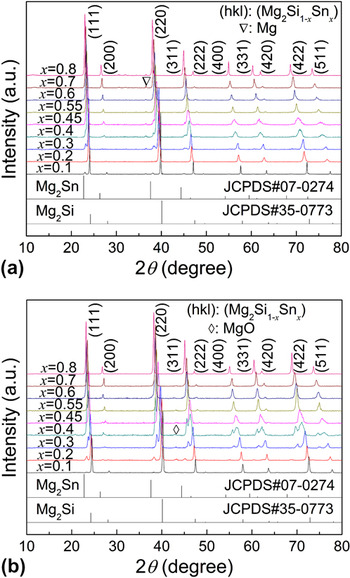
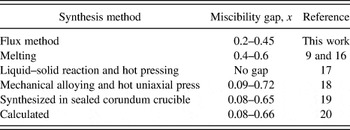
The XRD patterns for the Mg2Si1−xSnx (0.1 ≤ x ≤ 0.8) solid solutions before and after hot pressing are plotted in Fig. 1. As shown in Fig. 1(a) for the flux synthesized samples, except for a trace amount of Mg, all the peaks located between the characteristic peaks of pure Mg2Si (JCPDS No. 35-0773) and Mg2Sn (JCPDS No. 07-0274). They can be indexed to the face-centered cubic antifluorite structure with the space group Fm3m. However, there is a significant broadening and/or shoulders of the diffraction peaks for all samples other than x = 0.1 and x = 0.8, suggesting that the samples may be not homogeneous, i.e., a range of compositions were present. And for 0.3 ≤ x ≤ 0.45, the phase separation can be clearly observed. Figure 1(b) presents the XRD patterns taken after hot pressing. There are several interesting findings. First, MgO was formed in the hot pressing process from the unreacted Mg. Second, those samples with 0.2 ≤ x ≤ 0.45 had the peak splitting, whereas the other samples were largely unaltered before and after hot pressing. The peak splitting is a sign of phase separation (namely, Mg2Si-rich phase and Mg2Sn-rich phase) that usually occurs in a miscibility gap. Third, the peak splitting occurred only after hot pressing and only in the samples with 0.2 ≤ x ≤ 0.45. One possible scenario is that the phases between x = 0.2 and 0.45 formed during the flux synthesis are thermally metastable. In summary, these observations suggested that the miscibility gap is between x = 0.2 and 0.45 in the flux synthesized samples. Table II lists reported different values on the miscibility gap and the corresponding synthesis methods for comparison. It is clear that the reported miscibility gap is dependent on the synthesis methods, possibly due to the difference in the resultant Mg content.
X-ray powder diffraction patterns (a) before hot pressing and (b) after hot pressing for the flux synthesized Mg2Si1−xSnx (0.1 ≤ x ≤ 0.8) samples.

Reported different miscibility gaps for Mg2Si1−xSnx.

We intend to stress that the phase separation seemed to be intimately related to Mg loss or Mg vacancies, for example, Mg vacancies up to 10% are allowed in Sb-doped Mg2Si.Reference Nolas, Wang and Beekman22 Moreover, the results of our supplemental experiments showed that the Mg loss is inherent in the preparation of Mg2Si1−xSnx compounds even without Sb doping. In this vein, the excess Mg in the flux synthesis is necessary to restrict Mg vacancies. In particular, for x = 0.55 sample, a minor Mg2Si-rich phase was occasionally observed after hot pressing, but increasing Mg excess >3 wt% yielded single-phase samples (not shown here). In our previous study, we also found that excess Mg helped form single-phase Mg2Si0.5Sn0.5,Reference Gao, Zhu, Liu, Chen and Zhao15 consistent with the reported results by Isoda et al.Reference Isoda, Tada, Nagai, Fujiu and Shinohara11, Reference Isoda, Nagai, Fujiu, Imai and Shinohara12, Reference Isoda, Nagai, Fujiu, Imai and Shinohara17 A further systematic investigation on the effects of Mg vacancy on the phase structure is in progress and will be reported elsewhere.
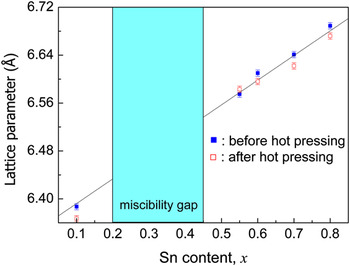
The XRD peaks of the single-phased samples, before and after hot pressing, systematically shifted with increasing x value, as shown in Fig. 1. The shift can be understood as being due to the larger ionic radius of Sn than Si and the solubility of Sn in the lattice. We plotted the lattice constant of the Mg2Si1−xSnx samples as a function of Sn content x in Fig. 2. In the range of 0.2 ≤ x ≤ 0.45, phase separation occurred, the samples contained an Mg2Si-rich phase and an Mg2Sn-rich phase, and these data points were excluded from Fig. 2. A good linear behavior is observed, thus following Vegard’s law and also agrees well with the results reported in Ref. Reference Luo, Yang, Chen, Shen, Jiang and Zhang23. The observed linear behavior is expected for a solid solution and also corroborates the effective control of the composition in the flux growth.
Dependence of the lattice parameter on the Sn content, before and after hot pressing, for the flux synthesized Mg2Si1−xSnx (0.1 ≤ x ≤ 0.8) samples. The data points for 0.2 ≤ x ≤ 0.45 are excluded because of phase separation.

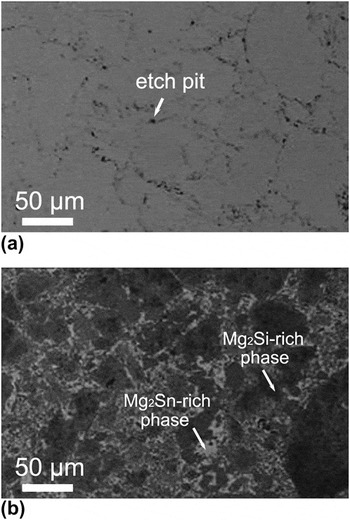
To probe the microstructures, we preformed scanning electron microscopic (SEM) studies on several randomly selected samples. Figures 3(a) and 3(b) show the backscattering electron images of the samples x = 0.8 and 0.3, respectively. Figure 3(a) shows a basically homogeneous single-phase sample, except for some pits at the grain boundaries derived from the etching process, whereas Fig. 3(b) clearly shows the coexistence of two phases for x = 0.3. In our previous study, we have shown that the sample x = 0.5 had a single phase.Reference Gao, Zhu, Liu, Chen and Zhao15 These observations are consistent with the results of our XRD measurements and differential scanning calorimetry studies (not shown). Thus, we believe that the miscibility gap is between x = 0.2 and x = 0.45 for the B2O3 flux synthesized samples.
Backscattering electron images for (a) x = 0.8 and (b) x = 0.3 Mg2Si1−xSnx samples.

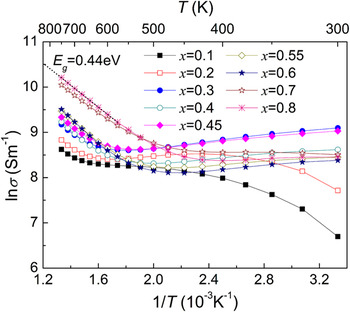
Figure 4 shows the temperature dependence of electrical conductivity, σ, for all Mg2Si1−xSnx samples. The electrical conductivity of all the samples exhibited fairly strong temperature dependence. The x = 0.1 and 0.2 samples showed semiconducting behavior, and σ increased exponentially in the high-temperature region likely due to the intrinsic excitation. The temperature of intrinsic excitation decreased with increasing Sn content x. Energy gap, E g, can be estimated by deriving the slope from the plot of lnσ versus 1/T. The value of the slope after the intrinsic excitation is −E g/(2k B), where k B is the Boltzmann constant. The calculated energy gap values for x = 0.6, 0.7, and 0.8 samples are 0.51, 0.42, and 0.44 eV, respectively. The energy gap for Mg2Si1−xSnx solid solutions reduced with increasing x value. As a reference, the energy gaps of Mg2Si and Mg2Sn were reported to be 0.77 and 0.35 eV, respectively.Reference Zaitsev, Fedorov, Gurieva, Eremin, Konstantinov, Samunin and Vedernikov24 All other samples (0.3 ≤ x ≤ 0.8) showed a crossover from a “metallic-like” (or degenerate semiconductor) behavior on the lower temperature side to a semiconducting behavior on high-temperature side, and the observed characteristic temperature of the crossover behavior systematically decreased with increasing x.
lnσ versus 1/T relationship for Mg2Si1−xSnx (0.1 ≤ x ≤ 0.8) samples.

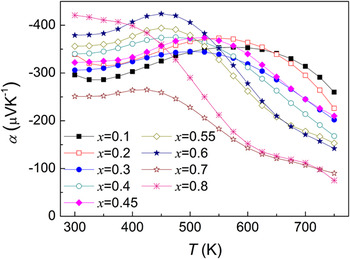
The temperature dependence of Seebeck coefficient α for Mg2Si1−xSnx samples is shown in Fig. 5. The values of the Seebeck coefficients are all negative over the measured temperature range, indicating n-type conduction, which possibly originates from the formation of positively charged Mg ions at interstitial sites.Reference Kato, Yagi and Fukusako25 All the Seebeck coefficient curves exhibit a maximum before varying strongly with temperature because of the bipolar effect of mixed n-type and p-type conduction. The maxima of the Seebeck coefficient shifted to lower temperatures with increasing x, consistent with a reducing band gap.
Temperature dependence of Seebeck coefficient α for Mg2Si1−xSnx (0.1 ≤ x ≤ 0.8) samples.

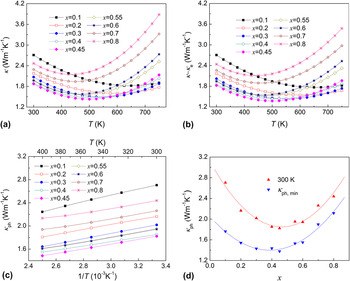
Figure 6(a) presents the thermal conductivity κ as a function of temperature for all the samples. It is noteworthy that all the samples showed a minimum, which nearly coincides with the onset of intrinsic conduction in Fig. 4. In the simplest case, κ is the sum of the contributions from the lattice component, κ ph, and the electronic component κ e. We adopted the Wiedemann–Franz relationship (κ e = L 0σT, where L 0 is the Lorenz number) to estimate κ e, using a Lorenz number of 2.0 × 10⁻⁸ V2·K−2, representative of a degenerate semiconductor. The κ ph was derived by subtracting κ e from κ, and the results are presented in Fig. 6(b). As expected, κ ph followed a 1/T behavior [Fig. 6(c)] at low temperatures representative of phonon–phonon scattering or the “Umklapp process.”Reference Labotz, Mason and Okane26 The thermal conductivity exhibits a minimum and then increases with increasing temperature after the intrinsic excitation due to the bipolar conduction [Fig. 6(b)].
Temperature dependences of (a) κ and (b) κ–κ e. (c) κ ph ∼1/T relationships at low temperatures and (d) composition dependences of κ ph at 300 K and κ ph, min for Mg2Si1−xSnx (0.1 ≤ x ≤ 0.8) samples.

Figure 6(d) shows the composition dependences of the lattice thermal conductivity at 300 K and the minimum of lattice thermal conductivity (κ ph, min) for all the samples. The lattice thermal conductivity at 300 K and the κ ph, min showed almost the same trend: it decreased with increasing x value and reached a minimum, then increased with a further increase in x value. These observations are consistent with the expected thermal conductivity behavior of a solid solution. Even though some samples are multiple phased and phonons are scattered on grain boundaries, it is apparent that the point defects and mass fluctuation are the dominant factors of phonon scattering. Note that the lowest κ ph ∼1.4 W·m−1·K−1 was obtained for x = 0.45.
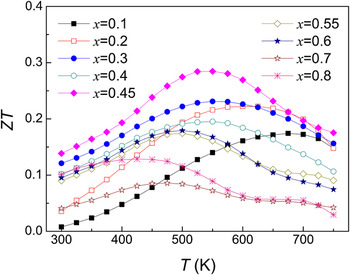
Finally, the temperature dependence of ZT for all the samples is shown in Fig. 7. The position of the ZT peak systematically shifted to lower temperatures with increasing x value that is roughly correlated with the shift of the Seebeck peak. This indicates that varying the x value effectively changes the band structure of Mg2Si1−xSnx solid solutions. In particular, the ZT max = 0.3 is obtained for x = 0.45 at about 525 K mainly due to a low lattice thermal conductivity. The ZT value itself is not impressive, but it is open for further optimization via doping and/or possible nanostructuring. In this vein, Mg2Si0.55Sn0.45 is one of the more promising parent compounds among the Mg2Si1−xSnx solid solutions.
Temperature dependence of the figure of merit ZT for Mg2Si1−xSnx (0.1 ≤ x ≤ 0.8) samples.

IV. CONCLUSIONS
“Environmentally friendly” Mg2Si1−xSnx (0.1 ≤ x ≤ 0.8) TE materials have been successfully prepared by the cost-effective B2O3 flux method followed by a subsequent hot pressing process. The composition dependences of the phase structure and TE properties were systematically investigated. The XRD and SEM results showed that Mg2Si1−xSnx solid solutions have been successfully formed, except between x = 0.2 and 0.45. The miscibility gap found in the flux synthesized samples is significantly smaller than those that other literature reported. A ZT = 0.3 was attained for x = 0.45 at ∼525 K, providing a promising parent compound for further optimization via doping and/or a nanostructuring approach.
ACKNOWLEDGMENTS
The work is financially supported by the National Natural Science Foundation of China (50971115 and 51061120455), the Natural Science Foundation of Zhejiang Province (Z4090204), the Science and Technology Program of Zhejiang Province (2009C34007), the Fundamental Research Funds for the Central Universities, and the National Science Foundation of the United States (1008073).