

Published online by Cambridge University Press: 01 October 2004
This symposium presents seven presidential election forecasting models and their predictions of the popular two-party vote in the 2004 election. The modern age of election forecasting is now into its third decade. Models have been tested quite publicly in the heat of battle—with some doing well, others not quite so well, and still others making way for new models. In this introduction, I provide a brief overview of the models, a summary of this year's forecasts, and some thoughts about how the forecasts should be judged.
This symposium presents seven presidential election forecasting models and their predictions of the popular two-party vote in the 2004 election. The modern age of election forecasting is now into its third decade.1
Among the earliest of modern forecasting studies of the presidential vote were Fair 1978; Sigelman 1979; Brody and Sigelman 1983; Lewis-Beck and Rice 1983; and Rosenstone 1983.
Many of the models in this symposium offered forecasts for the 1996 election in a special issue of American Politics Quarterly. Post-mortems were published in Campbell and Garand 2000. Post-mortems of the 2000 forecasts were published in both American Politics Quarterly and in PS: Political Science and Politics. Several of the models have been amended, though the basic thrusts of most of the models are unchanged. I adjusted the second quarter GDP growth for non-incumbent candidates of the in-party. Lockerbie simplified his number of terms variable and dropped the pre-election year income growth variable. Norpoth revised his primary performance variables and added a partisan baseline variable. Abramowitz changed his late June presidential approval measure. Wlezien and Erikson present a bracketed forecast using alternatively the approval ratings and now also the preference polls in their model. Holbrook used the mean presidential approval over the summer rather than spring months and weighted the Survey of Consumers retrospective personal finances measure by an index of economic news. Lewis-Beck and Tien dropped their “peace and prosperity” index and added a job growth variable, an incumbent party advantage variable, and an interaction of incumbency and GNP growth. All of the models walk the tight rope of trying to learn from past errors and data examination without overfitting the equation by excessive tinkering.
As will be evident in reviewing the articles that follow, the models are a diverse lot. Even so, they share some common features. First, with the exception of Norpoth's and Lockerbie's, all use some measure of public opinion in generating their prediction. Among these, other than my model, all use a measure of the public's approval of the president's job performance. Second, most use some measure of the state of the economy leading into the campaign—Norpoth's model again being the exception. Among the others, some use objective measures (Abramowitz', Wlezien and Erikson's, and my model) others use subjective measures (Holbrook's and Lockerbie's), and one uses both (Lewis-Beck and Tien's). Finally, in one way or another (often implicitly through the constant term), the models take into account the advantage of presidential incumbency. Apart from these common general features, the models differ substantially in their complexity, in their track records of errors, in when they offer a forecast, and in the span of elections they use to estimate the forecast equation. Of paramount interest now, of course, is whether the models differ in their forecast for this year and what the forecasts are for the Bush v. Kerry contest.
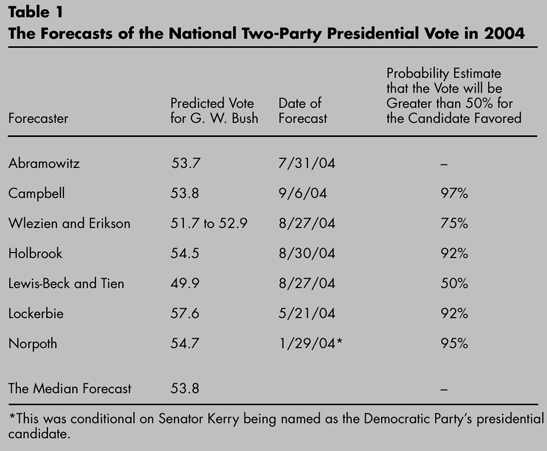
Table 1 presents a summary of this year's forecasts for the seven models in this symposium.3
Several other forecasts have also been made. Ray Fair's model as of April 29 predicted that Bush would receive 58.7% of the two-party vote. Cuzan and Bundrick's model at the same time predicted that Bush would receive 53% of the two-party vote.

After the election, some of us will look back at these forecasts to gauge their accuracy. In anticipation of these evaluations and to help set reasonable expectations, I want to offer a few ideas about assessing the accuracy of the election forecasts.
First, the forecasts cannot be fairly judged by whether they predicted the candidate who won the election. The forecasting models are not constructed to predict the winning candidate, or even the candidate receiving the plurality of the national popular vote—though that is the question of obvious interest for which the forecasts may be used.4
The fact that the popular vote winner in 2000 did not win the majority of electoral votes may raise questions about the utility of forecasting the popular vote. However, the two-party popular vote and electoral vote percentages remain very highly correlated and divergent outcomes can only happen when the popular and electoral votes are decided by razor-thin margins. In elections from 1948 to 2000, the correlation between two-party popular and electoral votes is .97.
Second, and following from the first point, the forecasts should not be judged as simply right or wrong. The accuracy or inaccuracy of a forecast is a matter of degree. A forecast in a given election is within X points of the actual vote or off by Y points. While there is an impulse to declare outright winners and losers, forecasts are not reasonably judged so simply.
Third, since no model claims perfection, each forecast expects to be wrong to some degree. Each freely admits that there are unanticipated (even unanticipatable) developments in a campaign that cause votes to shift here or there. One reason for forecast imperfection is the imperfection in the data that goes into making the forecast. Whether models use preference polls, presidential approval ratings, or consumer confidence ratings, poll numbers are imperfect estimates of the electorate's thinking. Moreover, polling practices and the conditions under which the polls are conducted have changed over the years, making comparability over time less than perfect. Many of the models also use economic data (though this is rarely the dominant element of the forecast) and, as the continual revision of economic series attests, economic data is far from perfect.5
In both my model and my estimate of Abramowitz's model, the economy indicators have smaller standardized coefficients that the other predictors. Both of these models, by the way, are stronger when estimated using the recently revised GDP figures. By my estimates, with the latest revised GDP figures, the adjusted R-square increases by 5 percentage points in the Abramowitz model and by 2 percentage points in my model.
Fourth, some forecasts may be more accurate than others. It is disconcerting how frequently the forecasts are lumped together in one evaluation. The models are a diverse lot and, as in past years, the forecasts from different models will differ—so should their assessments. In the 2000 election, the forecasts ranged over a span of 9.5 percentage points (7.5% if you exclude economist Ray Fair's forecast). Despite this wide range, more often than not, it was one evaluation fits all. Each forecast ought to be evaluated on its own merits. As in every other field of research, some models may “go out of business” while others thrive.
Fifth, to note that some forecasting errors should be expected and that the errors are a matter of degree rather than of simply right or wrong is not to let the forecasts off the hook. Several benchmarks can be used to gauge the accuracy of the predictions. The most generous of these are the naive guesses. If you knew absolutely nothing about the recent history of presidential elections, you would guess that the inparty candidate would receive 50% of the two-party vote. The average error of this guess from 1948 to 2000 would be 4.8 percentage points. A slightly less naive guess does no better. Since 1948, we know that the in-party candidate has received, on average, 52.5% of the vote. The average error of using this as our forecast would also be 4.8 percentage points. In some elections, these guesses have been much farther off the mark. Both naive guesses have been wrong by more than 7 percentage points in four of the last 14 elections.
At a minimum we should expect forecasts to be more accurate than naive guesses, but we should expect more than the minimum. Higher (but still reasonable) standards are offered by the preference polls at the time of the forecast. Forecasts produced by a model should be generally more accurate than what you could obtain from picking up the newspaper and reading the latest preference poll from when the forecast was made. For the very early forecasts, however, this standard is of no value. The preference polls before the conventions have typically been less accurate than the naive guesses. The poll standard is of greater value for forecasts issued after the conventions. Preference polls (Gallup polls since 1948) conducted after the conventions have averaged a 4.4 percentage point error and preference polls around Labor Day have averaged a 3.9 point error.6
While the average is respectable, the post-convention Gallup poll read as a forecast has been off by more than 7 percentage points in five of the 14 elections since 1948 (1948, 1964, 1968, 1976, and 1996). Similarly, the vote has differed from Gallup's preference poll around Labor Day by more than 7 percentage points in three of the 14 elections (1964, 1968, and 1976).
Preference polls conducted just before Election Day or even after the election offer the most demanding standard for comparison. In elections since 1948, the final pre-election Gallup poll has an error of 2.1 percentage points of the two-party vote. The post-election NES survey is actually a bit less accurate. The mean absolute error of the NES study (since 1952), conducted after the election, is 2.4 percentage points. Based on their reported out-of-sample errors, several of the models producing forecasts several months before Election Day offer a comparable degree of accuracy to the polls conducted within hours of the election or the NES post-election surveys conducted in the weeks after the election.7
Out-of sample testing is a good faith effort to assess a model fairly. However, even out-of-sample tests are conducted on models that are constructed with the benefit of after-the-fact information and may have smaller out-ofsample errors than the distribution to true forecast errors. In the end, there is no substitute to testing a stable model with real-time forecasts. Model stability (the constancy of model specification from one election to the next) must be a goal of election forecasting along with prediction accuracy and lead time before the election.
With all of these standards, however, we are dealing with averages and not performance in any particular election. Still, these benchmarks provide some bearings. Barring another disputed election imbroglio, we will know by November 3rd how the forecasts for this year measured up.
Alan I. Abramowitz is Alben W. Barkley Professor of Political Science at Emory University. He is author of Senate Elections (University of Michigan Press, 1992) and is currently researching party realignment in the U.S. and its consequences for presidential and congressional elections.
James E. Campbell is professor of political science at the University at Buffalo, SUNY. He is the author of numerous articles and several books including The American Campaign: U.S. Presidential Campaigns and the National Vote (Texas A&M University Press, 2000). He co-edited Before the Vote: Forecasting American National Elections (Sage, 2000). The morning after the 2000 election he appeared on AM Buffalo to discuss the election with film legend Mickey Rooney.
Robert S. Erikson is professor of political science at Columbia University. His research on American elections has been published in a wide range of scholarly journals. He is coauthor of The Macro-Polity (Cambridge University Press), Statehouse Democracy (Cambridge), and American Public Opinion (Allyn and Bacon). He is the former editor of the American Journal of Political Science and the current editor of Political Analysis.
Thomas M. Holbrook is professor of political science and director of graduate studies at the University of Wisconsin, Milwaukee. He is author of Do Campaigns Matter? (Sage, 2003).
Michael S. Lewis-Beck is F. Wendell Miller Distinguished Professor and Chair of Political Science at the University of Iowa. He has authored or co-authored over 110 articles or books, including Forecasting Elections. Lewis-Beck has forecast U.S., French, British, Hungarian, and German elections.
Brad Lockerbie is associate professor of political science at the University of Georgia. His research focuses on the role economics plays in political behavior.
Helmut Norpoth is professor of political science at Stony Brook University. He has authored or coauthored numerous articles on voting and public opinion, and co-edited Economics and Politics: The Calculus of Support. On many occasions, he has assisted the New York Times with its Election-Day analysis.
Charles Tien is associate professor at Hunter College and deputy executive officer of political science at the Graduate Center, CUNY. His research has been published in American Politics Research, Public Choice, Public Opinion Quarterly, and other journals.
Christopher Wlezien is reader in comparative government and fellow of Nuffield College, Oxford University. His research and teaching interests encompass a range of fields in American and comparative politics, and his articles have appeared in various journals and books. He recently co-edited (with Mark N. Franklin) The Future of Election Studies (Pergamon) and currently is completing a book with Robert S. Erikson on The Timeline of Election Campaigns.

The Forecasts of the National Two-Party Presidential Vote in 2004