Implications
Food traceability refers to record-keeping systems able to identify the path and the history of an animal, animal product or food ingredient through the food supply chain. The recent crisis that affected the agri-food industry increased the consumers’ concern about the quality and safety of the food they buy. In addition, the industrialization of food production and the globalization of food marketing make direct consumer control impossible. In this context, DNA-based traceability systems and breed authentication methods complement existing food safety and quality assurance by enhancing trace-back and recall abilities.
Introduction
Recent challenges to the European Union (EU) agricultural sector call for new management approaches that reconcile animal food production with the conservation and sustainable use of biodiversity, promotes the delivery of ecosystem services and benefits the agricultural sector and society as a whole. The European Parliament, in a resolution of 19 June 2008 (resolution 2009/c 286 E/10), acknowledged the urgent need for action to ensure a profitable and sustainable future for sheep and goat production and recognized the key role played by traditional farming enterprises in the maintenance of marginal rural areas and preservation of landscape and biodiversity in Europe. This resolution calls on member states to sponsor campaigns to increase consumer knowledge about traditional products, improve the traceability of animals and products, sustain Protected Geographical Indication and Protected Designation of Origin brands and to introduce a mandatory EU labelling regulation system. The EU resolution also strongly calls for the introduction of technological innovation in the sheep and goat sector.
In this context, DNA-based traceability and breed authentication methods might represent valid marketing strategies and operative tools to support and protect high-quality products from local breeds usually linked to traditional farming and production methods (Schwagele, Reference Schwagele2005; Smith et al., Reference Smith, Tatum, Belk, Scanga, Grandin and Sofos2005).
Several breed assignment methods have been tested, mainly in cattle and pigs, using the classic multiallelic simple sequence repeat molecular markers (Maudet et al., Reference Maudet, Luikart and Taberlet2002) or, more recently, small and high SNP panels (Ballester et al., Reference Ballester, Mercadé, Van Haandel, Santamartina and Sánchez2007; Negrini et al., Reference Negrini, Nicoloso, Crepaldi, Milanesi, Marino, Perini, Pariset, Dunner, Leveziel, Williams and Ajmone Marsan2008 and Reference Negrini, Nicoloso, Crepaldi, Milanesi, Colli, Chegdani, Pariset, Dunner, Leveziel, Williams and Ajmone-Marsan2009; Bovine HapMap Consortium, 2009).
Unfortunately, to date, the complete genome sequence of goat has not yet been published and the molecular information available for this species mainly concerns a few candidate genes and a number of microsatellites (Cañón et al., Reference Cañón, García, García-Atance, Obexer-Ruff, Lenstra, Ajmone-Marsan and Dunner2006; Lan et al., Reference Lan, Pan, Zhang, Zhao, Zhang, Lei and Chen2009).
However, to fill this gap, a comparative approach that relies on genome information from a closely related species, to investigate orthologous genes of the target species, can be informative and, if applied to genes under divergent selection among breeds, may reveal SNPs of particular value for traceability purposes.
Since breeds have been selected by humans for fixed coat colour and patterns, coat colour genes are good candidates for breed identification (Maudet and Taberlet, Reference Maudet and Taberlet2002).
The objectives of this paper were to identify and validate SNPs in goat coat colour genes and their evaluation for the traceability of populations of the Italian Alps and their products. Linking of biodiversity and agricultural production to develop operative tools might benefit traditional breeds farming and help to preserve biodiversity and landscape.
Material and methods
Animal sampling and DNA extraction
Whole blood from 159 minimally related animals (namely not directly related) belonging to five goat breeds from Italy (Bionda dell'Adamello (BIO), no. = 32; Alpine (ALP), no. = 26; Orobica (ORO), no. = 32; Saanen (SAA), no. = 36; Verzaschese (VER), no. = 33) was collected in a Vacutainer tube (Becton, Dickinson and Company, Franklin lakes, NJ, USA) with sodium citrate 3% as an anticoagulant and stored frozen. To ensure the representativeness of sampling, no more than three animals per flock from about 10 farms spanning the traditional rearing area were collected. For each breed only two or three samples were male.
Genomic DNA from all the samples was extracted from frozen whole blood using a commercial kit (NucleoSpin Blood; MACHEREY-NAGEL GmbH & Co. KG) following the manufacturer's instructions.
Breeds were selected for their genetic originality, coat colour variability and the economic relevance of their production. We focused on restricted Alpine geographic areas in which goat husbandry provides a significant source of income, targeting three native goat breeds (BIO, ORO and VER) and two market competitors represented by Swiss cosmopolite goat breeds (SAA and ALP). The population size of the three native breeds recorded by The National Breeder Association (www.assonapa.it) is about 4000 for BIO, 2000 for VER and 1000 for ORO. All these breeds have been officially standardized in the early 1990s with the institution of a herd book. Breed standards establish a monomorphic coat colour for BIO, VER, ALP and SAA, whereas several coat pigmentation patterns are admitted in ORO.
Primer design
Primer pairs were designed on the bovine sequence (assembly 4.0) to amplify portions of 36 homologous genes implicated in the determination of coat colour (Table S-1). These portions were chosen based on the information provided in mouse (http://www.informatics.jax.org/ and http://www.espcr.org/micemut).
SNPs discovery
A total of eight animals from four goat breeds (two animals per breed) characterized by distinct coat colour phenotypes were used for SNPs discovery by direct sequencing: BIO (light-brown), ALP (brown chamois with black-face-stripes and back stripe), SAA (solid white) and ORO (miscellaneous coat colour patterns such as mantled, black and tan, light grey). VER breed (solid black) was sampled afterwards and not included in the panel used for SNPs discovery.
PCR SuperMix High Fidelity (Invitrogen, Carlsbad, CA, USA) was used for fragment amplification following the manufacturer's instructions. The PCR products were sequenced (BMR Genomics DNA sequencing service, http://www.bmr-genomics.com), checked for homology with the reference gene sequences and submitted to Genebank (accession numbers EU644500, EU074673-92, EU037982-93 and GU393242). The sequences were aligned using BioEdit (http://www.mbio.ncsu.edu/BioEdit/bioedit.html) software.
SNPs genotyping
Large-scale SNPs genotyping was outsourced to KBioscience (http://www.kbioscience.co.uk), which uses a patented allele-specific PCR system (KASPar; KBiosciences, Hoddesdon, UK). In addition to the panel of SNPs discovered in this work, two previously reported mutations in the MCR1 gene were genotyped (Wu et al., Reference Wu, Li, Liu, Gong, Liu, Wang, Xin and Ji2006).
Statistical analysis
Population genetics parameters and the F st coancestry matrix (Weir and Hill, Reference Weir and Hill2002) between populations were calculated using PowerMarker v3.25 (http://statgen.ncsu.edu/powermarker; Liu and Muse, Reference Liu and Muse2005). All possible allele pair combinations were tested for linkage disequilibrium using Lewontin's disequilibrium coefficient (D′; Lewontin, Reference Lewontin1988), considering 0.7 as a significant threshold value (Khatkar et al., Reference Khatkar, Zenger, Hobbs, Hawken, Cavanagh, Barris, McClintock, McClintock, Thomson, Tier, Nicholas and Raadsma2007).
To detect the presence of a SNP potentially subject to divergent or balancing selection, the F st outlier approach developed by Beaumont and Nichols (Reference Beaumont and Nichols1996) was applied using LOSITAN software (Antao et al., Reference Antao, Lopes, Lopes, Beja-Pereira and Luikart2008). The analysis was performed by running 95 000 simulations, ‘neutral’ mean F st option on, force mean F st option on and under the infinite alleles model.
The frequency-based method of Paetkau et al. (Reference Paetkau, Calvert, Stirling and Strobeck1995) and the Bayesian-based methods of Rannala and Mountain (Rannala and Mountain, Reference Rannala and Mountain1997), Baudouin and Lebrun (Baudouin and Lebrun, Reference Baudouin and Lebrun2001) as implemented in the software GeneClass 2 (http://www1.montpellier.inra.fr/URLB/index.html) and the method developed by Pritchard et al. (Reference Pritchard, Stephens and Donnelly2000) implemented in the software STRUCTURE 2.2 (http://pritch.bsd.uchicago.edu/structure.html) were used for the allocation tests.
In GeneClass 2, the likelihood method without associated probabilities and an assignment threshold value of 0.05 were used (Piry et al., Reference Piry, Alapetite, Cornuet, Paetkau, Baudouin and Estoup2004).
In STRUCTURE 2.2, 50 000 ‘burn-in’ iterations were run to minimize the effect of the starting configurations, followed by 500 000 Markov Chain Monte Carlo iterations. The parameter K was set equal to the number of populations either under the No Admixture Model or allowing using prior population information (USEPOPINFO) model. In the first case, we used STRUCTURE 2.2 in the default mode using only genetic information to learn about population structure. In the second, we used the additional information of breed of origin, to support the clustering. In this case, we added information regarding the breed of origin for each animal in the input data file and we used the USEPOPINFO model.
The efficiency of the algorithms was estimated calculating the percentage of correct assignments (number of individuals correctly allocated to breed ‘j’/number of animals sampled from breed ‘j’); the average assignment probability (average of the probability of all correct assignments per breed); and specificity (number of correct assignments to breed ‘j’/ total (correct + incorrect) assignment to breed ‘j’).
The ability of different SNPs to discriminate the five breeds analysed was assessed by the Factorial Correspondence Analysis using the ‘Analyse factorielle des correspondances sur populations’ option available in the program GENETIX (Belkhir et al., Reference Belkhir, Borsa, Chikhi, Raufaste and Bonhomme2004). The obtained coordinates of SNPs and breeds on the four factorial axes were then represented, axis by axis, to better evaluate the connection between relevant SNPs and breeds.
Results and discussion
SNPs discovery and genotyping
The sequence comparison revealed 48 SNPs and 3 INDEL (INsertion DELetion) in 28 out of the 36 genes analysed. Only 2 out of the 51 polymorphisms had already been reported (Wu et al., Reference Wu, Li, Liu, Gong, Liu, Wang, Xin and Ji2006) as discussed below. Among the newly identified SNPs, 26 single mutations and one INDEL were located in introns and 22 single mutations and two INDEL in exons. A total of 12 SNPs were non-synonymous.
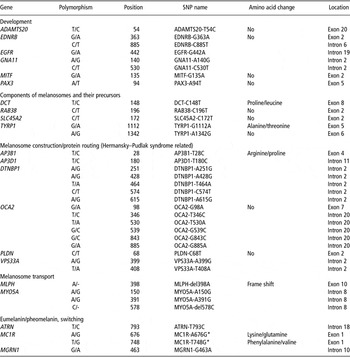
Out of the 51 mutations detected, 45 were successfully genotyped on all the samples. Of these, eight were monomorphic, revealing a relatively high sequencing error rate during the SNPs detection step. Information on SNP location, type of mutation, nucleotide position and the amino acid change is reported in detail in Table 1, whereas in Table 2 of supplementary materials, the set of genes analysed grouped by their role in the coat colour pathways is listed.
Polymorphisms detected by the alignment of the genomic sequences of eight goats, type of mutation and nucleotide position numbered from the first base of the reference gene sequences in GenBank. Also, the non-coding or coding position and the amino acid change involved is reported. The genes are grouped by the role in the coat colour pathway of the pigmentation, following Bennet and Lamoreux (Reference Bennet and Lamoreux2003)

*Wu et al. (Reference Wu, Li, Liu, Gong, Liu, Wang, Xin and Ji2006).
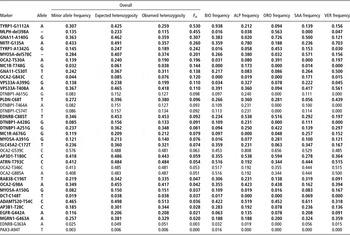
Minor allele frequency, expected and observed heterozygosity, F st calculated in the entire dataset, minor allele frequency for each SNPs calculated overall and per breed (only an allele with a minor frequency in the dataset was reported)

The 29 SNPs used for the assignment test are shown in bold.
Among the 37 SNPs in 21 genes retained for the statistical analysis, 22 were located in introns and 15 in exons; two of the latter were a single nucleotide deletion and six were non-synonymous (Table 1).
The minor allele frequency for each SNPs calculated per breed and the frequency of these alleles per breed are reported in Table 2. In total, 26 SNPs were polymorphic in all breeds, four SNPs (MLPH-del398A; OCA2T530A; MC1R-A676G; EDNRB-G363A) were polymorphic in four breeds, five SNPs (DTNBP1-A428G; DTNBP1-T464A; DTNBP1-C574T; DTNBP1-A615G; OCA2-G843C) in three breeds, two SNPs (DCT-C148T; MC1R-T748G) in two breeds and one SNP (PAX3-A94T) only in the BIO breed. In total, five SNPs had an overall frequency of the minor allele less than 5% (Table 2). No breed-specific SNPs were detected, even in the MC1R gene, which plays a major role in the pigmentation of many species (Marklund et al., Reference Marklund, Johansson Moller, Sandberg and Andersson1996, Kijas et al., Reference Kijas, Wales, Törnsten, Chardon, Moller and Andersson1998, Våge et al., Reference Våge, Fleet, Ponz, Olsen, Monteagudo, Tejedor, Arruga, Gagilardi, Nattrass and Klungland2003). In particular, one of the two MC1R mutations genotyped (A676G; MC1R-A676G in this work) was polymorphic in all five breeds analysed despite its previously reported association with the red head phenotype in Boer goats reported in Wu et al. (Reference Wu, Li, Liu, Gong, Liu, Wang, Xin and Ji2006).
The allocation methods used require independent markers. The Lewontin D′ measure of linkage disequilibrium was significant for 12 SNP pairs; thus, one SNP per pair was removed from the dataset to meet the assumption of independence between loci. Ranking the remaining 31 SNPs for their F st values, those found in TYRP1 exon five and in MLPH exon 10 showed the highest F st values (0.53 and 0.45, respectively) and, consequently, the highest discriminant power. The former also behaved as outliers and candidates for positive selection, its F st values being above the 99.5% confidence interval of neutrality.
In all, two SNPs showed an F st equal to zero and were removed from the panel used for traceability analysis. Therefore, the final panel of SNPs assayed for breed traceability comprised 29 independent polymorphisms discovered in 20 genes (Table 2 in bold).
The SNP putatively under selection was excluded from the dataset to meet the assumption of neutrality in the estimation of population genetic parameters (Allendorf and Luikart, Reference Allendorf and Luikart2007).
Observed heterozygosity ranged from 0.23 in VER to 0.30 in SAA, whereas expected heterozygosity ranged from 0.25 in ORO and BIO to 0.29 in SAA. No significant differences were detected between observed and expected heterozygosity.
The within-population inbreeding coefficient (f) was 0.052 in BIO, −0.083 in ALP, −0.038 in ORO, −0.043 in SAA and 0.121 in VER.
Pair-wise F st-based distances between breeds ranged from 0.04 (SAA v. BIO) to 0.18 (ORO v. VER and ORO v. ALP).
Among the five breeds, ORO had the highest average genetic distance (0.17), whereas BIO had the lowest (0.08), confirming previous results on the genetic origin of ORO with respect to the neighbouring ALP breeds (Ajmone-Marsan et al., Reference Ajmone-Marsan, Negrini, Crepaldi, Milanesi, Gorni, Valentini and Cicogna2001; Pariset et al., Reference Pariset, Cappuccio, Ajmone-Marsan, Dunner, Luikart, England, Obexer-Ruff, Peter, Marletta, Pilla and Valentini2006).
Assignment test
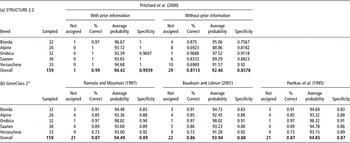
A panel of 29 SNPs was used for the analysis. STRUCTURE 2.2 (Table 3a) used as unsupervised methods (genotypic information only) correctly allocated 130 out of 159 individuals to their breed of origin (81.76%), considering an individual assigned if its probability of belonging to a breed was greater than 50%. With the addition of prior information on the putative population of origin, STRUCTURE 2.2 performance increased to 99% (158 out of 159) correct assignments at P > 50%. The overall specificity was 0.99 and the average probability of assignment was 0.9442. Only one animal belonging to BIO was wrongly assigned to the ORO breed.
Number of animals sampled per breed (sampled), number of animals not assigned (not assigned), percentage of correct assignments (% correct), specificity and average probability (average probability) calculated per breed using different software and assignment methods

*Assignment threshold of scores 0.05.
The assignment of individuals to their breed of origin using GeneClass 2 is reported in Table 3b. The Rannala and Mountain (Reference Rannala and Mountain1997) and Paetkau et al. (Reference Paetkau, Calvert, Stirling and Strobeck1995) methods of assignment performed with equal efficiency, with 87% (138 out of 159) correct assignment whereas for Baudouin and Lebrun the percentage of correct assignment was slightly lower: 86% (137 out of 159). With the three methods, the average probability of assignment was 94.43% on average and the specificity index was 88% on average. The worst assignment performance was observed for the VER breed (GeneClass 2.73%); however, the specificity in this breed was quite high (>92%). The ORO breeds were almost completely assigned by all the methods.
Methods by Rannala and Mountain (Reference Rannala and Mountain1997) and Paetkau et al. (Reference Paetkau, Calvert, Stirling and Strobeck1995) failed to allocate the same 21 individuals whereas Baudouin and Lebrun failed to allocate 22 individuals, the difference being only due to a new SAA animal. On assuming that all the samples originated from true breeds and were correctly labelled, inconsistencies between algorithms were observed in the wrong assignment. With Rannala and Mountain six animals were not assigned and 15 animals were assigned to a wrong breed, whereas with Paetkau et al. (Reference Paetkau, Calvert, Stirling and Strobeck1995) and Baudouin and Lebrun algorithms, 18 animals were wrongly assigned. Moreover, with the first algorithm, three animals were not assigned, whereas with the second, four animals were not assigned.
Overall, 92% of the samples were correctly assigned by STRUCTURE 2.2 with prior information and 85% of the samples were correctly assigned by GeneClass 2, which were assigned with a probability higher than 90%. These can be considered unambiguously as allocated samples.
In any case, for all methods, individuals with a probability of correct assignment from 50% to 70% showed at least a 20% lower probability of the second best assignment.
Although no private allele useful for breed traceability purpose has been identified, some of the SNPs identified showed an high discriminant power, reflecting their role in the coat colour determination.
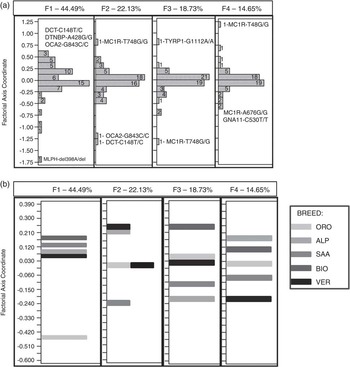
For example, the SNP with the highest F st values and potentially under directional selection is located in exon five of the TYRP1 gene. In BIO, characterized by eumelanic brown with white stripes on the head coat colour, this SNP displayed an elevated frequency of allele A (0.94) and absence of the GG genotype class. Considering this evidence and both the role of TYRP1 in the vertebrate melanin synthesis pathway and the already known mutations in TYRP1 associated with albinism in humans (Boissy et al., Reference Boissy, Zhao, Oetting, Austin, Wildenberg, Boissy, Zhao, Sturm, Hearing, King and Nordlund1996) and with colour variation in a number of domestic mammals, including cows (Berryere et al., Reference Berryere, Schmutz, Schimpf, Cowan and Potter2003), cats (Schmidt-Kuntzel et al., Reference Schmidt-Kuntzel, Eizirik, O'Brien and Menotti-Raymond2005) and sheep (Gratten et al., Reference Gratten, Beraldi, Lowder, McRae, Visscher, Pemberton and Slate2007), a possible role of this SNP also in the brown coat colour of goat might represent a hypothesis that may be worth investigating. At present, Italian breeder associations commercialize mono-breed products (e.g. ‘Fatulì della Val Saviore’, a goat cheese produced using milk exclusively from BIO) that are experiencing an increasing market demand. A DNA-based tool for food authentication might help these products achieve large distributions, and guarantee consumers from frauds. The SNPs’ capacity to differentiate the breeds was also assessed using Factorial Correspondence Analysis (Figure 1a and b). Figure 1a shows the distribution of different SNP alleles, whereas Figure 1b shows the position of the five breeds. Comparing these representations, the SNP alleles more relevant in differentiating breeds are clearly identifiable on the four factorial axes characterized by a decreasing value of inertia. The same extreme position on a single axis is an indication of the leverage effect of SNPs on breeds.
(a) Distribution of the single nucleotide polymorphism (SNP) alleles on the four factorial (F1–F4) axes coordinates obtained by Factorial Correspondence Analysis. The percentages of inertia for the four factorials axis along with the more extreme SNPs allele are reported. In each bar the total number of SNPs was also reported. (b) Coordinates of the five goat breeds analysed on the four factorial (F1–F4) axes rescaled to better ascertain the position of the breeds.

On the first factorial (F1), the MLPH-del398A mutation (Figure 1a in bold) has a strong effect in segregating ORO from the other breeds. On the third factorial (F3), the A allele of the TYRP1-G1112A differentiates the BIO. In agreement with these results, these SNPs have the highest F st values. However, other SNPs with an extreme position on the factorial axes did not affect the relative position of the breeds.
For example, the C allele of DCT-C148T, exclusive to SAA and ALP, has an extreme positive coordinate on axe 1 and a negative one on axe 2. However, it has a very low F st value (0.037) and very poor discriminant power. Probably due to the low frequency observed for T allele in both breeds (0.017 in ALP and 0.069 in SAA), this SNP does not impact the breed's distinctiveness.
In conclusion, in terms of a DNA-based method for goat breeds and product traceability, the best performance of our SNP panel has been observed in the allocation of ORO breed despite of its variable coat colour phenotypes. This result can be partially explained by the high degree of genetic originality of this breed, already observed by Ajmone-Marsan et al. (Reference Ajmone-Marsan, Negrini, Crepaldi, Milanesi, Gorni, Valentini and Cicogna2001) and by Pariset et al. (Reference Pariset, Cappuccio, Ajmone-Marsan, Dunner, Luikart, England, Obexer-Ruff, Peter, Marletta, Pilla and Valentini2006). In fact, as pointed out by several authors (Negrini et al., Reference Negrini, Nicoloso, Crepaldi, Milanesi, Marino, Perini, Pariset, Dunner, Leveziel, Williams and Ajmone Marsan2008 and Reference Negrini, Nicoloso, Crepaldi, Milanesi, Colli, Chegdani, Pariset, Dunner, Leveziel, Williams and Ajmone-Marsan2009), the assignment ability of a set of markers is proportional to the genetic differentiation among the individuals/breeds to be allocated.
The high overall rate of correct assignment and probability of allocations observed indicates that a small set of SNPs, selected in candidate genes, can be effective in setting up a traceability tool. Of course, the validity of the methods is confined to the set of reference breed analyses. Unfortunately, the high degree of admixture and the low genetic differentiation between livestock breeds (Luikart et al., Reference Luikart, Gielly, Excoffier, Vigne, Bouvet and Taberlet2001; Negrini et al., Reference Negrini, Nicoloso, Crepaldi, Milanesi, Marino, Perini, Pariset, Dunner, Leveziel, Williams and Ajmone Marsan2008 and Reference Negrini, Nicoloso, Crepaldi, Milanesi, Colli, Chegdani, Pariset, Dunner, Leveziel, Williams and Ajmone-Marsan2009) make the screening process of a universally applicable SNP panel for breed identification a very difficult task. Therefore, to be effective, all DNA-based assignment tests should be customized, identifying the target breeds or products to be authenticated and properly selecting the local or cosmopolite breeds’ potential market competitors to use as references.
Our results also stress the importance of representing all the breeds targeted in the discovery panel used in the SNP detection phase. As indicated by the low correct allocation rate of VER, the assignment performance of a panel of SNP affected by ascertainment bias can be significantly reduced.
Finally, to exploit biodiversity for the promotion of local products and for environmental safety, in our view, the candidate gene approach is still a valid method for the discovery of SNPs for this specific purpose, also awaiting large SNP panels in goats.
Acknowledgement
The authors wish to thank Stefano Giovenzana for the sample collection. The research was supported by grants from Cariplo, 0721/11.8094.