


Introduction
It is important to understand the characteristics of the hydrologic cycle, including precipitation, runoff, evaporation and ground-water storage to optimize management of water resources or to minimize the effects of hydrologic disasters such as snowmelt floods. In cold regions the accumulation of winter snowfall covers the ground for several months and runs off in a short time during the snowmelt season. Thus snow is an important hydrological variable. There are many studies concerning the heat balance of the melting snow surface, including Reference CasinièreCasinière (1974), Reference Price, Dunne and ColbeckPrice and Others (1976), Reference Marcus, Moore and OwensMarcus and others (1985) and Reference Ishikawa, Motoyama, Kojima and KaneIshikawa and others (1986). However, it is necessary to develop an expanded method to estimate the water balance of a whole watershed. Runoff is obtained by gauging the outlet of the watershed. The other components of the water balance are difficult to obtain because of the heterogeneous soils and topographic variability within a watershed. Topography affects incident radiation and wind patterns. Reference MotoyamaMotoyama (1986) and Reference Ishikawa, Nakatani, Kodama and KobayashiIshikawa and others (1994) developed a method to estimate a basin-wide snowmelt using the heat balance based on observed meteorological parameters at several points on a watershed. Melting occurs not only at the snow surface but also at the bottom of snow cover, which penetrates into the ground and contributes to winter runoff. Latent heat (evaporation) is considered to be the primary factor of water loss in the hydrologic balance (Reference Amiro and WuschkeAmiro and Wuschke, 1987; Reference Takeuchi, Kodama and IshikawaTakeuchi and others, 1995). Evaporation processes are complex and depend on meteorological conditions, surface morphology and geographical features (Reference KayaneKayane, 1980). This paper presents a method of estimating basin-wide evaporation and describes the water-balance characteristics of a small, experimental watershed.
Study Site and Instruments
The study site is a small watershed located within the Moshiri Basin, northern Hokkaido, Japan (142° 17′ E, 44° 22′ N). The watershed is 1.3 km2 in size and ranges from 285 m to 535 m in altitude (Fig.1). The area below 400 m occupies about 70% of the total area. Vegetation of the watershed is a mixed forest of evergreen needle-leaf trees and deciduous broad-leaved trees. The open forest with high sky-view factor (above 75%) occupies about 60% of the area. The dense forest (sky-view factor 25–40%) occupies 25% of the area and the remaining 15% is treeless. The detailed topographical features of the watershed have been reported by Reference Ishikawa, Nakatani, Kodama and KobayashiIshikawa and others (1994).
Location map of the Moshiri Land Basin, Hokkaido, Japan, with an enlarged topographic representation of the experimental watershed. The letters A, B, C, D, E and F refer to the observation sites mentioned in the text.
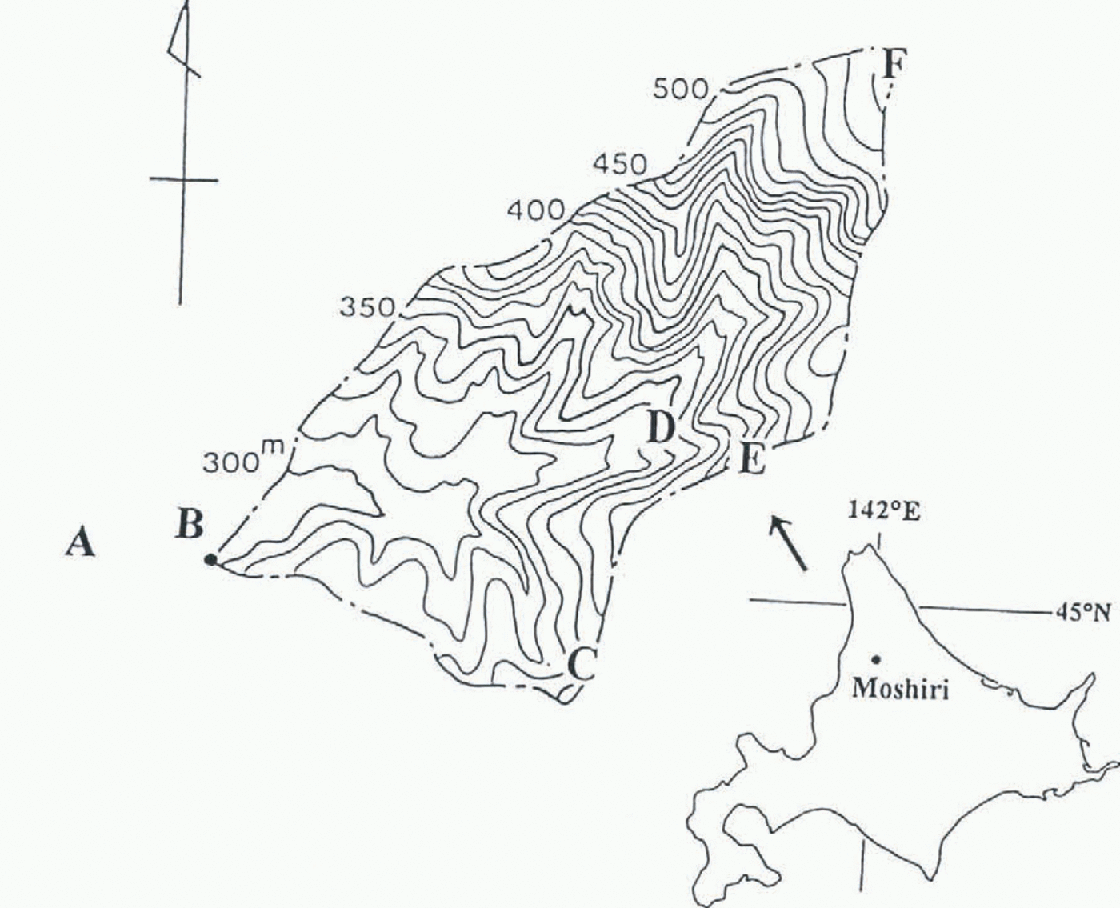
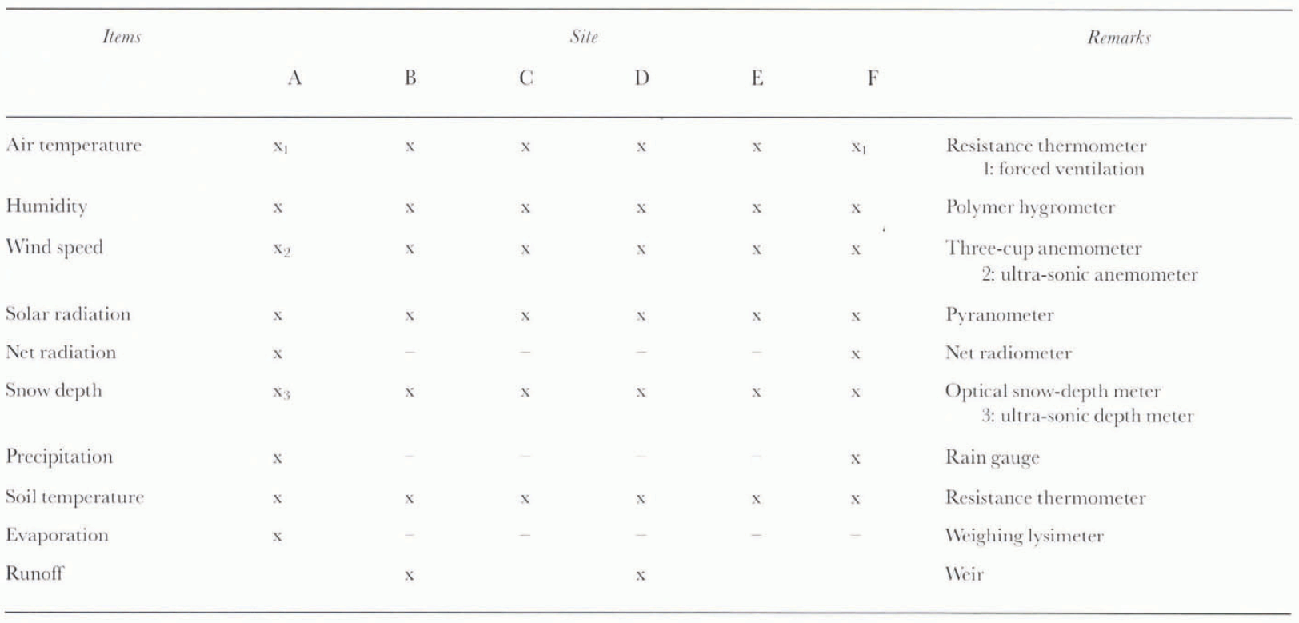
For 3 years, from April 1991 to March 1994, hydro-meteorological observations were made. Six observation sites were distributed in and near the watershed to measure the heat and water balances (Fig.1). A 10 m observation mast was placed at each site and equipped with instruments to measure air temperature, humidity, wind speed, solar and net all-wave radiation, soil temperature, precipitation and snow depth. Site A is located in an unforested, flat area just outside of the watershed, B is at the outlet of the watershed, C and E are located along a ridge, D is in the small valley wilh the same altitude of site C, and F is close to the highest point of the watershed. Air temperature, humidity and wind speed were measured at at least two different heights on each mast. Evaporation was obtained directly from the mass change of vegetated soil packed in a weighing lysimeter at site A and runoff was measured continuously by a weir at site B. Snow surveys were carried out several times during the winter to obtain the snow water equivalent. The measurements taken and instruments used are shown in Table 1.
Observation items and instruments
Results
Precipitation
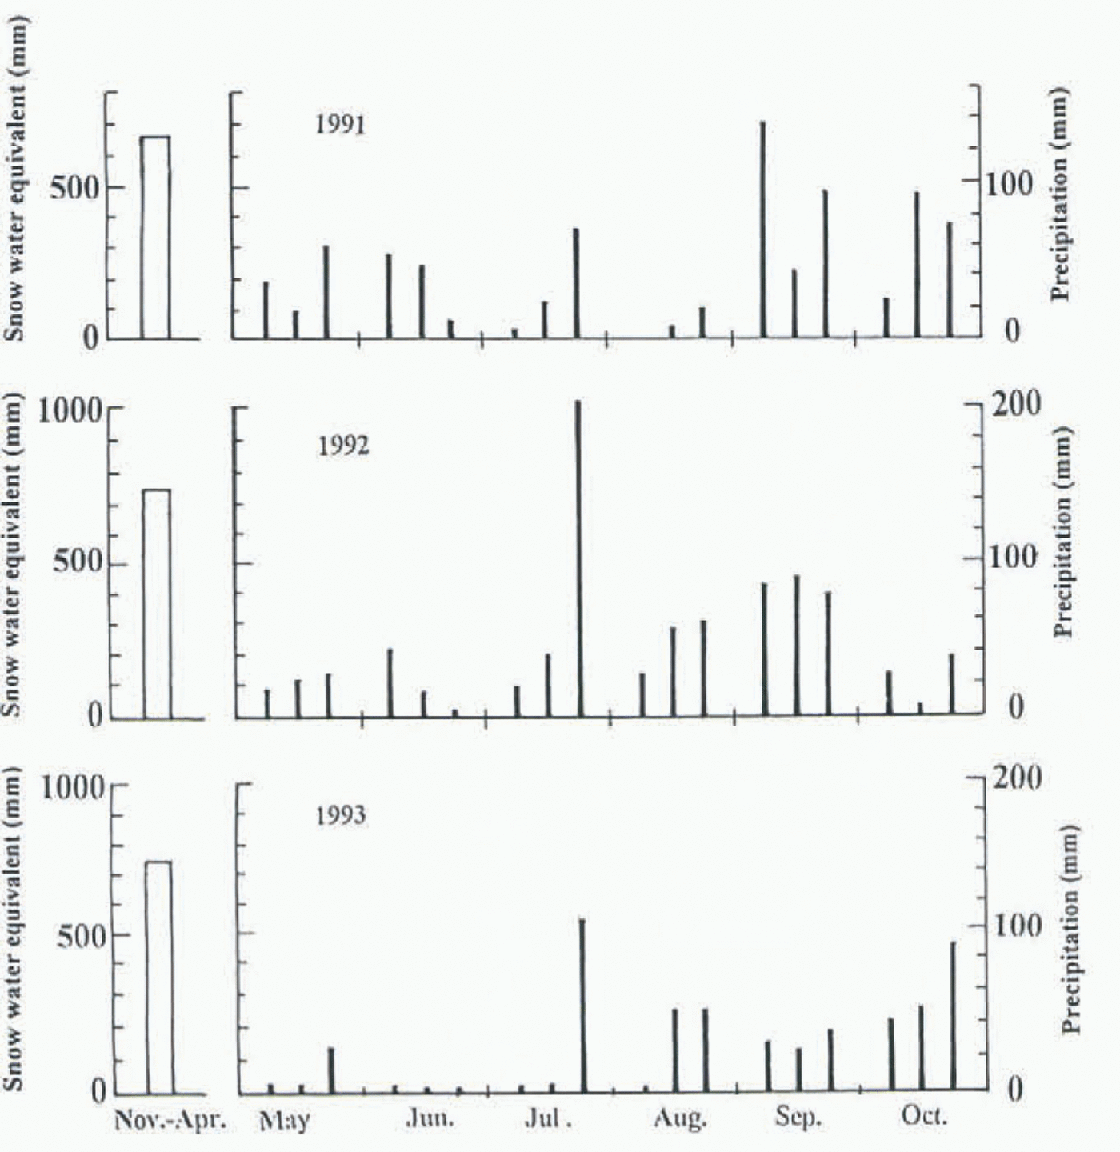
Rainfall measurement was carried out at the highest and the lowest sites, and snow depth was recorded continuously at six sites at the watershed. Figure 2 shows variations of precipitation summed over 10 days for 3 years. The maximum measured water equivalent of snow is also shown. The increase of rainfall in mid-to-late summer can be seen. The range of mean annual precipitation is 1423–1661 mm with a 3 year mean of 1546 mm. The range of maximum snow water equivalent is 660–750 mm with a mean of 718 mm. The fraction of annual precipitation that fell as snow ranges 42–52% with a mean of 47%. In this investigation a rain gauge with a 20 cm diameter was used for the rainfall measurement at each site and compared with a large Iysimeier (3.6 m × 3.6 m) for determining a collection coefficient. Winter precipitation was estimated from the maximum measured snow water equivalent of six sites. These factors induce some error for estimating basin-wide precipitation.
Variations within 10 day precipitation periods between May and October in 1991, 1992 and 1993 (right) and maximum snow in water equivalent (left).
Runoff
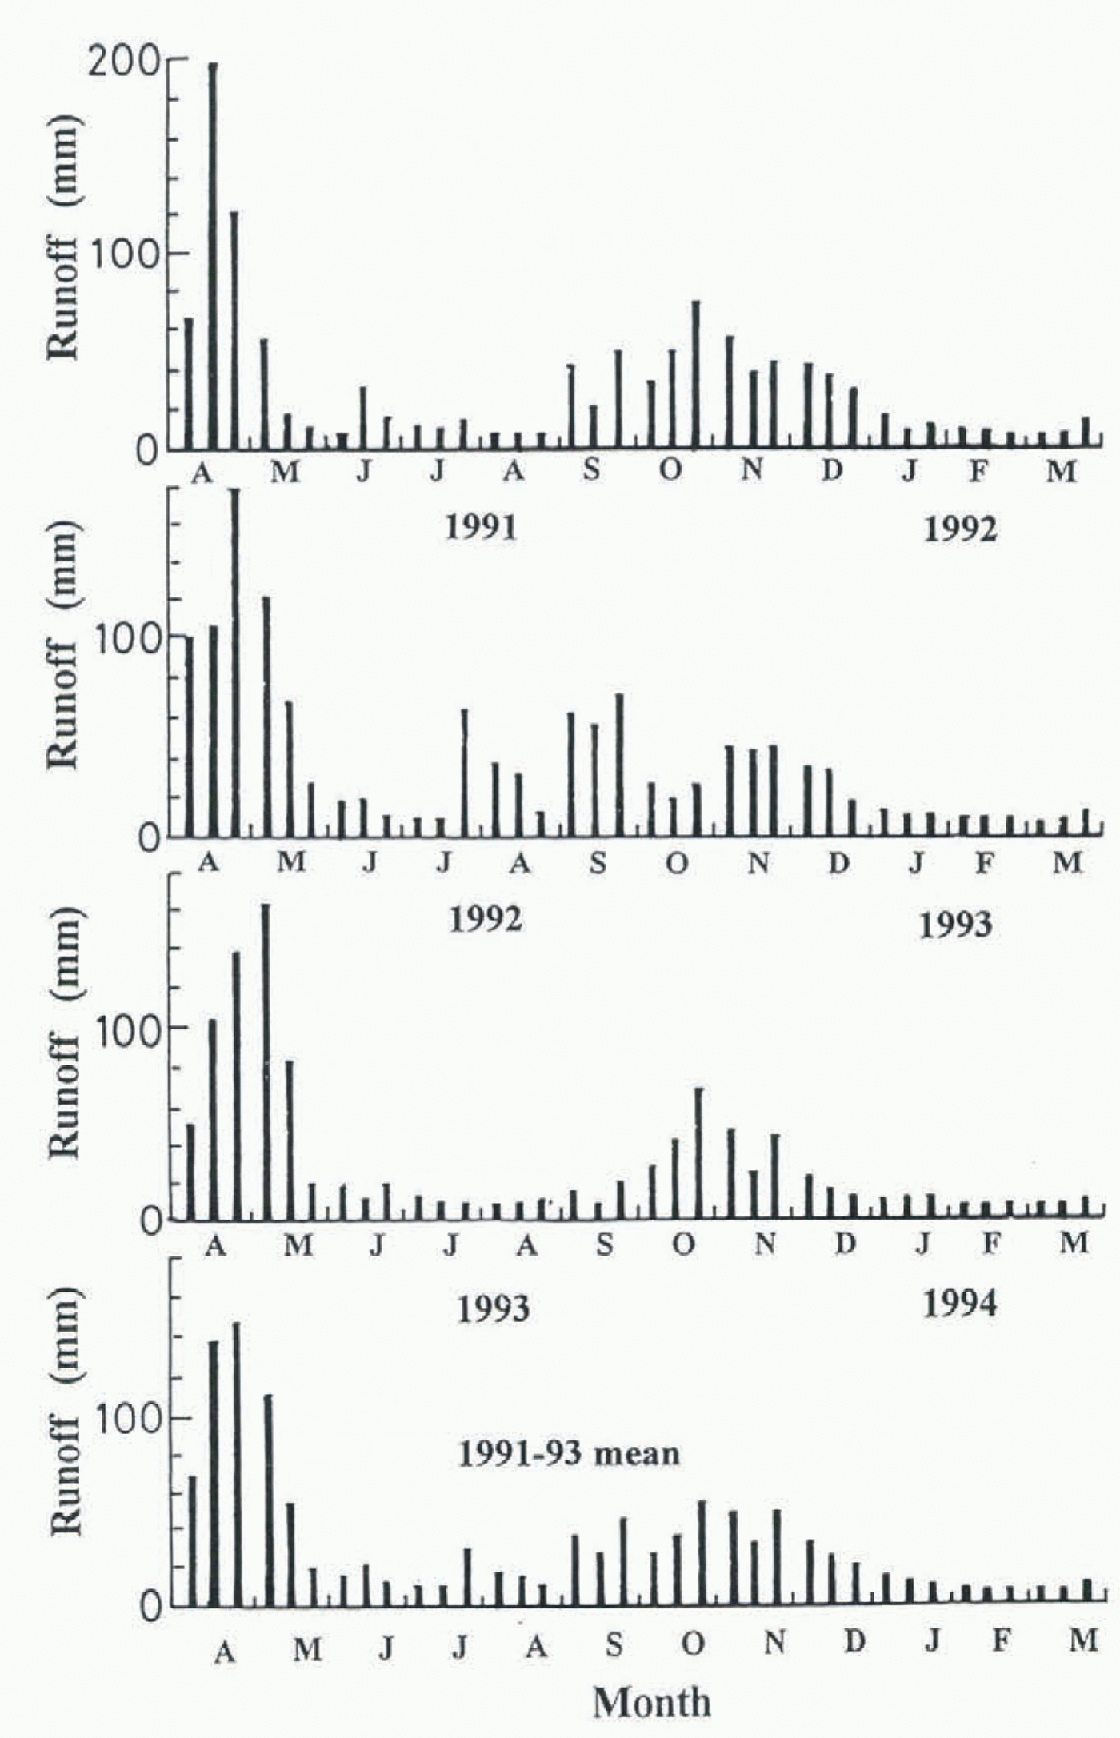
Figure 3 represents runoff summed for a 10 day period during the three hydrologic years. The highest runoff appears in April and May and is due to snowmelt runoff. Snow melt during the period accounts for 41–53% of the annual runoff with a mean of 45%. The second period with the highest runoff is in the autumn to early winter and accounts for 20% of the annual runoff, and results from the increase in rainfall. In winter, runoff is continuous although small. Winter runoff is caused by storage change of ground water. The water of basal snowmelt penetrates and increases the ground water. Basal snowmelt can be estimated by snow depth and air temperature (Reference Kojima and MotoyamaKojima and Motoyama, 1985). Our calculations indicate that the total basal snowmelt in winter ranges from 67 to 100mm (0.44–0.66 mm d−1) during a 3 year period by using 10 day means of air temperature and snow depth at site A, and it is assumed that the value represents the whole watershed.
Variation within 10 day runoff in 1991, 1992 and 1993.
Evaporation
Measurements for evaporation during the snow-free period from May to October was obtained by four different methods at site A. These included direct measurements of mass changes of vegetated soil and water in containers, water-level changes in an evaporation pan, calculations using the Penman method and estimated from the residual of the water balance. The schematic illustrating the instrumentation for direct measurements is shown in Figure 4. Two containers (40 × 46 × 10 cm) were used; one was packed with vegetated soil and the other filled with water. These containers were placed on electronic scales buried in the ground to keep the sample surface flush with ground level. The maximum load of the machine was 30 kg and the resolution was 1g. The mass of each container was electronically recorded at 60 second intervals. The Penman method was used to calculate evaporation from vegetated soil and water surfaces. Its derivation combines the energy balance with the aerodynamic and mass transfer process, which is expressed by

where E is evaporation (mm d−1), QN is the equivalent evaporation amount with net radiation and QG is the conductive heal of soil, ∆ is the slope of the saturation vapor pressure vs temperature, γ is the psychrometer constant, and Ea is evaporation due to the vapor pressure deficit of the atmosphere, which is expressed by

where e as is the saturation vapor pressure at ambient air temperature, e is vapor pressure in the air and f(u) is the function of wind speed whose dimension is mm d−1 hPa−1

where we adopted a = 0.26, b = 0.5 and c = 0.54 from Reference PenmanPenman (1963), and u is the wind speed 1.0 m above the surface.
Schematic illustration of evaporation measurements.

Figure 5 shows the means of 10 day air temperature, humidity and wind speed at sites A and F. The air temperature shows large seasonal variations; the maximum appeared in August and the lowest in February. Temperatures below freezing lasted for four months. The temperature difference between the two sites was about 2° C, due to an altitude difference of 250 m. There is no significant change of relative humidity with season and altitude, and it is relatively constant at 90%. Wind speed increases wiih altitude, and it tends to be stronger in winter. Reference Ishikawa, Nakatani, Kodama and KobayashiIshikawa and others (1994) described the meteorological features of the basin in detail, and concluded that solar radiation and net radiation did not change with altitude.
Air temperature, relative humidity and wind speed var-
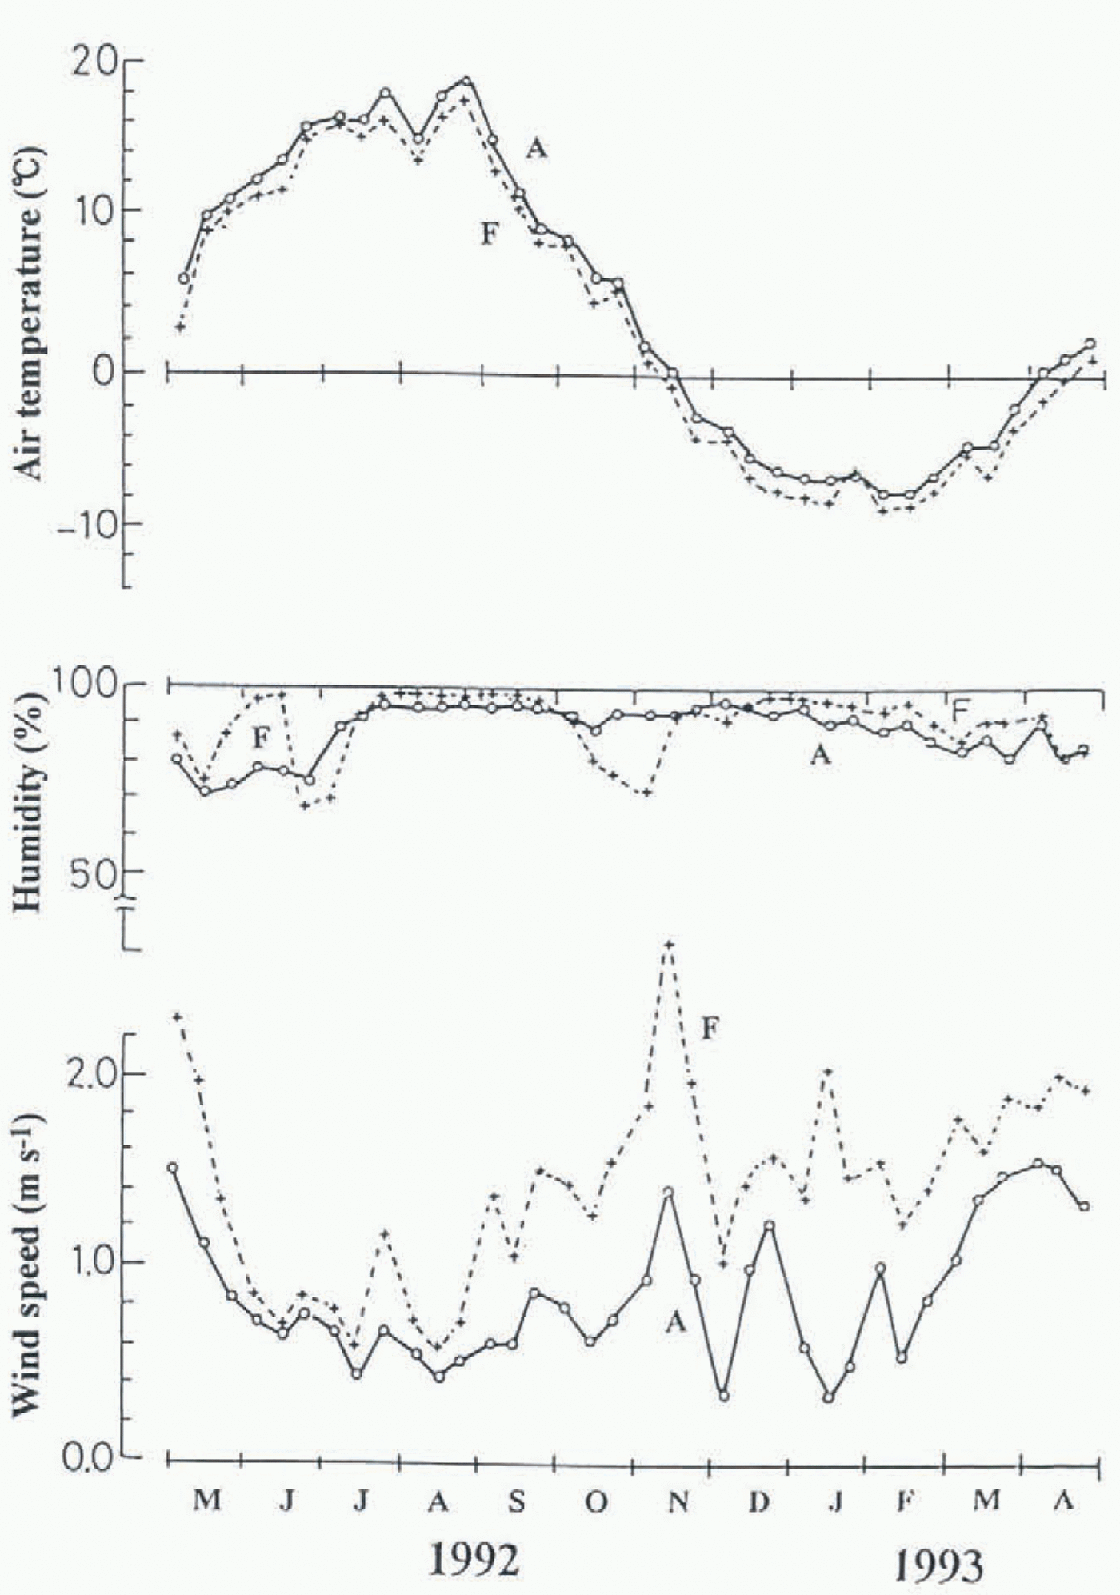
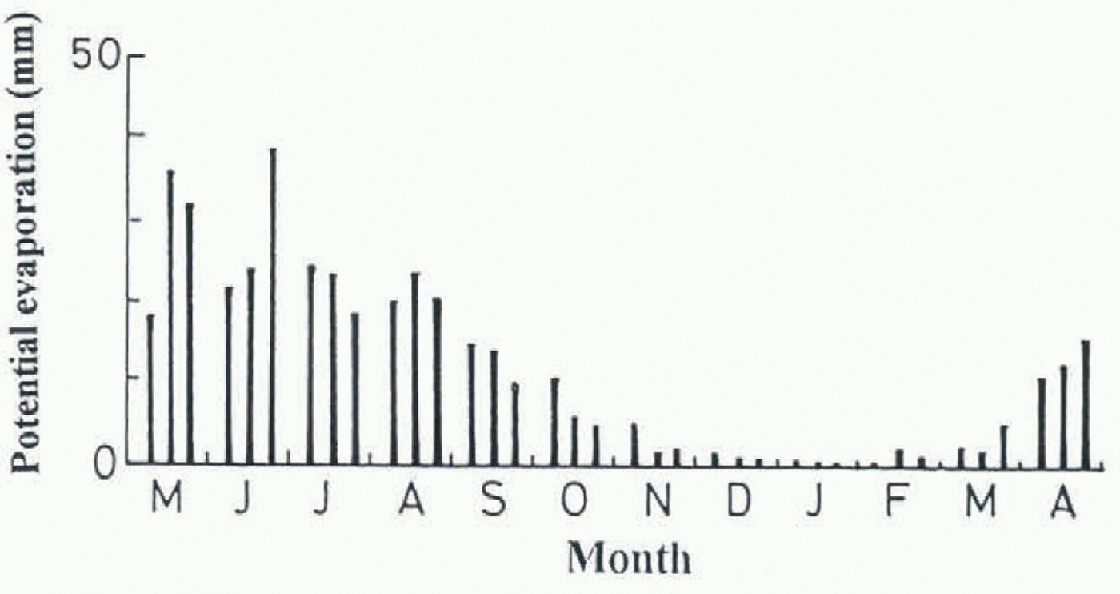
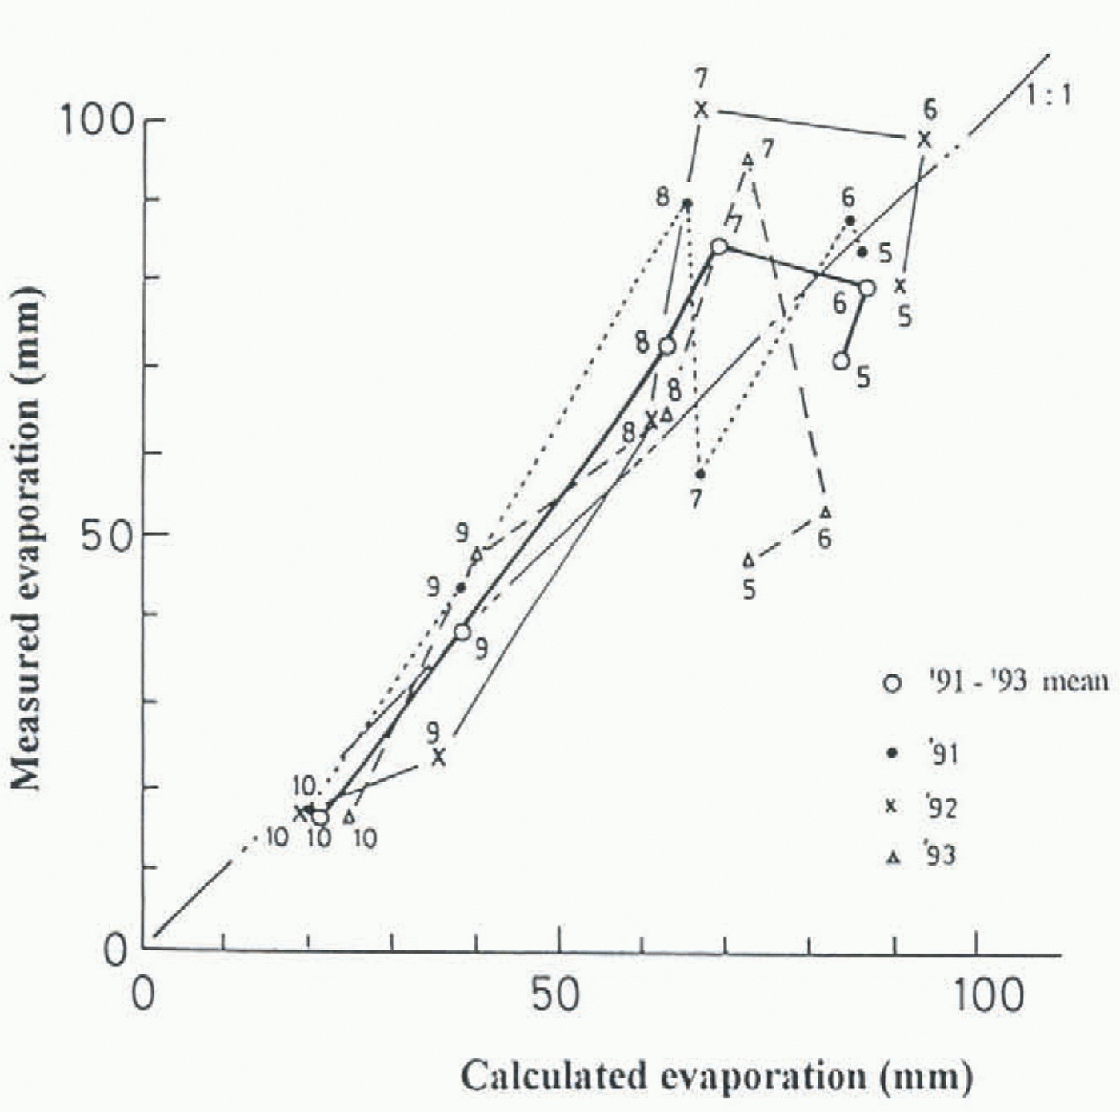
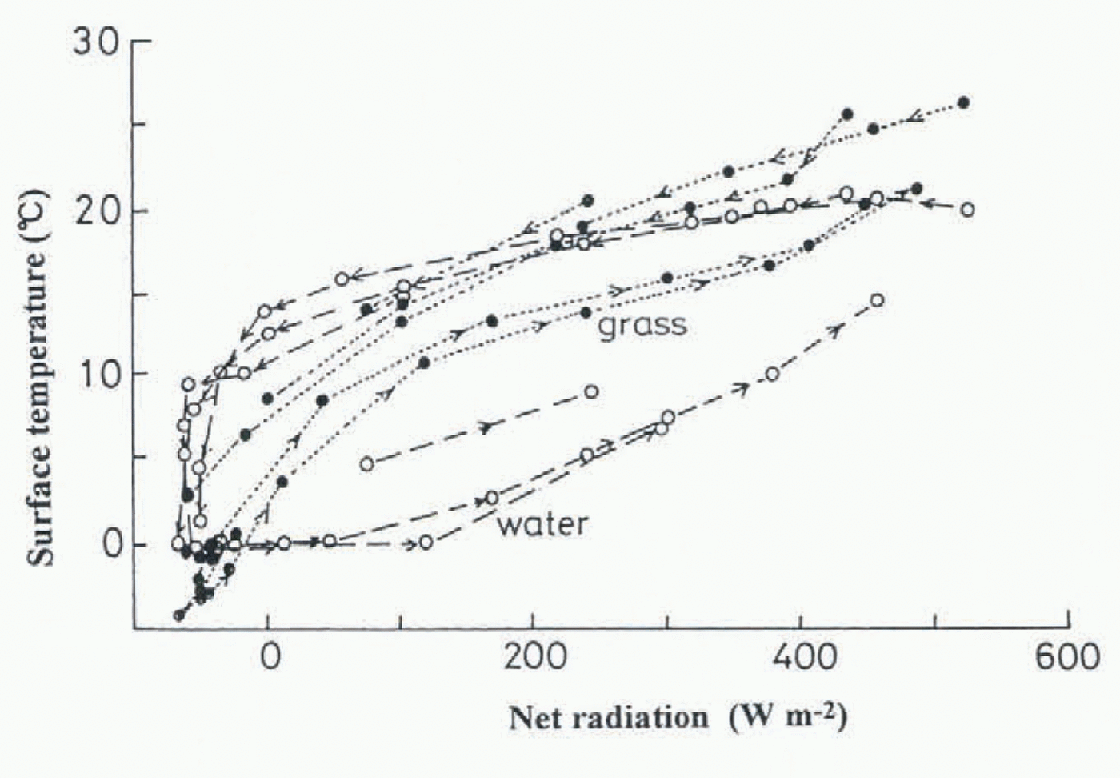
Figure 6 shows the evaporation estimated at site A from Equation (1) summed over 10 day intervals for 3 years. A clear seasonal trend is obvious with the greatest evaporation, above 20 mm 10d−1, occurring from May to August, decreasing in September and October, and becoming negligibly small in winter. Thus, evaporation during the snow-free period is an important factor in the annual water balance. The estimated evaporation was compared with the measured values at site A (Fig.7). The values are the monthly sum from May to October, and the thick solid line is the mean of each month for 3 years. Calculations correlate with the measurements except for May and July. The Calculated value for May was larger than the measured value and vice versa in July. Tb explain the cause of this discrepancy we examined the diurnal relation between net radiation and measured evaporation from vegetated soil (grass) and water surfaces (Fig.8). These data are hourly values for 3 days and show a hysteresis of lower evapotran-spiration during increasing solar radiation (morning) and higher evapotranspiration during decreasing radiation (afternoon). Water surfaces have a wider loop than grass surfaces. Because the two instruments for measuring evaporation (Fig.4) were separated by only 1 m the meteorological conditions over each were the same. In addition the vegetated soil was irrigated. Therefore the causes of the discrepancy and the hysteresis must be due to the time lag of surface temperature change.
Sum of potential evaporation at site A (10 day mean).
Comparsion of calculated and measured evaporation at the water surface between 1991 and 1993. The thick solid line represents the three year mean and the numbers indicate the month.
The relationship between net radiation and measured evaporation at water and vegetated soil surfaces. Values are hourly sums over a 3 day period.
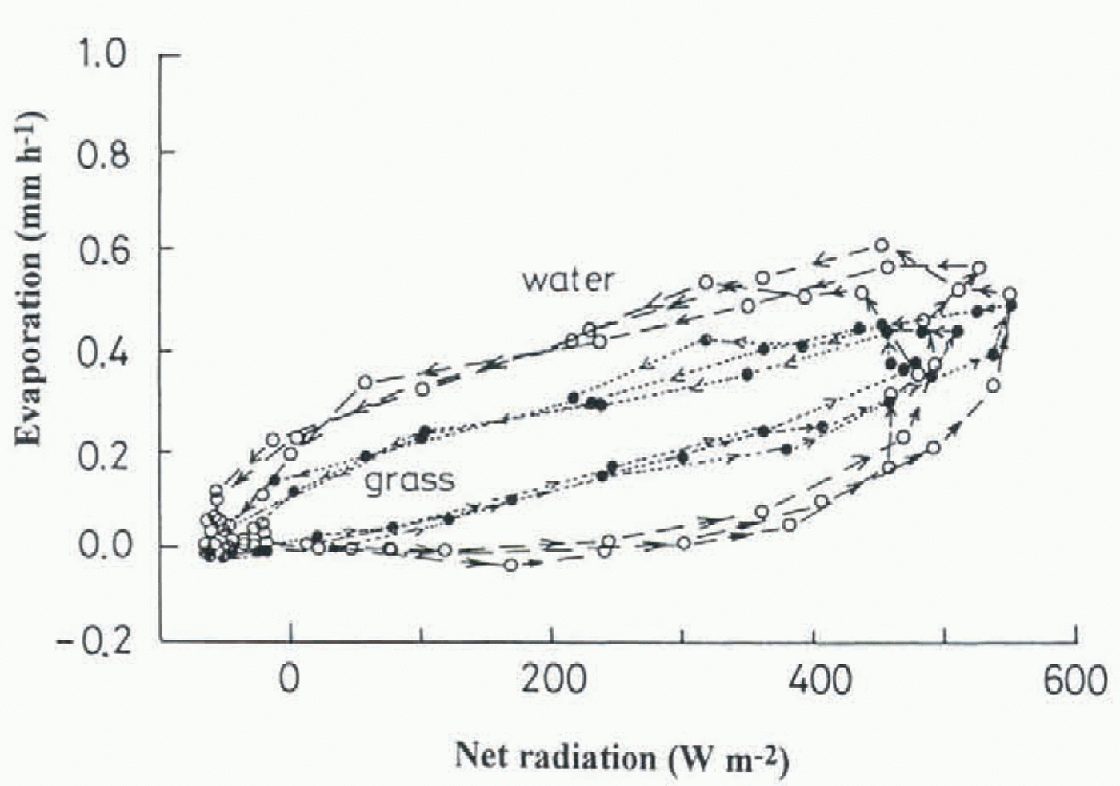
The relation between net radiation and surface temperatures indicate roughly the same hysteresis (Fig.9) as evaporation. Thus, differential rates of heat absorption are responsible for the observed hysteresis in evaporation. Monthly variations in evaporation cannot be compared directly to hourly variations, but the overall explanation is similar. During the period before June, solar radiation is increasing, and vegetation temperature rises faster than water temperature, resulting in a poor correlation for this period. By analogy, this is the same process that occurs during the morning. Conversely, as the solar radiation decreases in July, vegetation cools before water, and is similar to the heat-balance processes in the afternoon.
The relationship between net radiation and surface temperature at water and vegetated soil surfaces. Values are hourly sums over a 3 day period.
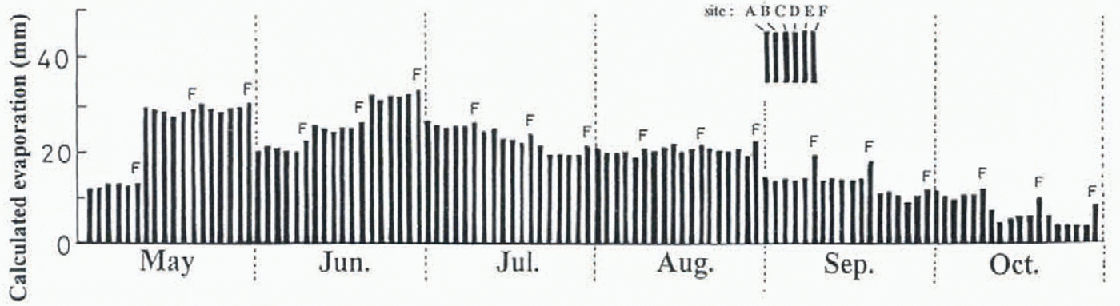
Basin-wide evaporation was estimated by using observed meteorological data at six sites and Equation (1). The net radiation at site A was used as the typical value for the watershed (Reference Ishikawa, Nakatani, Kodama and KobayashiIshikawa and others, 1994). The distribution of estimated evaporation for 10 clay intervals from May to October is shown in Figure 10 for 1993. The largest value appeared at site F, which has the highest altitude of the watershed, while the other sites were comparable. Using these results it was possible to evaluate the water balance of the watershed.
Variation within 10 day potential evaporation at the six sites.
Water balance of the watershed
The water balance of the watershed is expressed by

where P is precipitation, R is runoff, E is evaporation and S is water-storage change in the ground. All variables in Equation (4) are expressed as the watershed means (mm). with those toward the watershed being positive and those away from the watershed negative. Reference KayaneKayane (1980) suggested that S cannot be neglected over the year, but Reference NakaoNakao (1971) estimated S as the remainder of the water balance and found that S was only a few per cent of the annual precipitation. So S was omittted for calculating the annual water balance in this investigation.
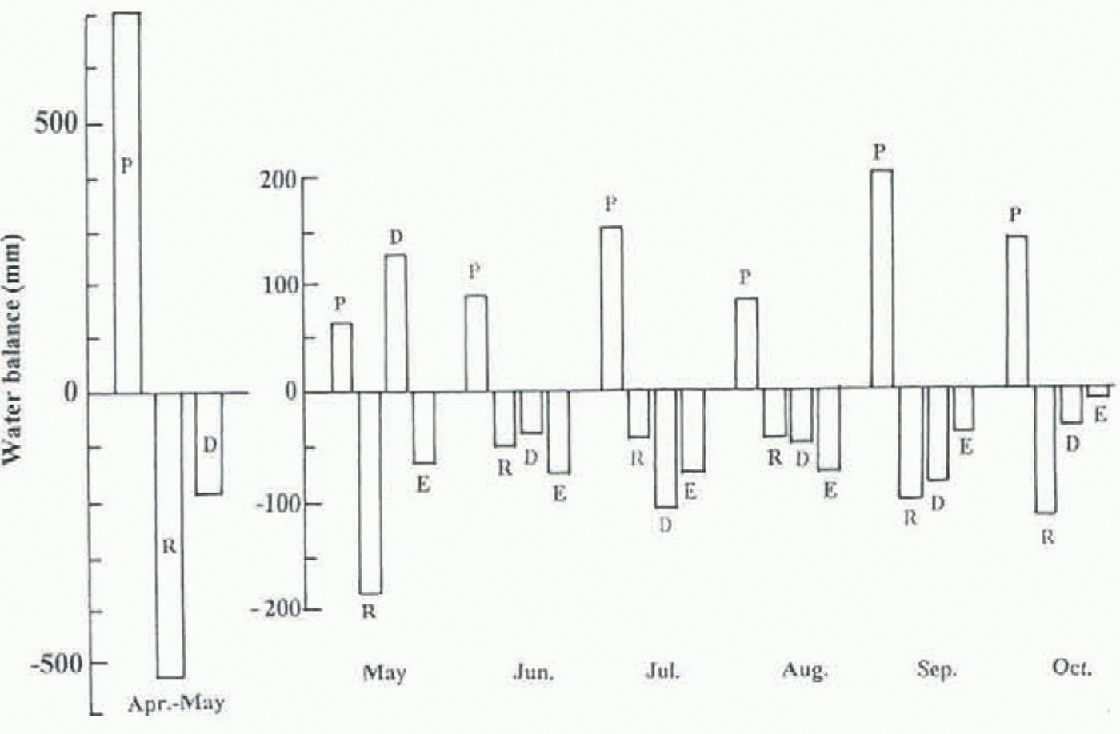
Figure 11 exhibits monthly values for the three components of water balance (P, R, E) from May to October, which are averaged for the 3 study years. E is the estimate based on Equation (1) and compared with the difference between R and P (D). Runoff during May is much greater than precipitation because of snowmelt discharge. The water balance during snowmelt runoff is shown at the left-hand side of Figure 11. The input factor is precipitation, and runoff is the output. One month is too short a period adequately to compare E and D, because D includes E and S.
Monthly variations of water balance components from May to October, and snowmelt time. P, precipitation; R. runoff; E, evaporation (calculated); D, difference between precipitation and runoff.
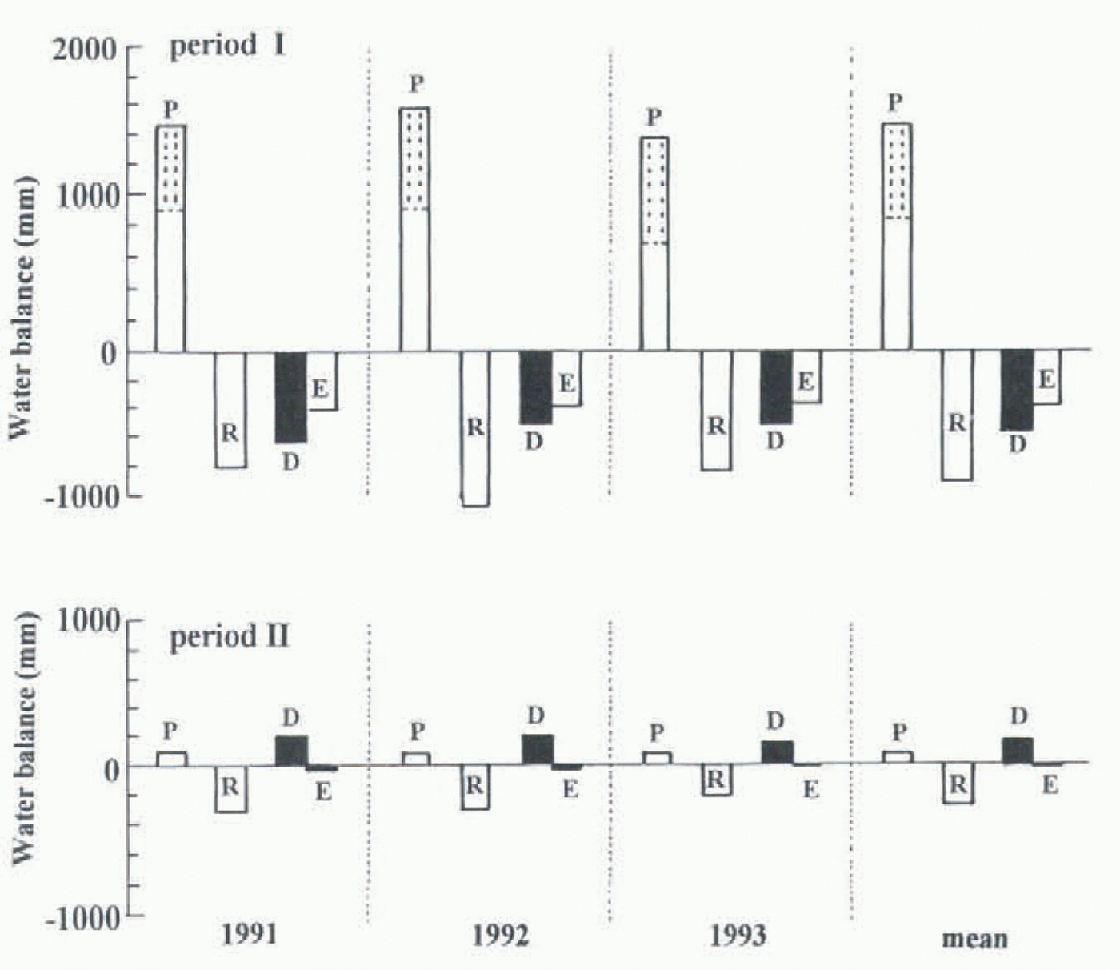
Balances from April to October (period 1) and from November to March (period 2) are presented in Figure 12. The righthand side of Figure 12 shows the 3 year mean. The snow water equivalent before snowmelt was added to the rainfall of period 1. The input during period 2 is the basal snowmelt water. During period 1, the precipitation is almost balanced with runoff and evaporation; the evaporation losses represent 27% of the precipitation, while the evaporation from June to October (summer time) reached to 39−50% of the precipitation of the period. During period 2, runoff is much larger than the melt input, and evaporation is negligible, so the water budget does not balance.
Water balance during April-October (period 1) and November-March (period 2). The precipitation value (P) in period 1 includes snow water equivalent and in period 2 includes basal snowmelt.
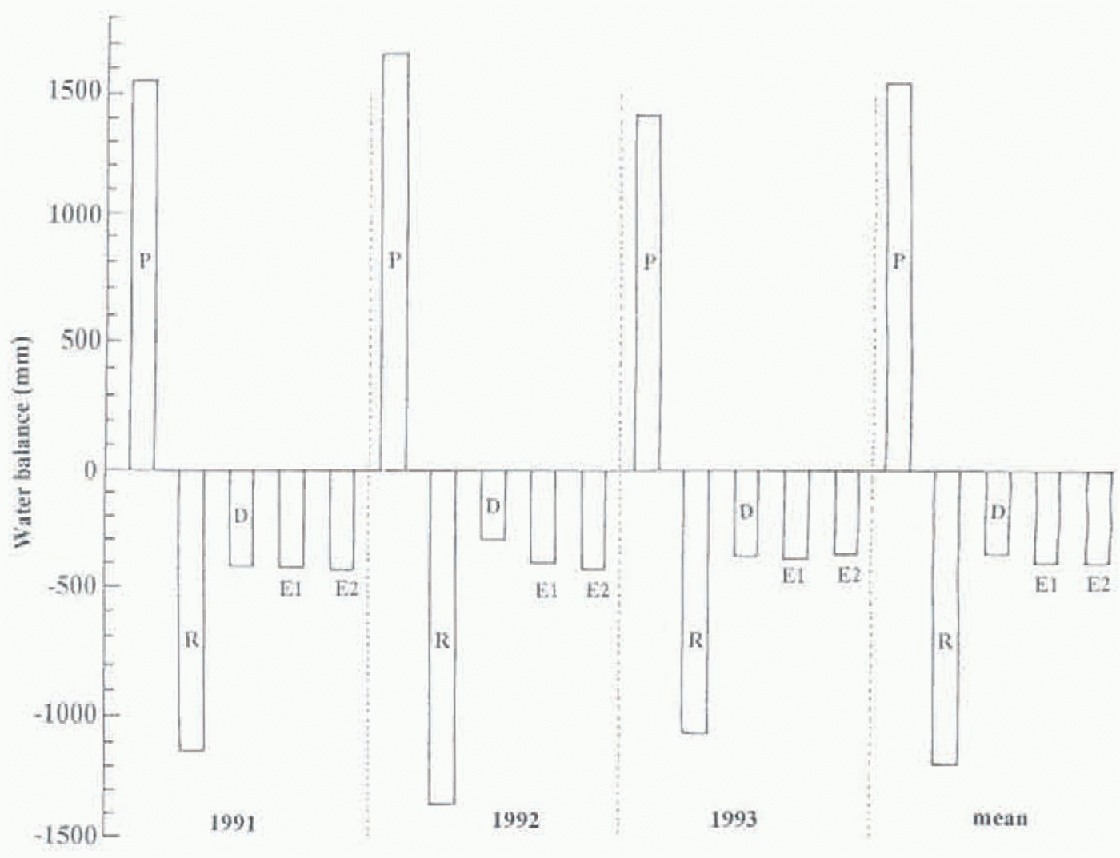
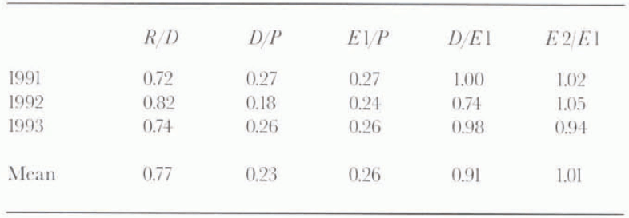
The annual water balance for the three study years is presented in Figure 13. The portion of each water balance is listed in Table 2. The runoff to precipitation ratio (R/P) ranges from 0.72 to 0.82 with a mean of 0.77. Evaporation was estimated by three methods: calculation (E1), measurement (E2) and the difference of the precipitation and runoff (D). The fractions of calculated evaporation and the residual to annual precipitation are about 26% and 23%, respectively. It means that the calculated evaporation overestimated actual evaporation, but these values are in relatively close agreement. Reference NakaoNakao (1971) studied the water balance of a wider watershed in Hokkaido for six hydrologic years and estimated the evaporation as the remainder of precipitation and runoff. The range of the evaporation was 13–37% to the annual precipitation, which was similar to results obtained in this investigation.
The annual water balance and the mean (E1, calculations; E2, measurements) for three hydrologic years.
Ratios of water-balance components to annual precipitation. P is precipitation; R is runoff; D is P–R. E1 is evaporation (calculated); E2 is evaporation (measured)
Conclusion
Hydrometeorological observations were carried out at a small watershed for 3 years to study the water balance. In this watershed, snow accounted for 47% of the annual precipitation and snowmelt accounted for 45% of the total runoff. The peak runoff appeared in April and May due to snowmelt, and a second peak occurred in autumn caused by an increase in rainfall. Continuous runoff lasted through midwinter due to basal snowmelt. Measured and calculated values of monthly evaporation coincided except for May and July. The monthly discrepancies were explained by the different rates of heat absorption and resulting time lag between the change of net radiation and surface temperature A large seasonal trend in evaporation was revealed, with the greatest evaporation occurring between May and August, decreasing in September and October. Evaporation was negligible in winter. The ratios of runoff and evaporation to annual precipitation were 0.77 and 0.26, respectively. Consideration of evaporative losses in this mountainous watershed significantly improved the estimate of water balance.
Acknowledgements
The authors are indebted to the staff of the Moshiri Branch of the Uryu Experimental Forest, Hokkaido University, for their logistic support. They would also like to express their thanks to H. Nakabayashi of the Japan Weather Association, for assistance with the held research. A.G. Fountain of the United States Geological Survey, Denver, read the manuscript and provided useful comments. Part of this research was supported by the scientific research fund from the Ministry of Education, Culture and Science of Japan.



