1. Introduction
The combination of a relatively low birth rate and increasing life expectancy is leading to marked aging in Europe. Thus, in the ten years from 2008 to 2018, the share of people over 65 increased by 4.2 percentage points in the Netherlands and 3.8 in Portugal. In these countries, people over 65 years of age represented 18.8% and 21.5% of the population in 2018, respectively. In France, the share of people over 65 increased over the same period by 3.3 percentage points to represent 19.7% of the population. In Italy and Germany, the increase was less pronounced, with the share of those over 65 increasing by 2.4 and 1.3 percentage points respectively. They now represent 22.6% and 21.4% of the population. To cope with aging, European governments carried out in-depth pension system reforms, thus safeguarding pay-as-you-go (PAYG) systems. At the end of the 1990s, Italy and Sweden adopted notional defined contribution schemes (NDC) within a PAYG system. France only recently began a process of systemic reform leading to a point-based system. The current health crisis temporarily interrupted the reform process. This type of system tightly links pension entitlements to pension contributions and reinforces the responsibilities of households in maintaining their standard of living in retirement (Benartzi and Thaler, Reference Benartzi and Thaler2013; Poterba, Reference Poterba2014). Part of the risk is indeed transferred from the pension system to the insured (Debets et al., Reference Debets, Prast, Rossi and van Soest2020). who are often forced to delay their retirement age in order to obtain a pension equivalent to the one they would have had before the reforms. The effect of these reforms on household financial decisions is therefore particularly complex (Beshears et al., Reference Beshears, Chois, Laibson and Madrian2008; Fornero et al., Reference Fornero, Oggero, Puglisi, Holzmann, Palmer, Palacios and Sacchi2019). The transfer of responsibility necessarily involves asking households to make decisions that are rational, if not optimal. They must therefore be able to make relevant intertemporal trade-offs (Adams and Rau, Reference Adams and Rau2011), and to formulate hypotheses not only about their own future (employment, family, health) but also about the economic situation (interest rates, inflation, growth). Their choice of retirement has a direct impact on the amount of pension they will receive, and even if a reference retirement age can prevent people retiring too early and receiving too small of a pension, such a legal retirement age is no longer necessary as it does not balance the system (Bozio et al., Reference Bozio, Rabaté, Rain and Tô2019). At the same time, households have to anticipate their retirement income and whether their resources will be adequate. The literature on optimal savings decisions demonstrates how ill-equipped, or disparate, households are with respect to the need to prepare for retirement (Prast and von Soest, Reference Prast and van Soest2016). Given the lack of financial literacy and the complexity of issues related to retirement preparation, providing information to households can be a lever to change behavior, help households make long-term decisions and thus prepare for retirement. The abundant literature on financial literacy shows how a better understanding of financial mechanisms and environment is crucial to efficiently prepare for retirement, especially in a context of pension reform (Lusardi, Reference Lusardi2019; Yeh, Reference Yeh2020). Many pension reforms in OECD countries have included pension statements with the goal of improving individuals' financial security in retirement. Our objective is to assess the effectiveness of the pension information policy implemented in France and to investigate the pension statement impact in the retirement savings behavior.
Households lack basic financial education and that they do not pay attention to preparing for retirement (Lusardi and Mitchell, Reference Lusardi and Mitchell2011a, Reference Lusardi and Mitchell2011b, Reference Lusardi, Mitchell, Mitchell and Lusardi2011c; Lusardi, Reference Lusardi2019), which can lead to a sharp drop in living standards if they do not take into account the impact of pension system reforms. The situation appears even more worrying for households with the lowest standard of living, whose financial education seems to be the least developed, leading to lower savings (Lusardi and Mitchell, Reference Lusardi and Mitchell2011b), but also to less efficient investment choices (Stango and Zinman, Reference Stango and Zinman2007), or even to retiring too early to be able to have an adequate standard of living. Moreover, Bozio et al. (Reference Bozio, Rabaté, Rain and Tô2019) show that in the context of the potential introduction of a point-based retirement system in France, informing individuals when they reach a target replacement rate may be a good idea to guarantee that each individual obtains a replacement rate deemed to be sufficient.
Two types of information can be distinguished: on the one hand, general information, explaining to individuals how the pension system works, or the impact of reforms on pension levels at the age of retirement, and on the other hand, more specific and personalized information informing the insured about what they are entitled to and the amount of pension they can expect. The latter type of information can provide precise figures enabling individuals to have a clear picture of their standard of living after they have left the labor market. This is this system that has been introduced in France.
Providing information to households about public and occupational pensions is a way for governments to improve understanding (Joo and Grable, Reference Joo and Grable2000; Lusardi, Reference Lusardi2008, Reference Lusardi2019, Van Rooij et al., Reference van Rooij, Lusardi and Alessie2012) as well as to increase support for pension reforms. The role of the policy maker is therefore to improve the quality of information provided, but also to present it in a clear and uncomplicated way. The institutional environment can facilitate making good use of information at hand within an appropriate decision-making environment (Altman, Reference Altman2012). Better information appears to be a major issue, as citizens tend to overestimate their pension benefits (Dolls et al., Reference Dolls, Doerrenberg, Peichla and Stichnothb2018) and underestimate the cost of public pension systems (Boeri et al., Reference Boeri, Boersch-Supan and Tabellini2001, Reference Boeri, Boersch-Supan and Tabellini2002).
We focus on the impact of the second type of information on individual savings. We evaluate the French public policy of providing retirement information to individuals about their retirement savings. We examine outcomes after the pension information system has been introduced in France. To do so, we use the SHARE survey, which includes individuals belonging to households where at least one of the members has reached the age of 50. Individuals aged 55 and over since 2007 are the focus of the French retirement information policy. We exploit the conditions of a quasi-natural experiment owing to the progressive implementation of retirement information in France starting in 2007. In 2011, the system was fully implemented and we identify the few cohorts that received pension information – individuals born in 1955 and before – and those who had not yet received it (born in 1956 or after). We therefore use a strict discontinuity regression since only the year of birth determines the individuals to whom the information was sent.
The present article contributes to the literature by providing a public policy assessment that can accompany more structural reforms of pension systems. Clear, transparent, and well-understood information is essential for agents to make informed and rational decisions in the changing context of pension systems. We concluded that the pension statement sent to workers influences only the wealthiest. Savings for long-term investment is affected by pension information only in the highest quartile. The lowest quartile does not have any long-term assets, and pension information therefore has no impact. When considering financial assets, once again, the pension statement affects the amount held by the wealthiest. Having received the pension estimate increases this amount by 39–46% (depending on econometric specifications) on average among those in the highest quartile. We found no significant impact for those with the lowest levels of wealth. This conclusion is in line with part of the existing literature which indicates that households' cognitive resources are limited (Kahneman and Tversky, Reference Kahneman and Tversky2000; Beshears et al., Reference Beshears, Chois, Laibson and Madrian2008), even if they are well informed. In this case, personalized assistance to make effective use of information could be necessary. Our findings are quite alarming: This first evaluation of pension information in France suggests that the policy to encourage the most vulnerable households to save has failed to reach the target population. To start with, it will reinforce inequalities between the wealthiest individuals and those who are probably the least well-prepared for retirement. Second, the results demonstrate that providing information might not be sufficient: offering an adequate institutional framework for pension information is not enough.
The present paper is organized as follows: in Section 2, we present the literature on financial literacy and retirement-related savings to explain how the expected link between information and savings behavior is established. Section 3 briefly presents the case studied in this paper: the French pension information system. Sections 4 and 5 describe the database used, the Survey of Health, Ageing and Retirement in Europe (SHARE), and the methodology. The results are discussed in Section 6. We conclude in the last section.
2. Information, literacy, and expected retirement-related savings behavior
The literature on financial literacy developed rapidly over the last decade and contributed to our understanding of why households in many developed countries are not well prepared economically for retirement. Lusardi (Reference Lusardi2019), Lusardi and Mitchell (Reference Lusardi and Mitchell2011a, Reference Lusardi and Mitchell2011b, Reference Lusardi, Mitchell, Mitchell and Lusardi2011c) explain that some workers close to retirement did not even think about retirement, which is quite concerning, and tend to overestimate their pension benefits (Boeri et al., Reference Boeri, Boersch-Supan and Tabellini2001, Reference Boeri, Boersch-Supan and Tabellini2002; Dolls et al., Reference Dolls, Doerrenberg, Peichla and Stichnothb2018).
The theoretical corpus on financial literacy must be extended to examine why individual rationality might be bounded, thus preventing individuals from saving for their retirement. Only such an extended conceptual framework can lead to a clear understanding of why the role of pension information seems important and why it has been provided in Europe and in the United States over the past 25 years (Altman, Reference Altman2012).
Although the homo oeconomicus is supposed to be perfectly rational, Simon (Reference Simon1947) explained very early on that this rationality is bounded. First, individual preferences might be temporally inconsistent because of a strong preference for the present (Strotz, Reference Strotz1955): although households seem to be aware of the necessity to save for retirement, they do not. They agree that retirement-related saving is necessary as they would like to maintain their standard of living after they withdraw from the labor market, but they prefer to consume. Akerlof (Reference Akerlof1991) attributes such a behavior to a lack of imagination: individuals are subject to myopia. According to Laibson (Reference Laibson1996), impatience could also explain it (Arrondel et al., Reference Arrondel, Masson and Verger2004). This inconsistency appears because present costs are salient in comparison with future costs. Second, complexity in savings choices also reveals the possibly limited rationality of individuals. Beshears et al. (Reference Beshears, Chois, Laibson and Madrian2008) explained that decisions are biased since people tend to avoid more complicated choices.
Decision making can be improved with financial literacy that represents the ability to use information and to make appropriate financial decisions, including retirement-related savings decisions. Individuals with low levels of financial literacy do not have this ability and make temporally inconsistent decisions, suffer from cognitive bias, or do not even think about retirement planning. Several studies (Lusardi and Mitchell, Reference Lusardi and Mitchell2007a, Reference Lusardi and Mitchell2007b, Reference Lusardi and Mitchell2011a, Reference Lusardi, Mitchell, Mitchell and Lusardi2011c; Van Rooij et al., Reference van Rooij, Lusardi and Alessie2012; Lusardi, Reference Lusardi2019) report a lack of financial literacy and economic awareness preventing individuals from planning for retirement. According to Lusardi and Mitchell (Reference Lusardi, Mitchell, Mitchell and Lusardi2011c) financially informed individuals are not only more likely to plan their retirement, but they also invest more efficiently. Better-educated people have a better propensity to plan, are better able to control their spending, and consequently accumulate wealth more efficiently (Americks et al., Reference Americks, Caplin and Leahy2003). They are able to make long-term financial plans and secure their retirement income. The literature shows that in many countries, financial literacy is positively and highly correlated with the propensity to plan (Almenberg and Save-Soderbergh, Reference Almenberg and Save-Soderbergh2011; Bucher-Koenen and Lusardi, Reference Bucher-Koenen and Lusardi2011; Lusardi and Mitchell, Reference Lusardi and Mitchell2011b, Reference Lusardi, Mitchell, Mitchell and Lusardi2011c; Lusardi, Reference Lusardi2019), which ensures that households plan their retirement efficiently but these articles do not put forward any causality. Conversely, people lacking basic financial literacy or numeracy end up close to retirement with a low level of assets (Lusardi and Mitchell, Reference Lusardi and Mitchell2007a; Lusardi, Reference Lusardi2019) and tend to transact in a high-cost manner (Stango and Zinman, Reference Stango and Zinman2007).
This lack of basic knowledge leads Lusardi and Mitchell (Reference Lusardi and Mitchell2011b) to quite worrying conclusions. According to them, many respondents to the US National Financial Capability Survey are then exposed to poor financial decisions. Low-income earners and less educated people are the most vulnerable. Von Rooij et al. (Reference van Rooij, Lusardi and Alessie2012) highlighted little improvement in economic awareness and financial literacy between 2005 and 2010 despite several policy initiatives to increase financial knowledge in the Netherlands. In general, financial literacy has at least a positive impact on the probability of accumulating retirement-related wealth (Fornero and Monticone, Reference Fornero and Monticone2011; Klapper and Panos, Reference Klapper and Panos2011). In this context, improving financial literacy should be of primary concern for policy makers (Gale and Levine, Reference Gale and Levine2010) and information can be seen as a means. If the lack of financial literacy can be explained in the Simon theoretical framework of bounded rationality, public policy has a role to play in improving the decision-making environment. Providing better quality pension information in a straightforward fashion will improve financial decision making.
Making long-term financial decisions being very complex, it can be difficult even when individuals are educated. This calls into question the neoclassical theory which postulates that a rational individual always makes the best possible decisions given the information at their disposal. If individuals are not always able to make the best possible decisions (i.e., intertemporal calculations), consequently they make bad choices (CFA Institute, 2009), then the role of the policy maker is reaffirmed. In this context, public information (for instance through pension statements sent to the home) might at least assist in retirement and investment planning. Retirement information could improve the retirement knowledge of consumers and help them to adopt more appropriate behavior (Joo and Grable, Reference Joo and Grable2001). In the US, the social security statement greatly improved the knowledge of workers who did not contact the Social Security Administration (SSA) (Mastrobuoni, Reference Mastrobuoni2011). Sass (Reference Sass2015) confirmed that the US social security statement providing estimates of an individual's benefit adds value for workers by improving their pension knowledge. In Germany, Reference Dolls, Doerrenberg, Peichla and StichnothbDolls et al. arrived to the same conclusion: the pension letters have a significant and positive impact on the private retirement account.
Targeted programs addressing differences in household preferences and savings needs as well as financial and economic educational backgrounds could be effective ways to improve retirement planning among different socio-economic groups (Lusardi et al., Reference Lusardi, Mitchell and Curto2009). Searching for information is indeed costly for individuals. Financially distressed older individuals are less likely to seek pension information. They are more vulnerable as they tend to overestimate their future pensions and face a decrease in their standard of living. Free, customized information sent to the home allows the less educated and financially distressed consumers to be targeted.
In these various countries, it is observed that private pension funding requires long-term financial plans and pension information. From the literature, we may deduce that government pension information initiatives in many countries are headed in the right direction. By conveying information, they may increase public understanding, the functioning of private pension systems and foster household retirement savings.
However, Prast et al. (Reference Prast, Teppa and Smits2012) were quite critical about the effectiveness of measures to deliver pension information and underscore that this information is not sufficient to encourage individuals to make appropriate choices. It might be useful to provide clear information, but assistance to interpret it could be necessary if individuals are not able to make effective use of it.
For France, since 2010, there has been a survey called the ‘Retirement Motivations Survey’ to interview retirees shortly after their retirement rights have been settled. This survey assesses the level of information and measures the degree of knowledge which shaped the retirement decision. It is conducted and coordinated by the Directorate of Research, Studies, Evaluation and Statistics (DREES) and the Social Security Department (DSS), the National Insurance Plan for workers in private sector, and the Conseil Orientation des Retraites (COR). The survey shows that the insured read the information but it is not always understood. Indeed, the first evaluation showed that knowledge of insurance periods, an essential parameter in the decision to retire, remains imperfect. Comparing the self-reported data with the administrative files of the plans, around 30% report not knowing the insurance period(s). The same applies to the length of insurance required to receive a full pension: around 40% of the respondents indicated that they did not know this (Conseil d'Orientation des retraites, 2016).
Fernandes et al. (Reference Fernandes, Lynch and Netemeyer2014) carried out a meta-analysis of the relationship between financial literacy, financial education, and financial behavior in 168 papers covering 201 studies. They showed that financial education interventions have very little effect on financial behavior with weak effects in low-income samples. They point out that only 0.1% of the variance in financial behavior is due to financial literacy. In this context, following the behavioral economics of Kahneman and Tversky (Reference Kahneman and Tversky2000), changing the decision-making environment by providing information might not be enough to enhance the quality of financial decision making.
3. The French pension information system
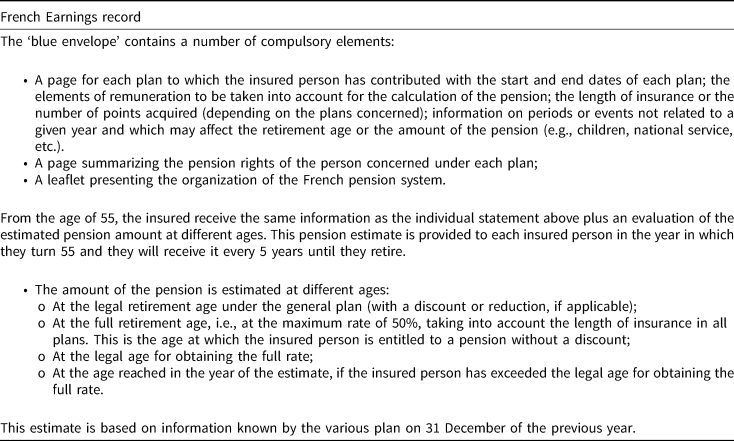
The French law to provide information on pensions was introduced with the 2003 pension reform. This law establishes the right of individuals to pension information. Implemented in August 2003, the law states: Each person has the right to obtain, in conditions specified by decree, a statement of their individual situation regarding all the rights that he/she has acquired in legally compulsory pension plans. The French public interest group Info Retraite provides detailed information on income to those over 35 (see Table 1). For those close to retirement age, they provide exhaustive information about an individual's pension situation at 55 in a document known as the Indicative Global Estimate (IGE) (in French, Estimation Indicative Globale, or EIG). It provides individuals with a detailed estimate of their future pension benefits as well as the earliest date at which they can expect to retire on a full pension (see Table 1). According to Info Retraite, the reason for providing these statements to all households is to ensure they have the necessary information to make adequate decisions about their retirement.
Summary of information available in the French pension statement (‘Blue Envelope’)

The implementation of the pension statements in France provides a natural experiment that can be used to test the effects of information provision on individual financial decisions.
The transition period for implementation of the pension information program began in 2007 and ended in 2010. Until 2011, implementation of the pension information system was progressive. At the end of the implementation period, the birth year 1955 constituted a cut-point in receiving the pension statement: individuals born between 1948 and 1955, still in work, had received their pension statement. Conversely, people born after 1955 had not received it. Data from the fourth wave of the SHARE appear particularly relevant to study this natural experiment.
4. Data and statistics
Detailed data from the SHARE is used. This survey takes place in a global context of demographic aging and provides rich economic and social information about individuals in households where at least one member reached the age of 50. It appears particularly well suited as we focus on the end of one's working life, and how actively people close to retirement behave, and more specifically save when they receive objective information about their own expected pension level.
SHARE is a multidisciplinary and cross-national panel database which includes socio-economic variables, but also detailed information on wealth and family for each respondent. The survey is conducted at regular intervals since 2004. It now comprises seven waves. The survey was launched in 11 countries in 2004. Today, 27 countries participate, including France. We chose the French part of the survey and used the fourth wave due to the year in which the data were gathered, 2011.
French data and the imputed table to obtain aggregated and imputed wealth variables are considered. This module has the advantage of not being affected by missing data thanks to the imputation procedure implemented in the survey (Christelis, Reference Christelis2011).
We needed to ascertain whether individuals were still in active work when they were supposed to receive their pension statement. French legislation states that the 1949 cohort received their estimates in 2007, 1950 and 1951 cohorts in 2008, 1952 and 1953 cohorts in 2009, and 1954 and 1955 cohorts in 2010. As the survey provides the retirement year, we excluded those who declared being retired on the dates above. Starting in 2011, the legal retirement age began to increase, gradually reaching 62 years in 2017. However, at the time of the survey, individuals aged 60 could still retire, thus explaining the very low number of 60-year-old observations still in active work. This is why we selected cohorts born from 1951 onward inclusive.
Our selection covers a sample of observations whose ages were close to the discontinuity to observe precisely whether the change in legislation had an impact on the generations affected compared with the generations who happened to be older but not affected by the reform. We restricted the bandwidth to observations that lie in close proximity to the cut-point and retained cohorts born between 1951 and 1960, particularly because we did not want to include individuals in our sample with very different savings behavior due to their age.
A local analysis of the discontinuity in two outcome variables at the cut-point described above was carried out. The first variable is the per capita household savings for long-term investmentFootnote 1, which includes individual retirement accounts, contractual savings, and life insurance. The second one is per capita household gross financial assets, i.e., the sum of bank accounts, stocks, bonds, and mutual funds, plus savings for long-term investment.
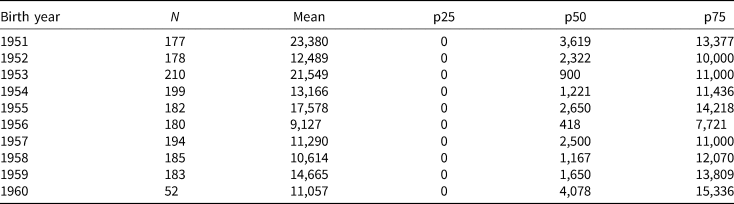
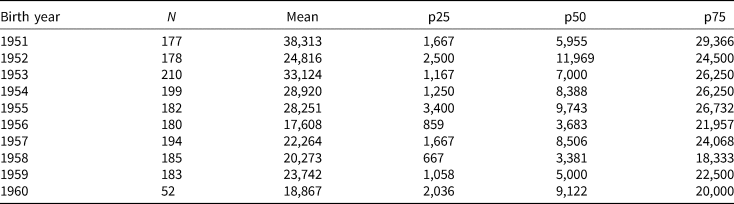
Tables 2 and 3 provide descriptive statistics for both outcome variables. First, we note that individuals in the lowest quartile of wealth distribution do not have any savings for long-term investments. For 612 observations, this variable is equal to 0. As is common with wealth variables, the median is far lower than the average value for both variables, indicating that some households have very high levels of wealth. In our sample, 953 individuals received a pension estimate, while 792 did not. Savings for long-term investment was 59% higher for the informed cohorts, and their total financial assets were almost 50% higher (see Table 4). These figures are strongly correlated with age, which must be controlled through further econometric analysis, developed in the next section.
Per capita household savings for long-term investment (in euros)

Source: SHARE, 4th wave.
Per capita household gross financial assets in 2010 (in euros)

Source: SHARE, 4th wave.
Average assets held by cohorts on both sides of the year threshold (euros)

Source: SHARE, 4th wave.
5. Methodology
5.1 Estimation procedure
The causal effect of the pension information program on the savings behavior of individuals in households with one member aged 50 or older is evaluated. Determining a causal link through the methodology used appears to be crucial in a field of literature where many studies emphasize only a correlation link between financial education and financial decisions (Lusardi and Mitchell, Reference Lusardi and Mitchell2011b; Lusardi, Reference Lusardi2019).
Implementation of the program created a discontinuity at age 56 in 2011. In this year, only cohorts from 1949 to 1955 had received a pension estimate. In 2011, being 56 or older implies having received information through the mail, therefore having been exposed to the treatment of pension information. This situation is consequently an application of the regression discontinuity (RD) design (Hahn et al., Reference Hahn, Todd and Van der Klaauw2001; Imbens and Lemieux, Reference Imbens and Lemieux2008; Lee and Lemieux, Reference Lee and Lemieux2010). Specifically, the example of a sharp RD method had to be considered, because depending on birth year, individuals were affected by the pension information reform, or were not. The gradual and transitory implementation of the reform required us to choose a local regression and a reduced cohort window in order to not increase the bias of the estimates. Our aim is to compare observations just below and just above the threshold age of 56 to determine if pension information already had an impact on holding behavior in 2011. We included individuals in the age bracket 51–60 in 2011 to have enough observations in the study sample. The treatment group consequently included individuals born between 1951 and 1955. Individuals born from 1956 to 1960 constituted the control group.
The RD method exploits a discontinuity in the treatment assignment to identify a treatment effect. In this case, the known discontinuity is due to the quasi-experimental situation implied by the progressive implementation of the economic policy. In sharp RD design, treatment assignment depends in a deterministic way on variable Z with a known discontinuity at point Z 0. The assignment of individuals to the treatment pension estimate mail is entirely age dependent. All people born between 1949 and 1955 are considered treated, while those born after 1955 are not. Consequently, two key assumptions were verified: the treatment assignment cannot be manipulated by the individual, and spill-over effects of the treatment are not possible.
Let p i denote the indicator for assignment to the pension information treatment, the rule is then:

where Z i is the birth year of individual i and Z 0 the threshold, fixed at 1955Footnote 2.
This empirical approach exploits the discontinuity in available information at age 56 in 2011. We were interested in seeing if receiving the pension estimate had a significant impact on different wealth variables denoted Y. We analyzed both savings for long-term investment, and gross financial assets (in log). Let Y 1 represent the potential outcome if the individual receives the treatment, i.e., the pension information, and Y 0 the potential outcome if they do not receive it. The objective is to estimate the average treatment effect at the threshold Z 0. This average treatment effect (ATE) can be expressed as: ATE = E[Y 1 − Y 0|Z = Z 0].
When the support of Z is continuous, non-parametric and semi-parametric procedures for estimation are appropriate (Hahn et al., Reference Hahn, Todd and Van der Klaauw2001; Porter, Reference Porter2003). However, when the support of Z is discrete, taking J distinct values, Lee and Card (Reference Lee and Card2008) showed that parametric methods are preferred.
Identification of the ATE can be achieved by estimating the following regression function:

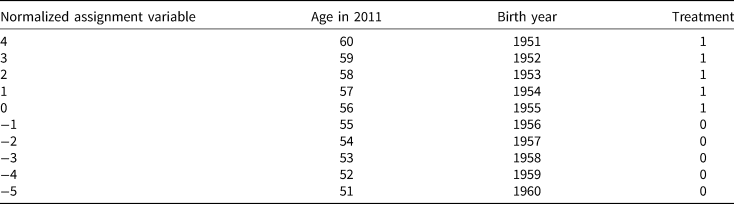
where h(.) is a continuous function capturing the cohort effect on the outcome variable, p j = 1[z j ≥ 0]. The assignment variable Z, here the birth year, is normalized so that the discontinuity point is represented by z j = 0. Therefore, z j = 1955 − birth year. The link between birth year, age, and the assignment variable is summarized in Table 5.
Assignment variable

The key identification assumption is the continuity of h(.). With specification (2), and under this assumption, the treatment effect β 0 is obtained by estimating the discontinuity in the empirical regression at the point where treatment switches from 0 to 1, in our case at age 56, when the birth year is 1955. Introducing covariates (X), equation (2) can also be expressed as:

In (3), Y ij is the wealth variable for the i individual, born in year j, i.e., the value of the assignment variable Z. The hypothesis that h(.) is smooth implies that, controlling for other characteristics, receipt of pension information (i.e., the treatment) is the only source of discontinuity in the wealth variable at age 56. It is common practice to regress Y ij on h(.) assuming it is a low order polynomial function. If the polynomial function assumed is correct, conventional least squares inference is appropriate (Lee and Card, Reference Lee and Card2008). Three different forms are assumed for h(.): a linear form, a spline linear, and a quadratic function.
After suggesting a classic ordinary least squares estimate for equation (2), given the distribution of our data, we propose quantile regressions (Koenker and Bassett, Reference Koenker and Bassett1978) to obtain full characterization of the conditional distribution of the dependent variable. Table 2 shows that indeed a large proportion of the sample does save for the long term. We can deduce from these statistics that distribution effects are particularly important with wealth variables. In accordance with the abundant literature on financial literacy, we were concerned that only a part of the population can understand and use pension information. For these reasons, we estimated the treatment effect for the following quantiles: the 25th percentile, the median, and the 75th percentile.
Two subsamples were then created to target cohorts closer in age to assess the robustness of our estimates. The first subsample, referred to as discontinuity sample 1 (DS1) includes cohorts from 1952 to 1958. Cohorts from 1956 to 1958 constitute the control group. The second subsample, referred to as DS2, includes cohorts from 1953 to 1957. Once again, those born in 1956 and 1957 are the control cohorts. This process could enable the comparison of individuals with even more similar accumulation behavior, and reduce the potential bias in the estimate. However, in selecting these cohorts, we also excluded observations and constrained the size of our sample. Discontinuity sample 1 includes 1302 observations while DS2 includes only 951 observations.
5.2 Variables
To investigate the impact of pension information on different wealth variables, control variables are considered such as educational attainment for the individual and their partner (years of education and partner's years of education), household composition (marital status and the number of children in the household), and per capita household disposable income to investigate the impact of pension information on different wealth variables. Dummy variables indicate whether the respondent is self-employed, retired, or a homeowner. An additional dummy enables capturing of health effects if the individual declared being limited in their daily activities. We did not include any age variables as the function h(.) does. Different forms for h(.) being assumed, we revealed a possibly non-linear effect of age on wealth. As suggested in von Rooij et al. (Reference van Rooij, Lusardi and Alessie2012), a polynomial for the logarithm of per capita disposable household income with a linear, quadratic, and cubic term was included, enabling the capture of a potential non-linear effect of income on wealth accumulation.
Finally, we introduced an inheritance variable. Inherited wealth is indeed a source of inequalities in the long run (Piketty and Zucman, Reference Piketty and Zucman2015). In France, individuals inherit at the age of 52 on average, precisely within the range of ages that we studied. The binary variable of inheritance reveals if the household ever received an inheritance of 5,000 euros or more. Inherited wealth might be correlated with the social and economic background of each family. For this reason, we also introduce a crossed variable of inheritance and income to control for the risk of multicollinearity.
5.3 Graphical analysis
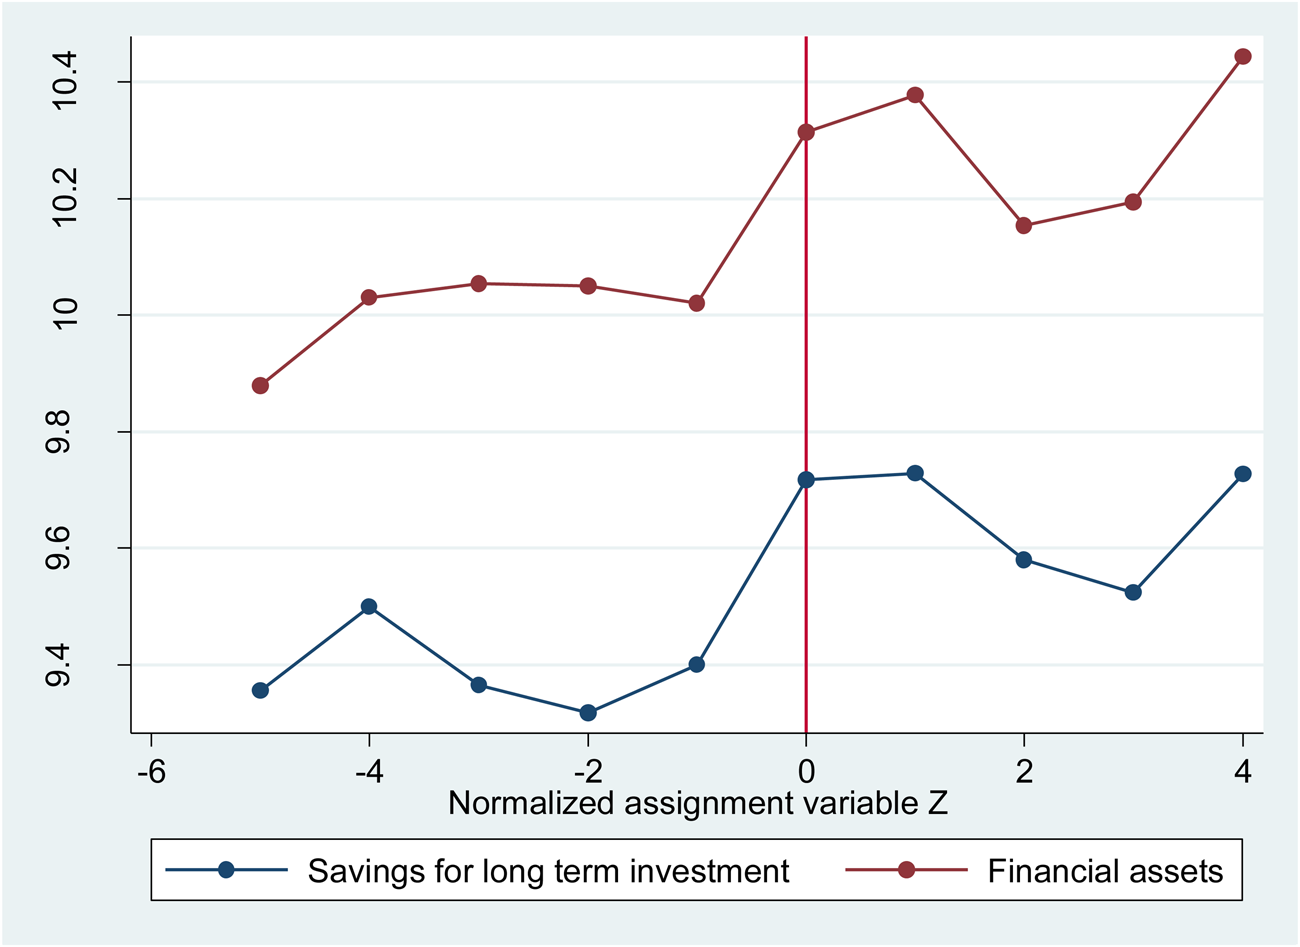
In case of discreteness of the assignment variable, Lee and Lemieux (Reference Lee and Lemieux2010) recommend computing and plotting the mean of the outcome variable for each value of the discrete assignment variable. Figure 1 displays an initial approach to the discontinuity analysis and summarizes the mean per capita household wealth and values of the assignment variable z j. A negative value for z j indicates that individuals did not receive their pension estimate. Conversely, if z j ≥ 0, individuals were treated.
Mean amounts held, by assignment variable Z.
Source: SHARE, 4th wave.

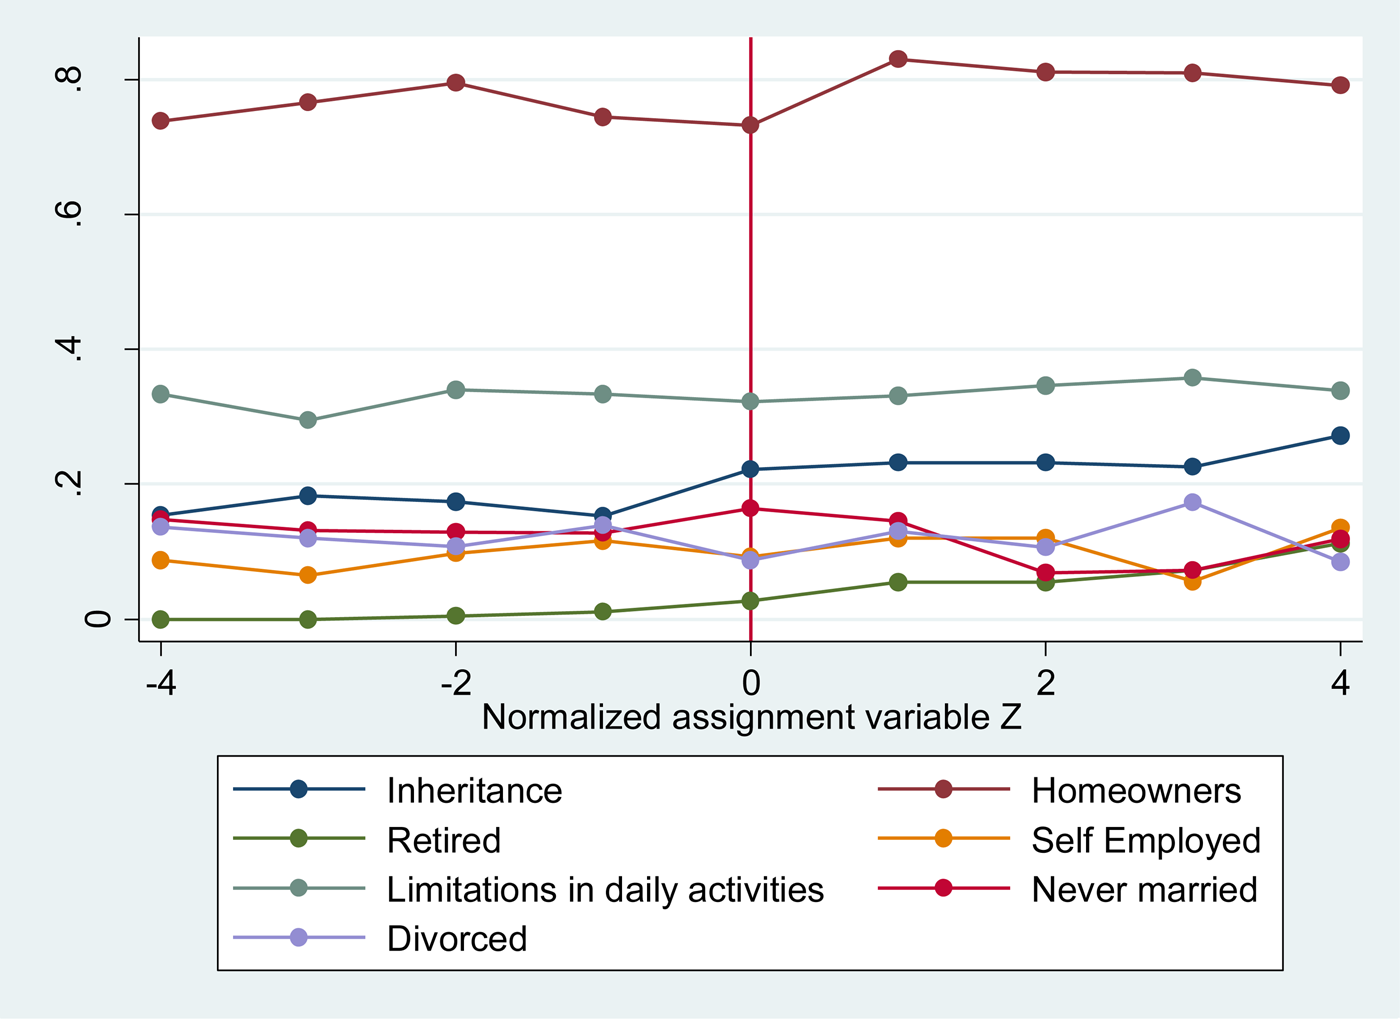
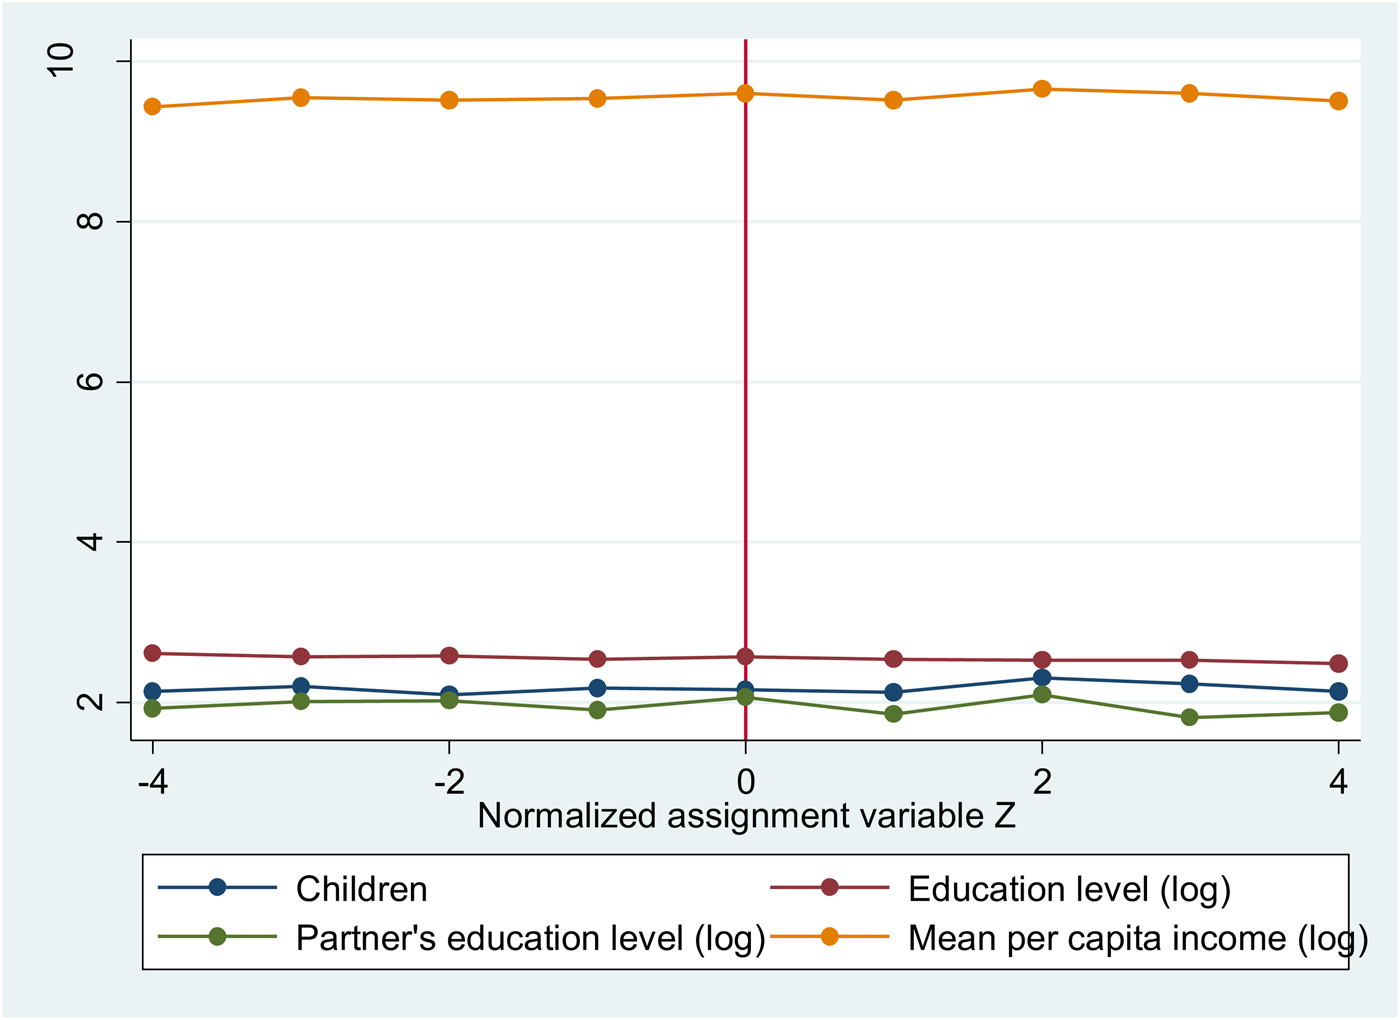
The vertical red line represents the discontinuity, the point where the treatment switches from 0 to 1. It seems difficult to draw conclusions from a graphical analysis only. However, we note that mean values of financial assets and savings for long-term investments appear to grow with age (i.e., with z j), with a possible visual jump at point z j = 0. In addition, RD designs require all other covariates to be continuous at the point of discontinuity. Figures 2 and 3 report the mean variables according to age (specifically, according to the assignment variable). We see that these variables appear to be fairly continuous within the age range that we are interested in. The graphical analysis gives us confidence about the relevance of the methodology.
Evolution of covariates according to the assignment variable (1).
Source: SHARE, 4th wave.

Evolution of covariates according to the assignment variable (2).
Source: SHARE, 4th wave.

6. Results
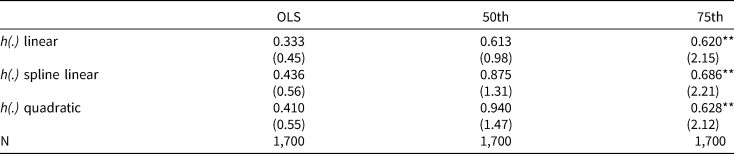
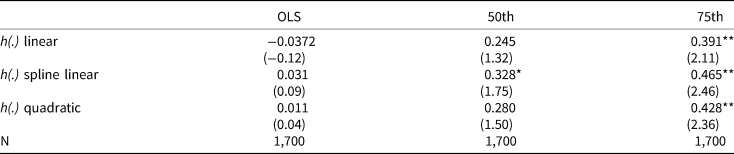
Treatment effects for the total sample are reported in Tables 6 and 7Footnote 3. The second column lists the average treatment effect on the total sample. The following columns give the treatment effect on the median and the 75th percentile respectivelyFootnote 4. Results are reported by functional form assumed for h(.). We did not detect any impact of pension estimate provision on mean savings for long-term investment nor mean financial assets held. However, quantile regressions reveal a differentiated impact of pension information on wealth distribution. While there is no impact on the lowest percentiles, the wealth stock of the richest seems to be affected. The impact is much stronger on wealth held for long-term investment.
Treatment impact (β_0) on savings for long-term investment (log)

*p < 0.1, **p < 0.05, ***p < 0.001.
Treatment impact (β_0) financial assets (log)

*p < 0.1, **p < 0.05, ***p < 0.001.
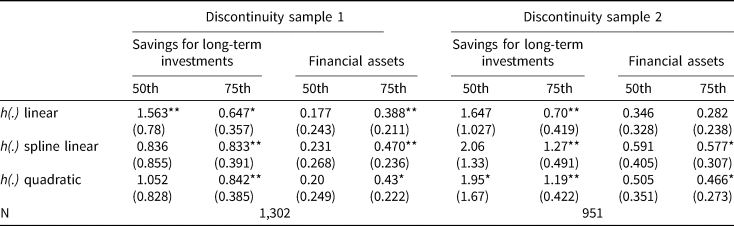
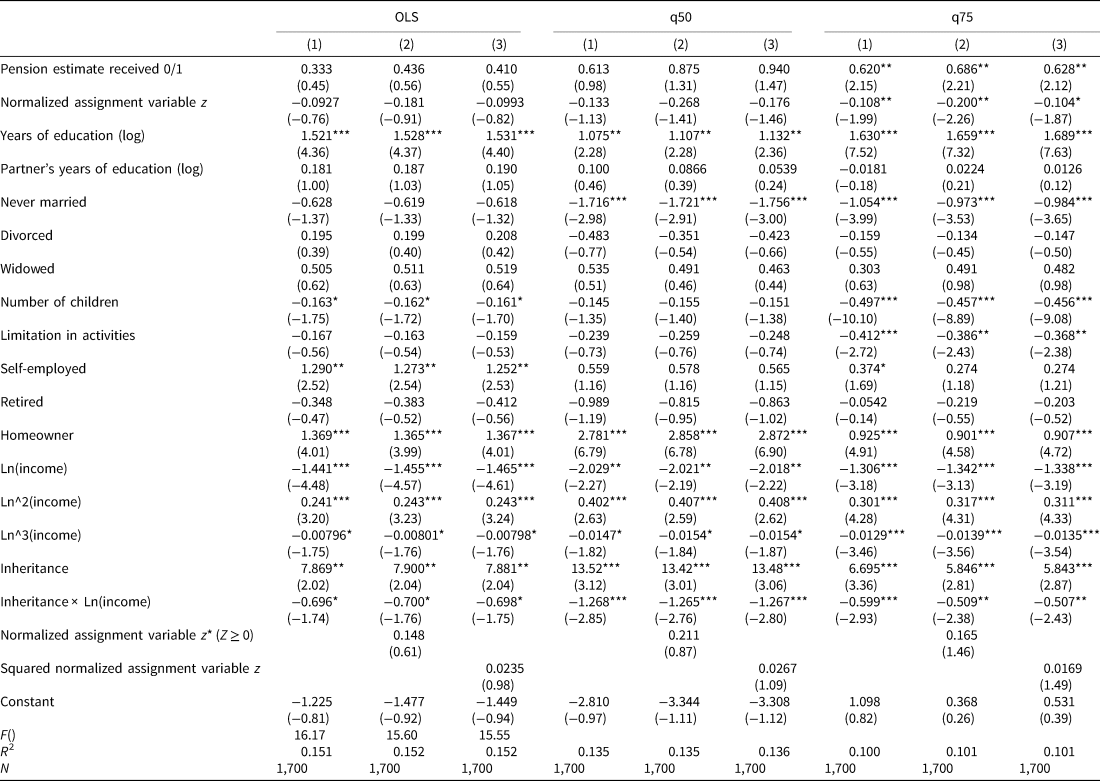
Receiving a pension statement has a significant impact on the 75th percentile: the impact evolves from 0.62 to 0.69 according to different functional forms of h(.) (see Table 6). The impact displayed with the use of the discontinuity sample is stronger (see Table 8), showing that we do not capture an age effect only after controlling for age.
Treatment impacts with discontinuity samples

t statistics are reported in parentheses.
*p < 0.1, **p < 0.05, ***p < 0.001.
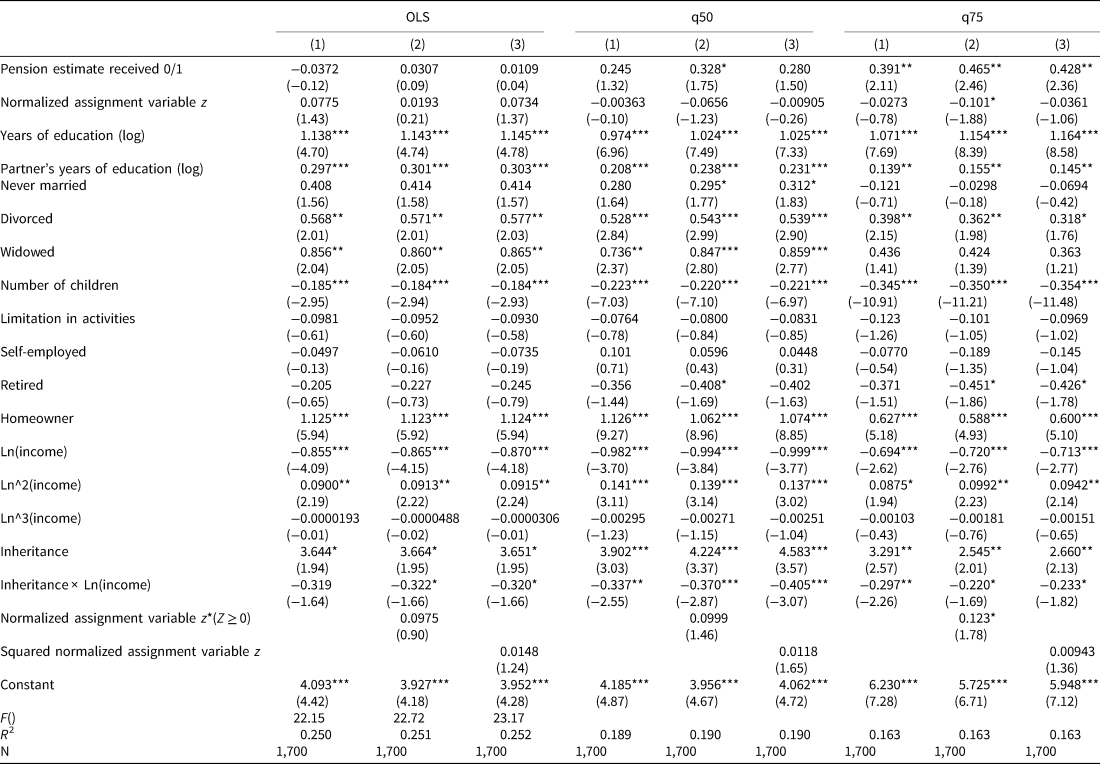
An effect on median individual long-term wealth is even detected when using the discontinuity samples. Once again, estimating financial wealth with OLS and an RD does not show any significant impact, whatever the form assumed for h(.) (see Table 7). However, allowing for a possibly differentiated impact by percentile shows that the wealthiest behavior is affected by the receipt of pension information. A robust impact on financial wealth is detected for the 75th percentile. We note an elasticity comprised between 0.39 and 0.46 depending on the form of h(.) for the highest quartile of the distribution.
Part of the population reacts to pension information by increasing private savings. As the impact is stronger for long-term savings, we assume that some people adjust their level of wealth with appropriate assets for retirement as a priority. Having an increasing retirement horizon also implies more long-term uncertainty. However, our results also show that only those who already have the highest levels of wealth seem to be affected. This population is also the most aware of the long-term issues and challenges for the pension system. The significant impact of the education variable, capturing financial literacy in our regressions, confirms that knowledge is the key variable determining long-term wealth accumulated (Americks et al., Reference Americks, Caplin and Leahy2003; Almenberg and Save-Soderbergh, Reference Almenberg and Save-Soderbergh2011; Arrondel et al., Reference Arrondel, Masson and Soulat2013).
The impact of the provision of pension information being the greatest for the wealthiest households might lead to greater inequalities. Such a policy encourages the richest households to accumulate more for retirement, but not households with income in the lower percentiles. In other words, pension information does not appear to motivate those who most need to adapt to the decrease in their public pension. Thus, information provision does not represent effective policy. The policy fails to achieve its main purpose. There are many reasons for this:
-
– Households with the lowest levels of wealth are not able to increase their savings, even if they have clear information on the amount of pension they will be entitled to.
-
– Those at the bottom of the wealth distribution are also those who can expect a high replacement rate in France: as a consequence, they cannot be surprised by the pension evaluation received, and can therefore choose not to change their savings behavior.
-
– Individuals might not have a sufficient level of financial literacy and not make effective use of the information received. In this case, increasing the efficiency of this policy regime fundamentally requires increasing the capacity to make effective use of the information provided. Currently, those who already have a high level of wealth appear to be able to translate the information provided into a financial decision.
7. Conclusion
In this research study, it has been demonstrated that receipt of a pension information statement in France is associated with a significant increase in wealth accumulation for high-wealth individuals. This finding is an important contribution to the pension literature as we provide an evaluation of public policies that can lead to more structural reforms of pension systems. Taking advantage of the progressive implementation of economic policy which created the conditions for a quasi-experiment, and thanks to availability of data, we were able to evaluate whether changes in wealth are due to the introduction of the pension information, and to shed light the relationship between a particular aspect of financial awareness: pension information and savings behavior. However, it is emphasized a significant positive pension information impact on accumulation only on the highest part of the wealth distribution. With an elasticity for information between 0.62 and 0.67 for the 75th percentile, the impact on long-term savings is much stronger than on financial assets. The elasticity of financial wealth to pension estimate is assessed between 0.39 and 0.46 for households within the 75th percentile of wealth.
One can conclude that pension statements reinforce the long-term savings of those who already hold the highest levels of wealth but those with the lowest levels of wealth are not affected by the policy. Current measures to convey information to households therefore tend to reinforce inequalities between those who have already saved privately and were also probably the most well-informed and the most financially educated, and those with the lowest levels of wealth. The latter are the least informed and the least financially educated. The policy fails to reach them. We also fear that this population, even if it is aware of the necessity to increase retirement-related wealth, will not be able to do this. Consequently, the pension information system, such as in France following the 2003 reform, had perverse effects. Our result confirms that providing information might not be sufficient to influence behavior in the manner intended by the policy. Making effective use of information also probably requires personalized assistance. For this reason, we conclude that provision of information cannot guarantee the effectiveness of public policy.
Estimates of savings for long-term investment (log)

t statistics are reported in parentheses – (1) h(.) linear, (2) h(.) spline linear, (3) h(.) quadratic.
*p < 0.1, **p < 0.05, ***p < 0.001.
Estimates of financial assets (log)

t statistics are reported in parentheses – (1) h(.) linear, (2) h(.) spline linear, (3) h(.) quadratic.
*p < 0.1, **p < 0.05, ***p < 0.001.