Introduction
Uranium dioxide (UO2) is the primary nuclear fuel form in light water reactors [Reference Wiss and Konings1]. The thermal transport properties of UO2 play vital roles in the thermal energy conversion efficiency and nuclear energy safety. In reactors, radiation and fission create many point defects and fission products in the fuels. Their aggregation leads to the formation of complex microstructures, including high burnup structure [Reference Rondinella and Wiss2], intragranular and intergranular gas bubbles [Reference Stehle3, Reference Kashibe, Une and Nogita4], metallic precipitates [Reference Muromura, Adachi, Takeishi, Yoshida, Yamamoto and Ueno5], and dislocation loops [Reference He, Pakarinen, Kirk, Gan, Nelson, Bai, El-Azab and Allen6]. These microstructures can reduce the fuel thermal conductivity significantly [Reference Ronchi, Sheindlin, Staicu and Kinoshita7]. However, sometimes microstructural evolution can recover the thermal conductivity if it removes the point defects. For example, the formation of high burnup structures can improve the thermal conductivity in irradiated UO2 [Reference Rondinella and Wiss2]. Therefore, understanding how the radiation-induced defects and microstructures influence the thermal conductivity of UO2 is critical for predicting fuel performance.
To date, the most widely used semiempirical thermal conductivity model for unirradiated UO2 was developed by Fink [Reference Fink8], which was fitted to many experimental data and normalized to 95% of theoretical density. The model correctly captures the phonon-dominant thermal transport behavior at intermediate temperatures and includes the additional polaron contribution at high temperatures. In terms of radiation effects, researchers have used computer modeling to study the effects of point defects and microstructures on the thermal transport properties of UO2 from atomistic to mesoscale [Reference Liu, Stanek and Andersson9, Reference Tonks, Liu, Andersson, Perez, Chernatynskiy, Pastore, Stanek and Williamson10, Reference Liu, Cooper, McClellan, Lashley, Byler, Bell, Grimes, Stanek and Andersson11, Reference Bai, Tonks, Zhang and Hales12, Reference Lee, Chernatynskiy, Shukla, Stoller, Sinnott and Phillpot13]. At the atomic scale, molecular dynamics (MD) simulation method has been widely used to study the phonon scattering effects induced by point defects, small defect clusters, and extended defects. Liu et al. [Reference Tonks, Liu, Andersson, Perez, Chernatynskiy, Pastore, Stanek and Williamson10, Reference Liu, Cooper, McClellan, Lashley, Byler, Bell, Grimes, Stanek and Andersson11] have used MD simulations to quantify the phonon scattering effects on the thermal conductivity of UO2 induced by different types of point defects, including dispersed xenon (Xe). The results have been integrated into Fink’s analytical model [Reference Fink8] to predict the degradation of thermal conductivity at different defect concentrations [Reference Tonks, Liu, Andersson, Perez, Chernatynskiy, Pastore, Stanek and Williamson10]. Deng et al. [Reference Deng, Chernatynskiy, Shukla, Sinnott and Phillpot14] have studied the effect of dislocations on the thermal conductivity of UO2 and found that the effect is small unless the dislocation density is very high. Chen et al. [Reference Chen, Chen, Sencer and Shao15] have calculated interface thermal resistance (Kapitza resistance) of various grain boundaries in UO2 and found that the Kapitza resistance correlates with the grain boundary energy. Lee et al. [Reference Lee, Chernatynskiy, Shukla, Stoller, Sinnott and Phillpot13] have studied the effect of helium bubbles on the thermal conductivity of UO2. The results showed that helium resolution from bubbles to fuel matrix can cause additional reduction in thermal conductivity. At the mesoscale, the effects of different microstructures and their topology on the thermal conductivity of UO2 have been studied. Millett et al. [Reference Millett and Tonks16] have found that the alignment of gas bubbles at grain boundaries causes more thermal conductivity reduction than randomly distributed bubbles in UO2. Recently, Bai et al. [Reference Bai, Tonks, Zhang and Hales12] have shown that the consideration of the topology of microstructures alone in mesoscale modeling may not be sufficient to capture some important thermal transport behavior in UO2. By including the atomistic-level phonon scattering effects induced by dispersed Xe in the UO2 matrix [Reference Tonks, Liu, Andersson, Perez, Chernatynskiy, Pastore, Stanek and Williamson10], the work correctly explains why small-grain high burnup structures can have a higher thermal conductivity than the large-grain counterparts [Reference Bai, Tonks, Zhang and Hales12]. Mesoscale modeling can also quantitatively predict the effective thermal conductivities of heterogeneous microstructures that contain dispersed Xe, gas bubbles, grain boundaries, etc. [Reference Tonks, Liu, Andersson, Perez, Chernatynskiy, Pastore, Stanek and Williamson10, Reference Bai, Tonks, Zhang and Hales12]. It has been shown that the microstructure-based thermal conductivity model developed from mesoscale modeling can improve the engineering level fuel performance modeling significantly [Reference Tonks, Liu, Andersson, Perez, Chernatynskiy, Pastore, Stanek and Williamson10]. Therefore, it is important to understand the effects of small defects/clusters and large microstructures on the thermal conductivity of UO2 at both atomic scale and mesoscale.
Fission gases (e.g., Xe, Kr) are expected to have significant effects on the degradation of the thermal conductivity of UO2 [Reference Staicu and Konings17]. These inert fission gases are insoluble in UO2 and tend to precipitate as intergranular and intragranular bubbles [Reference Agarwala18]. In addition, fission gas atoms can be trapped by defects or defect clusters and become dispersed fission gas atoms in the UO2 matrix. MD calculations have shown that Xe atoms are likely to occupy the Schottky defect sites [one uranium vacancy (VU) and two nearest oxygen vacancies (VO)] [Reference Moore, René Corrales, Desai and Devanathan19]. Xe may also stay at O vacancy, U vacancy, UO divacancy, and octahedral interstitial sites, depending on the stoichiometry of UO2 [Reference Andersson, Perriot, Pastore, Tonks, Cooper, Liu, Goyal, Uberuaga and Stanek20]. Some nonstoichiometric clusters such as octahedron cluster (6VU:8VO) are found to be stable [Reference Andersson, Perriot, Pastore, Tonks, Cooper, Liu, Goyal, Uberuaga and Stanek20], so that they may become nucleation sites for Xe bubbles. Cluster size larger than the octahedron cluster may be considered as small bubbles (r > 0.5 nm), which involves surface diffusion around the bubble surface [Reference Andersson, Perriot, Pastore, Tonks, Cooper, Liu, Goyal, Uberuaga and Stanek20]. In analytical modeling, gas bubbles are typically treated as empty voids [Reference Maxwell21, Reference Olander22]. Many theoretical models, such as Loeb equation [Reference Olander22] and Maxwell–Eucken equation [Reference Maxwell21], have been proposed to describe the correlation between thermal conductivity and porosity. However, the thermal conductivity reduction in these models only depends on porosity regardless of void size and distribution. These models may be valid for large voids whose size and spacing are much larger than the phonon mean free path (approximately a few nanometers in UO2). When void size and their spacing are comparable with the phonon mean free path, the phonon scattering effect induced by the void surface cannot be neglected. To include the void size effect, Alvarez’s model [Reference Alvarez, Jou and Sellitto23] has been developed as a function of bubble size, phonon mean free path, and total porosity. The model predicts that at a given porosity, the thermal conductivity increases with void size initially and then reaches a saturated value beyond the critical void size. By comparing with the Maxwell–Eucken equation [Reference Maxwell21], Tonks et al. [Reference Tonks, Liu, Andersson, Perez, Chernatynskiy, Pastore, Stanek and Williamson10] have theoretically estimated that the critical void radius is about 5 nm. When voids are filled with gas to form bubbles, intuitively the effective thermal conductivity may increase slightly because the gas in bubbles can contribute to the thermal conduction [Reference Bai, Tonks, Zhang and Hales12], even though the thermal conductivity of gas is very low. In other words, Alvarez’s model may be applied to gas bubbles. However, Lee et al. [Reference Lee, Chernatynskiy, Shukla, Stoller, Sinnott and Phillpot13] have used MD simulations to show that helium bubbles can cause more thermal conductivity reduction than empty voids and the reduction increases with the increasing helium density in bubbles. The reason is that some helium atoms can diffuse from the bubbles into the surrounding UO2 matrix. Therefore, they concluded that the helium resolution from bubbles can cause additional phonon scattering effect. Since the atomic size of helium is small, the gas resolution process may take place easily. However, such a gas resolution process may not happen in Xe bubbles because Xe has a very high solution energy in UO2 [Reference Murphy, Chartier, Van Brutzel and Crocombette24, Reference Jackson and Catlow25, Reference Jackson and Catlow26]. Moreover, the atomic size of Xe is large and comparable with that of uranium. Since Xe is the primary gaseous fission product in UO2 fuels and the size of intragranular bubbles is typically about a few nanometers [Reference Kashibe, Une and Nogita4, Reference Turnbull27], it is of great interest to investigate whether small Xe bubbles can cause additional thermal conductivity reduction compared with voids. To our best of knowledge, such effect has not been demonstrated to date.
In this work, we examine the effect of Xe bubbles on the thermal conductivity of UO2 at different Xe bubble sizes. To compare the results, empty voids of the same sizes are also studied. In these studies, the total porosity is fixed, so that the effect of bubble/void size and separation on the thermal conductivity can be elucidated. For a given Xe bubble size, the Xe:VU ratio in the bubble is also varied to change the bubble pressure. The goal is to understand how the bubble size, Xe:VU ratio, and the bubble pressure affect the thermal conductivity of UO2. The results may help the development of science-based models to better predict the thermal conductivity degradation due to the presence of Xe bubbles.
Simulation method
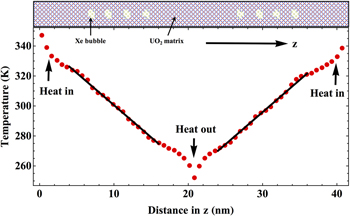
Non-equilibrium molecular dynamics (NEMD) method was used to calculate the thermal conductivities of a UO2 system that contains voids or Xe bubbles. The NEMD simulation method is also called “direct method,” which has been widely used to calculate the thermal conductivities and interface thermal resistances in materials [Reference Chernatynskiy, Bai and Gan28, Reference Schelling, Phillpot and Keblinski29, Reference Müller-Plathe30]. All simulations were conducted using LAMMPS software [Reference Plimpton31]. The primary simulation system contains 6 × 6 × 75 UO2 unit cells with the longest length along the z direction, as shown in Fig. 1. Therefore, the system contains 10,800 uranium atoms and 21,600 oxygen atoms before any voids or Xe bubbles are introduced. Periodic boundary conditions were employed in all directions. Different from Lee et al.’s helium bubble work [Reference Lee, Chernatynskiy, Shukla, Stoller, Sinnott and Phillpot13], in which only a single bubble was modeled in each simulation, in our work the primary simulation system contained multiple voids or Xe bubbles while the total porosity was fixed at p = 2% (Fig. 1). Using this approach, the size effect of bubbles or voids on the thermal conductivity reduction can be compared fairly at the same porosity. To maintain the charge neutrality of the simulation system, the removed uranium and oxygen atoms in each void/bubble had the ratio of U:O = 1:2. The largest void/bubble radius was about 1 nm, in which 108 uranium and 216 oxygen atoms were removed. The smallest vacancy cluster created in this work contains one uranium vacancy and two oxygen vacancies (1VU + 2VO) or one Schottky vacancy cluster. Strictly, small clusters cannot be called as voids or bubbles. Here we call all these defect clusters as voids or bubbles simply for convenience. To describe the Xe content in a bubble, the ratio of the number of Xe atoms in a bubble to the number of vacant uranium sites (i.e., Xe:VU ratio) is used. For example, if all the uranium sites in a bubble are occupied by Xe, Xe:VU = 1.
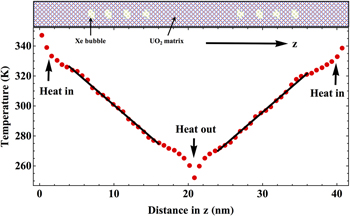
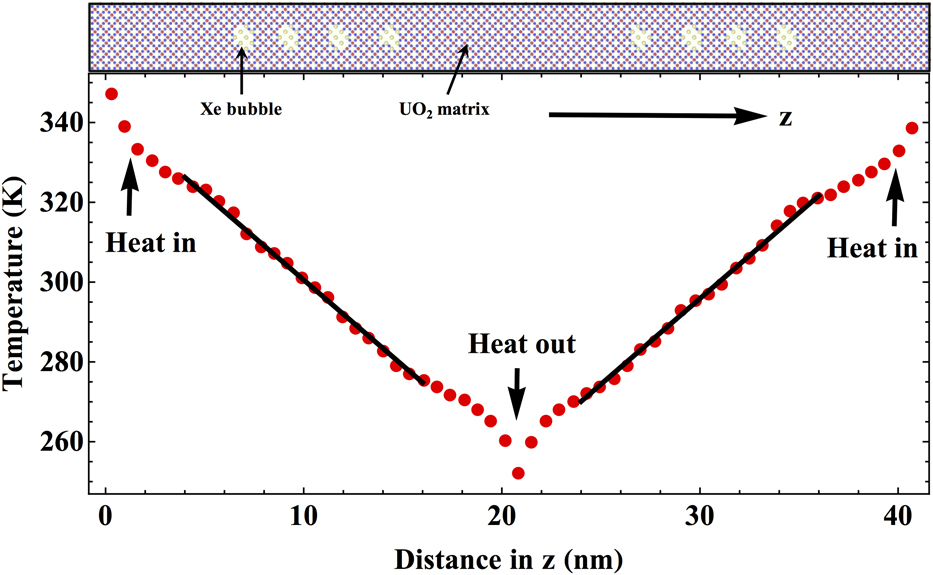
Illustration of the NEMD method (“direct method”) for calculating the thermal conductivity in a UO2 system containing multiple Xe bubbles. The filled red circles represent the temperatures calculated by MD along the z direction of the simulation box. The black solid lines show the two linear fitting ranges along the temperature profile.
The commonly used Basak potential [Reference Basak, Sengupta and Kamath32] was mainly used to describe the interatomic interactions in pure UO2. In the Basak potential, the interaction energy between ions i and j at a distance of r ij has the form,
 $$V\left( {{r_{ij}}} \right) = {1 \over {4\pi {\varepsilon _0}}}{{{q_i}{q_j}} \over {{r_{ij}}}} + \left[ {{A_{ij}}{{\rm{e}}^{\left( {{{ - {r_{ij}}} \over {{\rho _{ij}}}}} \right)}} - {{{C_{ij}}} \over {r_{ij}^6}}} \right] + {D_{ij}}\left[ {{{\rm{e}}^{ - 2{\beta _{ij}}\left( {{r_{ij}} - r_{ij}^0} \right)}} - 2{{\rm{e}}^{ - {\beta _{ij}}\left( {{r_{ij}} - r_{ij}^0} \right)}}} \right]\quad ,$$
where the first term is the Coulombic term, q i and q j are the ionic charges of ions i and j, respectively (here, q U = 2.4, q O = −1.2), and ε0 is vacuum permittivity; the second term is the Buckingham term with A ij, ρij, and C ij being the Buckingham potential parameters; and the last term is the Morse term with D ij, βij, and  $r_{ij}^0$ being the Morse potential parameters. The potential parameters are listed in Table I (note the parameters in the original paper [Reference Basak, Sengupta and Kamath32] are not fully correct). For describing Xe interaction with UO2, the interatomic potential developed by Geng et al. [Reference Geng, Chen, Kaneta and Kinoshita33] was used for describing the U–Xe, O–Xe, and Xe–Xe interactions. In Geng’s potential, the U–Xe interaction is described by
 ${{\rm{V}}_{{\rm{U}} - {\rm{Xe}}}}\left( {{r_{ij}}} \right) = {A_{ij}}{{\rm{e}}^{\left( {{{ - {r_{ij}}} / {{\rho _{ij}}}}} \right)}}$, which is similar to the Buckingham potential but without the C ij term. The O–Xe and Xe–Xe interactions are described by the Lennard-Jones (LJ) potential:
 $${V_{{\rm{LJ}}}}\left( {{r_{ij}}} \right) = 4\varepsilon \left[ {{{\left( {{\sigma \over {{r_{ij}}}}} \right)}^{12}} - {{\left( {{\sigma \over {{r_{ij}}}}} \right)}^6}} \right]\quad ,$$
where ε and σ are LJ potential parameters. All the Xe-related potential parameters are also listed in Table I. The majority of the results in this work were obtained from the Basak + Geng potentials. For some special clusters (octahedron clusters), the embedded atom function potential developed by Cooper et al. [Reference Cooper, Kuganathan, Burr, Rushton, Grimes, Stanek and Andersson34, Reference Cooper, Rushton and Grimes35] was used. To avoid confusion, this potential is briefly introduced in the context of that result.
Potential parameters of Basak potential [Reference Basak, Sengupta and Kamath32] for pure UO2 and Geng’s potential [Reference Geng, Chen, Kaneta and Kinoshita33] for Xe–UO2 interactions. The charges for U and O are q U = 2.4 and q O = −1.2, respectively.

In most of the simulations, the thermal conductivities were calculated at 300 K. To study the temperature effects, temperatures up to 1500 K were also used. Since the main goal of this paper is to study the effect of Xe and its clusters on thermal conductivity reduction, the results at 300 K were used as examples to demonstrate the effect. In addition, the thermal conductivity of pure UO2 predicted by the Basak potential at 300 K is available [Reference Chernatynskiy, Flint, Sinnott and Phillpot36] to verify our simulation method. The time step was 2 femtoseconds (fs) in all simulations. Initially, the system was equilibrated in an NPT ensemble (constant number of atoms, pressure, and temperature) at 300 K and zero external pressure for 40 picoseconds (ps). Next, the NEMD simulation was conducted in a constant volume system without a thermostat. The simulation box was divided into 60 slices along the z direction. Heat input was imposed on the first slice and heat removal was applied at the middle slice along the z direction using a fixed heat flux. The local temperature of each slice was calculated, so that a temperature profile along the z direction can be obtained. Because of the employment of periodic boundary conditions, two nearly identical thermal gradients were established in the system, as shown in Fig. 1. After the system reached the steady state, the temperature profiles were averaged over about 1.6 nanoseconds (ns). The thermal conductivity k was calculated based on the Fourier’s law:
 $$J = - k{{{\rm{d}}T} \over {{\rm{d}}z}}\quad ,$$
where J is the heat flux imposed in the system and dT/dz is the resulting temperature gradient. Here, the heat flux for establishing one thermal gradient was 37.2 GW/m2. To calculate the temperature gradient, a linear fit of the temperature profile within an appropriate fitting range was conducted for each gradient, as shown in Fig. 1. The dT/dz in Eq. (3) was the average of the slopes of the two thermal gradients.
Results and discussion
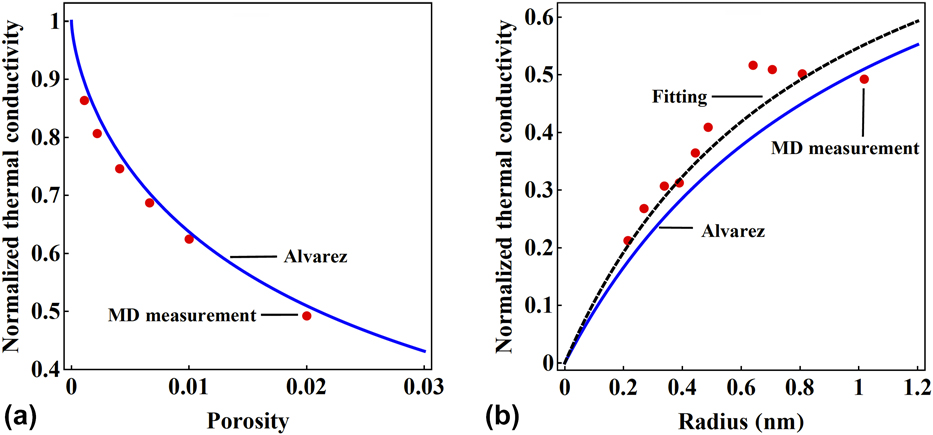
First, the thermal conductivity reduction due to empty voids at 300 K was calculated. The results were used as references for later studies of the effect of Xe-filled bubbles on the thermal conductivity reduction. For single crystal UO2, the thermal conductivity predicted by the Basak potential is 18.02 W/(m-K) at 300 K in this work, which is in good agreement with the value of 17.34 W/(m-K) obtained by Chernatynskiy et al. [Reference Chernatynskiy, Flint, Sinnott and Phillpot36] using the same potential. The small discrepancy may be caused by different simulation dimensions used in the two studies. Since different potentials predict different thermal conductivities for UO2 [Reference Chernatynskiy, Flint, Sinnott and Phillpot36], in this work all thermal conductivities of void/bubble-containing systems are normalized with respect to the single crystal value to highlight the effect of void/bubble on the thermal conductivity reduction. Two cases were studied for empty voids: single void of different radii (thus different porosities) and multiple voids with a fixed porosity of p = 2%, and the results are shown in Figs. 2(a) and 2(b) respectively. The simulation results are compared with Alvarez’s model [Reference Alvarez, Jou and Sellitto23]:
 $${{{k_{{\rm{Alvarez}}}}} \over {{k_{\rm{S}}}}} = {\left\{ {{{{k_{\rm{S}}}} \over {{k_{{\rm{Loeb}}}}}} + {9 \over 2}p{{\left( {{l \over r}} \right)}^2}{{\left( {1 + {3 \over {\sqrt 2 }}\sqrt p } \right)} / {\left[ {{{1 + \left( {0.864 + 0.29{{\rm{e}}^{ - {{1.25r} \over l}}}} \right)l} / r}} \right]}}} \right\}^{ - 1}}\quad ,$$
where k S is the thermal conductivity of a perfect single crystal, p is porosity (void volume fraction), l is phonon mean free path, and r is the void radius. The k Loeb term is a simple model to describe the thermal conductivity in a porous media and has the form [Reference Olander22],
 $${{{k_{{\rm{Loeb}}}}} \over {{k_{\rm{S}}}}} = 1 - p\quad .$$
Comparison between the thermal conductivities calculated from MD simulations (filled circles) and Alvarez’s theoretical model [Reference Alvarez, Jou and Sellitto23] (lines). All MD-calculated thermal conductivities are normalized with respect to the single crystal value at 300 K. (a) Single void. Different porosity corresponds to different void radii. The phonon mean free path of l = 9.8 nm is used in Alvarez’s model. (b) Multiple voids with a fixed porosity of p = 2%. The solid line is Alvarez’s model with l = 9.8 nm. The dashed line is the perfect fit of Alvarez’s model to the simulation data, which yields l = 11.7 nm.
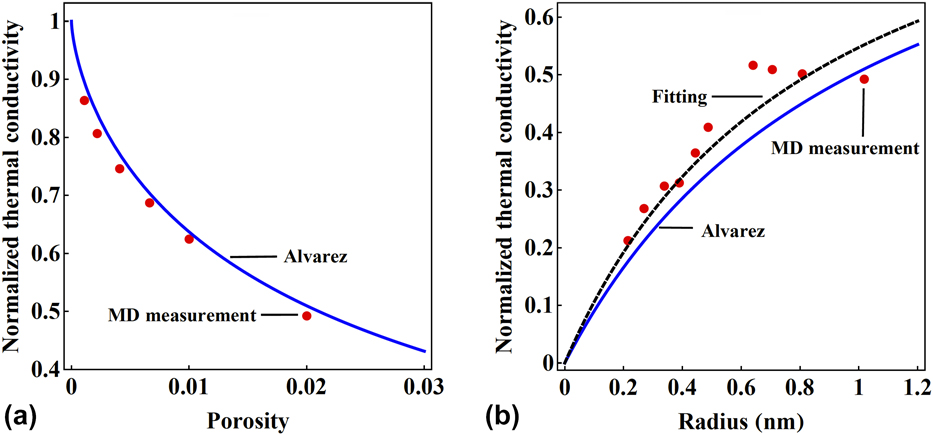
The advantage of Alvarez’s model over Loeb’s model is that the former includes the phonon scattering effects when the phonon mean free path l is comparable or larger than the bubble radius r. When l ≪ r, the phonon scattering effect is negligible and Alvarez’s model is the same as Loeb’s model [Eq. (5)]. The comparison between Alvarez’s model and the MD results for single voids is shown in Fig. 2(a). The best fit gives the phonon mean free path of l = 9.8 nm at 300 K. Previously, Lee et al. [Reference Lee, Chernatynskiy, Shukla, Stoller, Sinnott and Phillpot13] obtained the phonon mean free path of l = 3.6 nm at 800 K in a UO2 system with 10 × 10 × 40 unit cells. This discrepancy may be mainly due to the temperature effect because a higher temperature yields a shorter phonon mean free path. In addition, the phonon mean free path may depend on the simulation system size [Reference Lee, Lee and Hwang37, Reference Choi, Maruyama, Kim and Lee38]. Nevertheless, both studies show that Alvarez’s model can well describe the nonlinear decrease in thermal conductivity with increasing porosity for single voids. The comparison between Alvarez’s model and the MD results of multiple voids with a fixed porosity of 2% is shown in Fig. 2(b). In this case, the number of vacancy clusters in a void varies with the void radius, ranging from 2 to 108 Schottky vacancy clusters. The MD results show that initially the thermal conductivity increases nearly linearly with void radius, then reaches a saturated value of about 0.5 at about r = 0.6 nm (27 Schottky vacancy clusters). This critical radius indicates that the phonon scattering mechanism may change from point defect–dominant scattering to interface-dominant scattering. It also indicates that at a given porosity, many dispersed small vacancy clusters can cause more thermal conductivity reduction than if they aggregate to a few large voids. Therefore, defect clustering can improve the thermal conductivity. Using the same phonon mean free path as for the single void case (l = 9.8 nm), Alvarez’s model slightly underpredicts the thermal conductivity in the linear regime. The best fit gives a slightly larger value, l = 11.7 nm. The thermal conductivity predicted by Alvarez’s model keeps increasing with the void radius and eventually will saturate at the value of 0.98 as predicted by Leob’s model. Tonks et al. [Reference Tonks, Liu, Andersson, Perez, Chernatynskiy, Pastore, Stanek and Williamson10] compared the Maxwell–Eucken equation with Alvarez’s model and determined that the threshold void radius for the transition is about 5 nm for a tolerance of 5% between two models. Therefore, the discrepancy in the critical radius between MD and the theoretical analysis is about one order of magnitude. In addition, the thermal conductivity reduction in the saturated regime obtained from MD simulations is significantly larger than that predicted by the theoretical models. Similar large discrepancy was also obtained in Lee et al.’s MD work [Reference Lee, Chernatynskiy, Shukla, Stoller, Sinnott and Phillpot13]. The discrepancy may be caused by the finite system size and non-random distribution of voids in MD simulations. For example, the cross-section area in our MD simulations is relatively small (6 × 6 unit cells). Due to the periodic boundary conditions, voids may align with their periodic images, so that the assumption of random void distribution in Alvarez’s model breaks down. On the other hand, the theoretical models that are purely based on the porosity (e.g., Leob’s model) were found to disagree with experimental data [Reference Nikolopoulos and Ondracek39], so that many different models have been proposed [Reference Lee, Chernatynskiy, Shukla, Stoller, Sinnott and Phillpot13]. Therefore, more research is needed to clarify the underlying reasons for the discrepancies between MD simulations and theoretical models regarding the critical radius and the thermal conductivity reduction ratio.
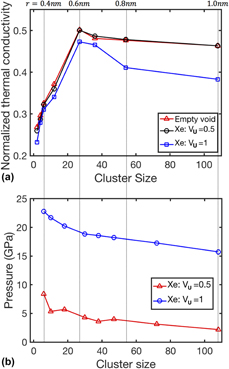
To study the effect of Xe bubbles on the thermal conductivity, the empty voids studied above were filled with Xe. Two Xe:VU ratios were used: 0.5 (half filled) and 1.0 (full filled). The total porosity in each Xe-containing system is still 2%. Since the system dimensions and pore configurations are the same for voids and bubbles, the differences in thermal conductivity reduction between them are simply due to the Xe content in bubbles. The comparison of the thermal conductivity between three cases (empty voids, half-filled bubbles, and full-filled bubbles) is shown in Fig. 3(a). Similar to the voids, there are two distinct regimes for Xe bubbles: point defect–dominant scattering regime and surface-dominant scattering regime. The critical bubble sizes for the transition are also similar as in the void-containing system, about 0.6 nm. When the defect cluster size is small, the thermal conductivities in the three cases are similar, although a full-filled Xe cluster has a slightly lower thermal conductivity than those in the other two cases at the same cluster size. When the defect cluster size is greater than the critical size, the half-filled bubbles result in nearly identical thermal conductivities as the empty voids. However, the full-filled bubbles lead to lower thermal conductivities than the empty voids. In addition, the thermal conductivity reduction induced by the full-filled Xe bubbles becomes more pronounced as the bubble size increases. Similar to helium bubbles studied by Lee et al. [Reference Lee, Chernatynskiy, Shukla, Stoller, Sinnott and Phillpot13], our results are surprising because Xe gas can be a heat conducting medium and the Xe addition in a void should lead to a higher thermal conductivity. However, our MD results show an opposite trend.
Effect of pore size and Xe bubble pressure on the thermal conductivity in a system contains multiple pores. The porosity is 2% in all thermal conductivity simulations. The pore size is represented by the number of removed UO2 pairs in the pore. (a) Normalized thermal conductivity as a function of pore size. Three types of pores are studied: empty voids, half-filled bubbles (Xe:VU = 0.5), and full-filled bubbles (Xe:VU = 1.0). (b) Xe bubble pressure as a function of bubble size.

It is well known that bubble pressure increases with the Xe density or Xe:VU ratio in a bubble. To investigate how the bubble pressure changes when the Xe:VU ratio varies from 0.5 to 1.0, bubble pressures were calculated based on the virial stresses of Xe atoms for the two Xe:VU ratios at different bubble sizes, as shown in Fig. 3(b). Generally speaking, the bubble pressure in a full-filled bubble is about 4 times higher than that in a half-filled bubble at a given bubble size. Since small bubbles are over-pressurized [Reference Liu and Andersson40], bubble pressure decreases with increasing bubble size. For the full-filled bubbles, bubble pressure is in the range of 16–23 GPa, which agrees well with Liu et al.’s MD results of 15–25 GPa [Reference Liu and Andersson40] using a different interatomic potential. From Figs. 3(a) and 3(b), it seems that there exists a critical pressure or Xe:VU ratio, below which a Xe bubble behaves like a void and above which a Xe bubble causes extra thermal conductivity reduction.
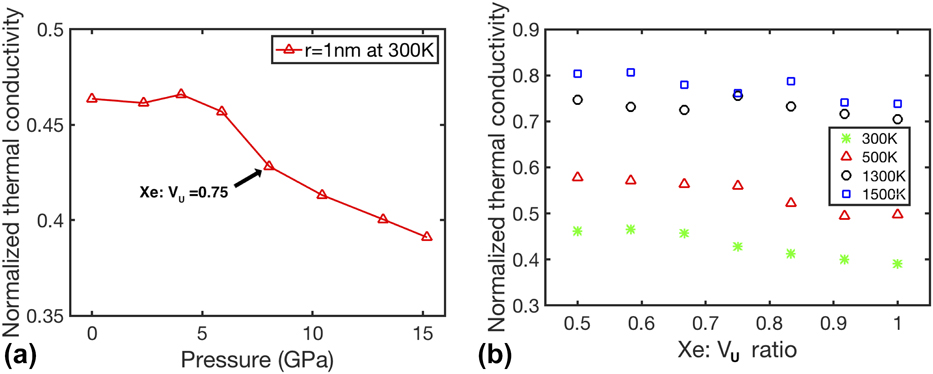
To determine the critical bubble pressure or Xe:VU ratio for the extra thermal conductivity reduction, a single bubble with a radius of 1 nm is created. Different Xe:VU ratios ranging from 0 to 1.0 are used to fill the bubble with Xe. The normalized thermal conductivity as a function of bubble pressure at 300 K is shown in Fig. 4(a). When bubble pressure is low, the thermal conductivity is close to that of the empty void (i.e., the value at 0 GPa). When bubble pressure is about 7 GPa, which corresponds to Xe:VU = 0.75, the thermal conductivity has a clear drop. As pressure increases further, thermal conductivity decreases almost linearly with pressure. Although the Xe density in bubbles has a significant effect on thermal conductivity at 300 K, we found that this effect becomes weaker at high temperatures. Figure 4(b) shows the thermal conductivity as a function of Xe:VU ratio at 300, 500, 1300, and 1500 K. The results show that the critical Xe:VU ratio increases with temperature. For example, the critical ratio is 0.75 at 300 K, while it shifts to 0.83 at 500 K. At elevated temperatures (1300 and 1500 K), the effect of Xe density on thermal conductivity seems to disappear, suggesting that temperature effects may dominate the thermal transport at high temperatures. It may also be that the large thermal noises at high temperatures, some are artificial due to the finite system size, make the effect less discernible.
Effect of bubble pressure (or Xe:VU ratio) and temperature on the thermal conductivity in a system containing a single pore with r = 1 nm. All thermal conductivities are normalized to the single crystal value at the respective temperature. (a) Normalized thermal conductivity as a function of bubble pressure at 300 K. (b) Normalized thermal conductivity as a function of Xe:VU ratio at four different temperatures (300, 500, 1300, and 1500 K).

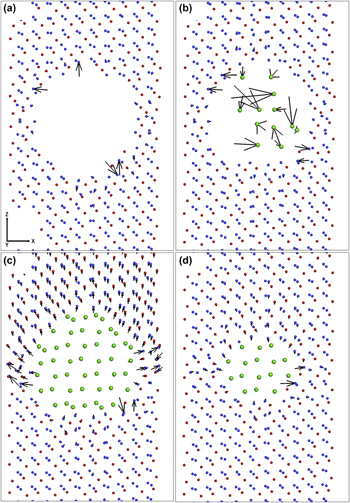
The thermal conductivity reduction at high Xe:VU ratios is similar as in the previous helium bubble work by Lee et al. [Reference Lee, Chernatynskiy, Shukla, Stoller, Sinnott and Phillpot13]. In that work, they found that helium atoms can diffuse away from a helium bubble into the UO2 matrix. The formation of such a diffuse interface was also confirmed by Liu et al.’s MD simulations [Reference Liu and Andersson40]. As a result, thermal conductivity is further reduced with respect to an empty void due to the formation of this diffuse interface. However, such a helium gas resolution mechanism may not be applicable for Xe because Xe has a much larger atomic size. To understand the underlying mechanism for the additional thermal conductivity reduction caused by Xe bubbles, the final positions of atoms near a void/bubble are visualized in Fig. 5. The vectors indicate the displacements of atoms with respect to their initial positions, with arrow tails showing the initial atom positions. Figures 5(a)–5(c) show the atom positions around a 1 nm void/bubble with three Xe:VU ratios: 0, 0.5, and 1.0, respectively. For the empty void [Fig. 5(a)], only a few oxygen atoms have discerned displacements. For the half-filled bubble [Fig. 5(b)], again only a few oxygen atoms have large displacements but uranium atoms remain at their original positions. The Xe atoms have significant displacements, but they never leave the bubble. When the bubble is fully filled [Fig. 5(c)], many oxygen and uranium atoms have distinguishable displacements. The vector directions indicate that most atoms displace away from the bubble. This is because the full-filled bubble has a very high pressure, as shown in Fig. 3(b). Therefore, the bubble tends to release its pressure through displacing the surrounding atoms. Interestingly, atoms above the bubble have more displacements than those below the bubble. This is because the temperature above the bubble is higher than that below the bubble due to the thermal gradient. Since a crystal lattice at a higher temperature is softer than that at a lower temperature, these atoms in the hotter region can be displaced more. It should be noted that Xe atoms do not have noticeable displacements in Fig. 5(c), and they do not diffuse into the matrix either. Therefore, Xe behaves like a solid when the bubble is fully filled. This observation is consistent with the work by Liu and Andersson [Reference Liu and Andersson40], in which they found that uranium atoms around a Xe bubble were displaced to release the bubble pressure for Xe:VU = 1.0. The interface distortion around an over-pressurized bubble can cause additional phonon scattering. A similar bubble surface distortion effect on thermal conductivity reduction was also observed in tungsten with over-pressurized helium bubbles [Reference Hu, Wirth and Maroudas41]. As a result, the thermal conductivity is reduced further with respect to an empty void or half-filled bubble. Therefore, although the phenomenon of additional thermal conductivity reduction in UO2 is observed for both over-pressurized He bubbles [Reference Lee, Chernatynskiy, Shukla, Stoller, Sinnott and Phillpot13] and Xe bubbles, the underlying mechanisms are different. In the former, helium resolution creates a diffuse interface that causes additional phonon scattering. In the latter, the distorted bubble surface in an over-pressurized bubble induces the additional phonon scattering. It seems that temperature does not affect the different behaviors of gas atoms in UO2. For example, in the work by Liu and Andersson [Reference Liu and Andersson40], both helium and Xe bubbles were annealed at 1000 K. Helium diffused to the UO2 matrix, while Xe remained inside the bubble, which is consistent with our Xe results at 300 K.
Visualization of the final atom positions near a bubble or void, with red spheres being U atoms, blue spheres being oxygen atoms, and green spheres being Xe atoms. The atomic displacements are indicated by black vectors with the tails representing the initial atom positions. The vector length is proportional to the actual atom displacement. (a) An empty void with r = 1 nm. (b) A half-filled bubble (Xe:VU = 0.5) with r = 1 nm. (c) A full-filled bubble (Xe:VU = 1.0) with r = 1 nm. (d) A full-filled bubble (Xe:VU = 1.0) with r = 0.6 nm.

The above results show that bubble pressure or Xe:VU ratio is an important factor for causing the interface distortion. Currently, there is no consensus on the pressure or Xe:VU ratio in Xe bubbles in UO2. Garcia et al. [Reference Garcia, Martin, Carlot, Castelier, Ripert, Sabathier, Valot, D’Acapito, Hazemann, Proux and Nassif42] estimated that the typical Xe gas bubble pressure in UO2 is in the range of 2–5 GPa based on their experimental measurements using X-ray absorption spectroscopy. If this is always true, bubbles may be only half filled and they may behave similarly as voids. Based on the experimental measurements and Ronchi’s model [Reference Ronchi43], Nogita et al. [Reference Nogita and Une44] estimated that Xe bubble pressure was in the range 1.5–15 GPa for a bubble radius between 4 and 10 nm. Based on MD simulations, Liu et al. [Reference Liu and Andersson40] concluded that the Xe:VU ratio is likely to be 1.0 in pre-existing voids if Xe diffusion kinetics allows. The calculated bubble pressure is about 15 GPa for a 1–2 nm bubble. If this happens in reality, bubbles may be fully filled and they may cause more thermal conductivity reduction than voids.
It should be noted that bubble surface distortion depends on not only bubble pressure but also bubble size because smaller bubbles can accommodate higher pressures [Reference Liu and Andersson40]. To demonstrate the effect of bubble size, Fig. 5(d) shows the distortion of surface atoms around a full-filled bubble with a radius of 0.6 nm (27 Schottky vacancy clusters). Compared with the larger bubble [Fig. 5(c)], the surface atoms around the smaller bubble have much smaller displacements [Fig. 5(d)]. As a result, the thermal conductivity of this full-filled bubble is only slightly lower than the empty void, as shown in Fig. 3(a).
As mentioned earlier, there exists a critical void/bubble size below which point defect scattering dominates [Fig. 3(a)]. In this regime, our MD results show that incorporation of Xe into the small vacancy clusters still leads to the extra reduction of thermal conductivity, even though the atoms near the clusters do not have much distortion [e.g., Fig. 5(d)]. To verify this, we have studied the effect of Xe incorporation into a special vacancy cluster—octahedron cluster—on the thermal conductivity of UO2. An octahedron cluster consists of six uranium vacancies and eight oxygen vacancies (6VU:8VO). Previous density functional theory (DFT) calculations [Reference Andersson, Perriot, Pastore, Tonks, Cooper, Liu, Goyal, Uberuaga and Stanek20] showed that this cluster is surprisingly stable, so that it may be important for Xe bubble nucleation. In addition, to further validate that our results are not specific to the interatomic potential, here we use the recently developed embedded atom method (EAM) potential [Reference Cooper, Kuganathan, Burr, Rushton, Grimes, Stanek and Andersson34, Reference Cooper, Rushton and Grimes35] to study the effect of Xe incorporation into octahedron clusters. In this potential, an additional EAM component is added to Eq. (1) to include the many-body effects in the UO2. The Xe–U and Xe–O are described by the Buckingham potential, and the Xe–Xe interaction was originally developed by Tang et al. [Reference Tang and Toennies45]. Note these potential parameters can be downloaded online [Reference Cooper, Rushton and Grimes46].
Here, the simulation system contained 5 × 5 × 50 UO2 unit cells initially. Then 5 octahedron clusters per 1280 uranium atoms were created, so that the total porosity in this system is 2.34% with respect to the uranium sites. In each octahedron cluster, up to 8 Xe atoms were incorporated. The calculated thermal conductivities were used to fit to a semiempirical model [Reference Liu, Cooper, McClellan, Lashley, Byler, Bell, Grimes, Stanek and Andersson11]:
 $$k = {1 \over {A + B \cdot T + C \cdot x}}\quad ,$$
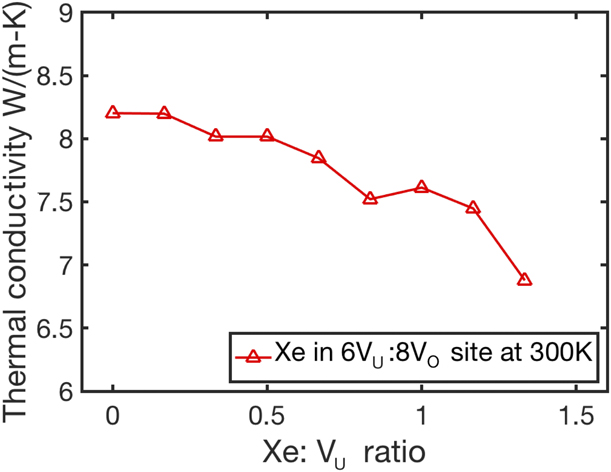
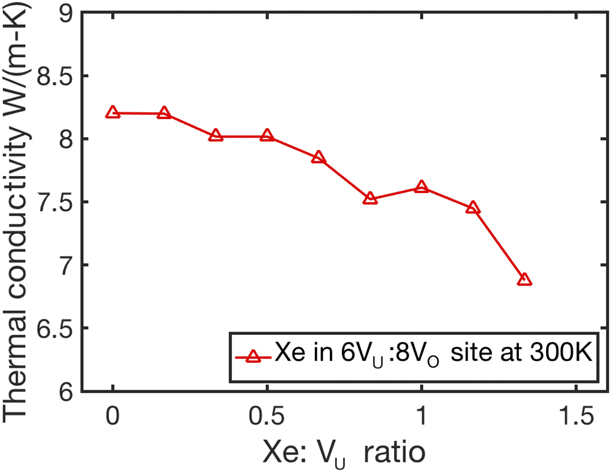
where A and B are parameters for the nondefective lattice, C is a scattering parameter for one type of defects or clusters, T is temperature, and x is the lattice concentration of defects or clusters. The parameters A and B are listed in Table II, which were previously determined by fitting to the spin scattering adjusted MD data [Reference Liu, Cooper, McClellan, Lashley, Byler, Bell, Grimes, Stanek and Andersson11]. Therefore, in this work we only used MD results to determine the scattering parameters (C) for different number of Xe atoms occupying the octahedron cluster (nXe:6VU:8VO). These determined parameters are listed in Table II. Note a smaller scattering parameter means a higher thermal conductivity at a given temperature. It can be seen that the scattering parameter has a non-linear relationship with the Xe:VU ratio. The general trend is that the scattering parameter increases with the increasing Xe:VU ratio. In other words, the more Xe atoms incorporated into octahedron clusters, the lower the thermal conductivity. This trend is consistent with the above results obtained from the Basak potential [Fig. 3(a)], indicating that the conclusions in this work are not specific to the interatomic potentials used. Table II also shows that when the Xe:VU = 4:6 = 0.667, the scattering parameter increases significantly, suggesting that a critical Xe:VU ratio may exist. Figure 6 shows the thermal conductivity as a function of the Xe:VU ratio in the octahedron cluster at 300 K, which is calculated based on Eq. (6), and the parameters are listed in Table II. Clearly, the thermal conductivity decreases with the increasing number of Xe atoms in octahedron clusters. Overall, both Basak potential and EAM potential predict that incorporation of Xe into vacancy clusters or small voids causes additional decrease in thermal conductivity, which is counterintuitive, and such effect should be included in mesoscale or analytical modeling.
Parameters obtained from MD simulations for predicting the thermal conductivity of Xe-filled octahedron clusters using Eq. (6).

Thermal conductivity of the system containing Xe-filled octahedron clusters as a function of Xe:VU ratio at 300 K. The results were calculated based on the EAM potential.
Conclusions
In this work, MD simulations are conducted to study the size and pressure effects of small Xe bubbles on the thermal transport properties in UO2. The results are compared with empty voids of the same sizes to elucidate the role of Xe addition in the thermal conductivity. The results show that for both voids and Xe bubbles, at a fixed porosity, the thermal conductivity initially increases with pore size, then reaches a saturated value, suggesting that there is a transition from point defect–dominant phonon scattering to surface-dominant phonon scattering. This transition also demonstrates that dispersed Xe atoms or vacancies typically result in a lower thermal conductivity than clustering them into bubbles or voids. The critical radius for the transition is about 0.6 nm, which is much smaller than the theoretical prediction of 5 nm [Reference Tonks, Liu, Andersson, Perez, Chernatynskiy, Pastore, Stanek and Williamson10]. In terms of the effect of Xe addition, it is found that half-filled Xe bubbles (Xe:VU = 0.5) give nearly the same thermal conductivity as empty voids, while full-filled bubbles (Xe:VU = 1.0) lead to additional reduction in thermal conductivity with respect to empty voids. Further analysis shows that this effect becomes important when the Xe:VU ratio is greater than 0.75. In addition, this effect is found to exist even when the Xe cluster size is small, although it is not as significant as in the relatively large bubbles. The results are surprising because it is usually assumed that Xe can serve as a heat conducting medium [Reference Bai, Tonks, Zhang and Hales12], so that Xe bubbles can improve the thermal conductivity in comparison with empty voids. Through visualization of the displacements of bubble surface atoms, it is found that bubble surface atoms are displaced to release the bubble pressure. In addition, Xe atoms are found to stay within bubbles because their atomic size is large. The bubble pressure–induced surface distortion causes additional phonon scattering and therefore further reduces the thermal conductivity. This mechanism is different from the helium resolution mechanism in helium bubbles [Reference Lee, Chernatynskiy, Shukla, Stoller, Sinnott and Phillpot13], because helium has a small atomic size and can diffuse into the UO2 matrix to form a diffuse interface. This work suggests that the surface distortion of over-pressurized Xe bubbles is an important surface scattering mechanism, in particular when bubble size is small such as intragranular bubbles. Therefore, this mechanism should be incorporated in mesoscale modeling of thermal conductivity degradation due to small Xe bubbles in the future.
Acknowledgments
This work was primarily supported by the U.S. Department of Energy, Nuclear Energy University Program (NEUP Award # DE-NE0008279), through the University of Florida. M.W.D. Cooper and D.A. Andersson were funded by the U.S. Department of Energy, Office of Nuclear Energy, Nuclear Energy Advanced Modeling Simulation (NEAMS) Program. X.M. Bai also would like to thank the Faculty Joint Appointment Program at Idaho National Laboratory (Battelle Energy Alliance). The authors at Virginia Tech acknowledge the use of the computing facilities at the Advanced Research Computing at Virginia Tech. The manuscript has been co-authored by Battelle Energy Alliance, LLC, under Contract No. DE-AC07-05ID14517 with the U.S. Department of Energy. The U.S. Government retains and the publisher, by accepting the article for publication, acknowledges that the U.S. Government retains a nonexclusive, paid-up, irrevocable, world-wide license to publish or reproduce the published form of the manuscript, or allow others to do so, for U.S. Government purposes.