INTRODUCTION
In conventional economic theory, fluctuations off the fundamental equilibrium path are attributable to exogenous shocks; abnormal returns are associated with exogenous characteristics specific to the event observation. This has an implication on the cross correlations in security returns that the correlations are an inevitable consequence of some external common factors. This implication, attributing the empirically observed asset dependency to external common factors, however, is built on the notion of market efficiency with homogeneous and perfectly rational agents. The conventional notion of economic agency neglects the interactive structure to which heterogeneous agents give rise. To gain a better understanding of asset correlation, we need to take into account how participating agents behave in the market.
This paper studies the relation between herding (imitation) and asset dependency. Imitation is one of the most common observations among human behaviour. It can lead to systematic erroneous decision making and convergence of behavior across individuals, often referred to as herding. Instead of viewing the market as a static aggregation of isolated individuals, the development of this paper uses the “individual-oriented” approach that emphasizes on interpersonal interactions to explore the issue of interest. It sets out to explore whether herding endogenously induces correlations in security returns. To what extent does herding account for asset comovement? Is the pace of learning (or herding) relevant? What role does the market condition play in this possible link between herding and asset dependency? Can we identify empirically the herd effect on asset co-movements, if any? These are the issues to be explored in this paper. A review of the related literature is included, followed by a discussion of the present model and its possible contributions.
There are empirical models in the literature for detecting the existence of herding.1
Suggestions given by Mark Salmon pointing to this related group of literature is acknowledged.
Christie and Huang (1995) propose a novel approach to detect herding in U.S. equity return data. They suggest that the market impact of herding can be measured by considering the cross-sectional dispersion or volatility of equity returns. If the dispersion is small during large price movements, then it is likely that herding occurs. Using daily and monthly returns on U.S. equities, they find a high level of dispersion around the market return during periods of market stress or high price volatility, and conclude that during these periods herding in equity markets does not occur. The model of Christie and Huang (1995) is extended by Chang, Cheng, and Khorana (2000). Chang et al. (2000) first show that under rational asset pricing models, the dispersion of stock returns is an increasing linear function of market returns. Their model suggests that herding occurs when there exists a nonlinear relationship between equity return dispersion and average market return during large price movements. They investigate the existence of herding in the U.S., Hong Kong, Japanese, South Korean, and Taiwanese equity markets. Individual equity returns are examined in a monthly basis. Although no evidence of herding was found to exist for the United States or Hong Kong, partial evidence was found for Japan, and evidence in favor of herding was found for South Korea and Taiwan.
Christie and Huang (1995) and Change et al. (2000) focus their analysis of herding on periods of extreme market movements, in which the herding objective is set as market portfolio. However, there are factors other than market portfolio that can serve as herding objectives. Hwang and Salmon (2004) develop an approach to measure herding based on observing deviations from the equilibrium beliefs expressed in the CAPM prices. Although similar to Christie and Huang (1995), using information held in the cross-sectional movements of the market, the focus of Hwang and Salmon (2004) is placed on the cross-sectional variability of factor sensitivities rather than returns. Hwang and Salmon (2004) apply their approach to the U.S., U.K., and South Korean stock markets. They found that the Asian Crisis and Russian Crisis can be turning points in herding behavior so that efficiency pricing may be helped by market stress. They also found that in the U.S. market there were few periods that herding was a major concern and statistically significant.
The present model in this paper contributes to the literature in that it considers a multiple-asset model to investigate the herd effect on the cross-sectional correlations in security returns. The effect of herding on financial markets traditionally has been investigated in the single-asset model; such studies include Cont and Bouchaud (2000), Corcos et al. (2002), Lux (1995), and Topol (1991). These studies have placed their focus on whether the price time series exhibits the stylized facts of financial data, such as excess volatility and fat-tail distribution. A related empirical work has been conducted by MacKenzie (2003), a sociologist who studied the fall of the Long Term Capital Management (LTCM) in 1998 and suggests that imitation among investors was the major cause to the crisis. MacKenzie (2003) observes that imitation had developed an overlapping and unstable “superportfolio” in the markets within which LTCM operated. Furthermore, triggered by an event in 1998 that LTCM itself in fact had only little exposure, the rapid unraveling of the “superportfolio” led to the crisis.
In the exploration of the potential association between herding and asset dependency, this study provides a theoretical analysis of a simpler but tractable model, followed by simulation experiments based on more complex but realistic assumptions. Furthermore, this study also contributes to the empirical literature of the nonconstant, asymmetric patterns of return correlations by conducting econometric tests2
The suggestions provided by Mark Salmon and Shaun Bond to conduct these econometric tests are gratefully acknowledged.
Last but not least, it is noteworthy that the study in this paper focuses on “rational herding” as opposed to “irrational herding.” Devenow and Welch (1996) have provided a comprehensive review on the studies of rational herding in financial economics. Irrational herding is driven by factors unrelated to individuals' well-being defined in conventional economics. Rational herding is motivated by the incentives of profits, lower search costs, or the belief that someone possesses superior knowledge. Essentially, rational herding can be considered as “imitative learning.” In the current setting, heterogeneous investors are endowed with the ability to update their investment strategies: they follow an imitative learning process and imitate the winner according to their relative realized trading profits. Herding results in a change in the market composition and the ratio of heterogeneous investors, which in turn affects the next period's price formation and hence the trading profits. The process repeats, and herding paves the market dynamics.
ASSET PRICING MODEL WITH MULTIPLE RISKY ASSETS
In this section, we present the formal details of our model. Consider a capital market with S risky assets (securities) and one risk-free asset (bond). The bond pays a fixed rate of return rf for each time period; the gross rate of risk-free return is Rf = 1+rf. Denote by
the S × 1 vector of the prices per share of the securities at time t. Letters in bold denote vectors. We assume that each security pays periodic dividends and denote by
the S × 1 vector of the dividends paid by the securities at time t. We further assume that the S × 1 dividend vector and also the time-series dividend process of each security follow an IID process; for convenience, we write
, where
is an S × 1 mean vector and Σd is an S × S diagonal covariance matrix. The vector of the gross risky payoffs from time t to time t+1 is given by
.
Let Et[·] and Vt[·] denote the conditional mean and conditional (co)variance; they are the mean and (co)variance of some variable (vector), conditional on the information at time t. Denote by
the S × 1 vector of the number of security shares purchased by an investor at time t. The investor's wealth level at time t+1 is given by

Investors are assumed to be myopic3
The setting of myopic investors assumes single-period utility maximization, and it has the benefit of making the computation tractable. Another approach is by the overlapping generation model (e.g., Brock and Hommes, 2002). Alternatively, for the analysis of the rational expectations equilibrium in an non-myopic investor setting, see Brown and Jennings (1989) and the generalization by He and Wang (1995).

where a is the risk aversion parameter. This classic mean-variance problem with multiple risky assets yields the vector of the optimal risky portfolio given by

The result states that the vector of the optimal demand for the number of risky shares can be obtained by the vector of the expected excess risky payoffs times the inverse of the conditional covariance matrix, divided by the risk aversion coefficient.
We assume heterogeneous investors and add superscript i for investor type i. Investors differ in their forecasting strategies (or beliefs) on the payoffs of the securities. However, the conditional covariance matrix of the risky payoffs is assumed to be a constant diagonal matrix and equal4
This is an approximation in a world where volatility forecasts are well established and agreed but mean forecasts are not; such a situation arises when there is a dominant risk management system or a implied volatility methodology that is universally accepted. See Merton (1980), who argues that means are much harder to forecast than variances.
, where Ω is an S × S diagonal matrix. The assumption of the diagonal covariance matrix implies no cross-asset correlation. It is crucial to isolate the ex-ante correlation factors, as our focus here is to investigate the correlation structure in security returns arising from the dynamic interaction among agents.
Let
denote the fraction of investor type i in the investor population at time t, representing the popularity of strategy i at time t and satisfying
, where N is the number of different investor (or strategy) types. For simplicity, we assume any investor i follows only one strategy at any time t. Denote by
the S × 1 vector of the supply of the security shares per investor, assumed to be constant. Market equilibrium requires

Substituting in the optimal risky portfolio (3) with superscript i, the market equilibrium equation can be rewritten as

The term
can be viewed as measuring the vector of the expected excess amount of the risky payoffs and therefore may be interpreted as the risk premium vector. In the asset pricing model with heterogeneous investors, the equilibrium price is the discounted weighted average of heterogeneous payoff expectations minus the risk premium, with the weights being the fractions of different investor types.
Therefore, market equilibrium yields the equilibrium price dependent on not only economic fundamentals, but also those factors influenced by investor psychology and emotion: the fraction (based on the popularity) of investor types and their conditional forecasts. In the following sections, we will discuss how investors form their forecasts and also how the dynamic change of the investor fractions takes place.
In a conventional economic world of homogeneous, perfectly rational investors, equation (5) and the transversality condition will lead to the expression5
For a detailed derivation of a similar expression, see for example, Brock, Hommes, and Wagener (2001).

In the world of homogeneous, perfectly rational investors, the equilibrium price is the fundamental value of the security, independent of investment behavior. Market fluctuations are due to exogenous shocks rather than endogenous causes.
HETEROGENEOUS EXPECTATIONS
In the asset pricing model with heterogeneous investors, the equilibrium price (5) is the discounted weighted average of heterogeneous payoff expectations minus the risk premium. In this section, we will discuss how investors form their conditional expectations.
We will mainly focus on three types of investment strategies6
The attributes to investors' heterogeneity can go beyond the conventional paradigm of asymmetric information to include diversity in prior beliefs Kurz (1997) argues that the center of individuals' disagreement lies in their diverse prior beliefs instead of information asymmetry; diverse beliefs explain why different interpretations arise given the same information. By contrast, prior beliefs also influence information selection. Investors with different beliefs are likely to pick up dissimilar sources for their forecasts.
and the asset valuation
; as such, it is claimed that the strategy does not require the need for forecasting. In contrast, technical analysts' demand is entirely driven by forecasts that involve analysing statistics generated by market activity. Technical analysis uses the price and trading histories to seek to identify patterns in price movement and to forecast future market activity.
Although technical trading strategies can take many different forms, generally they are classified as trend following or contrarian. The trend following strategy buys into a rising market and sells into a falling one, whereas the contrarian strategy buys low, sells high, and trades against the trend signal.
We define the information set by
. It is assumed that the fundamental value of the risky asset and the historical price and dividend information are both accessible. Although the information set is assumed to be common for all agents, different groups of traders based on their beliefs can choose different sources of information to form their forecasts. Based on the specified information set, the price and dividend forecast vectors made by agent i at time t are given by


The error term
represents the random noise vector in agent i's price forecast vector at time
is the S × 1 vector of investor i's technical forecasts made at time t on the next-period prices of the securities.
Equation (7) assumes, for simplicity, a common dividend expectation equal to the unconditional mean of the stochastic IID dividend process. In the price forecasts, the fundamental price vector
is assumed as common knowledge. Equation (8) expresses the price forecast as a weighted sum of the fundamental price and technical forecast, plus some random noise. The noise
is to capture the effect of all other sources that may influence the price forecasts made by agent i at time t.
The weight βi reveals the investor type. 1−βi and βi are investor i's forecasting weights on the fundamental price and technical forecast, respectively. Value investors are considered to be using only fundamental analysis (βi = 0) and technical traders to be using only technical analysis (βi = 1), although the mixture of both analyses is possible.
Assumptions (7) and (8) are consistent with the asset pricing model discussed in the previous section; if all investors are value investors, assumptions (7) and (8) will lead7
For a detailed derivation for the case of one risky asset, see Yang and Satchell (2003).
We propose that the formation of the technical forecast function
satisfies the following properties:
- (i) It is a function of past prices. More precisely, it is a function of a trend indicator, which is a function of past prices.
- (ii) In order to be self-consistent, the technical forecast is considered to be either monotonically increasing or decreasing in its trend indicator.
- (iii) It is bounded between two real numbers.
- (iv) When the trend indicator is neutral, the technical forecast becomes the fundamental price. That is, when past prices provide no information on future price movements, the average predicted asset value by technical traders coincides with the asset's fundamental value.
Properties (ii) and (iii) make any cumulative distribution function8
Alternatively, for a linear technical forecast function, see Sentana and Wadhwani (1992).

where [odot ] denotes the element-by-element multiplication of vectors, and 0S is an S × 1 vector of zeros. The term CDF(0S)−1 represents the element-wise inverse of the vector CDF(0S). Throughout this thesis, we use the inverse operation on a vector A =(a1, a2, a3)′ to denote the vector of its element-wise inverse, that is

denotes the S × 1 trend indicator vector at time t, and is given by
, a function of past prices of M lags. ηi is the sensitivity parameter to the trend indicator, and its sign varies with the investor type: for the trend following strategy, the forecast is monotonically increasing in the trend signal, i.e. ηi > 0; for the contrarian strategy, the forecast is monotonically decreasing in the trend signal, that is, ηi<0.
Definition (9) approximates technical forecasts using CDFs. It satisfies all the above properties. However, it makes an oversimplifying assumption of a common, dominant trend indicator function, and differentiates technical traders by asking one key question: whether they trade following or against the trend. Although far from being realistic, this design of technical forecasts makes the model tractable, free from the complication of some variables differing in a way that can grow out of control.
Note that the choices of the CDF and the trend indicator function are arbitrary. In the later simulation experiments, we will proceed with the logistic CDF and also the commonly practiced moving-average trading rule as the trend indicator:

IMITATIVE LEARNING PROCESSES
As market equilibrium (5) suggests, the dynamics of the fractional change of investor types
influences price formation in the asset pricing model with heterogeneous investors. This section models investors' imitative learning that shapes the ratio of investor types.
An investor decides whether to update his investment strategy according to his trading performance. We use the performance criterion based on the net realized risky payoff. Investor i's net realized risky payoff from time t to time t+1 is given by

It is common that investors update their strategies based on the performance of risky investment. Risk-free investment pays a fixed anticipated return, and the gain is simply proportional to the amount invested. The criterion is not based on risk-free investment, but, given a fixed amount of capital, the risk-free share does affect the available risky share. A larger risky share, however, does not guarantee more risky payoffs. A good performance in (11) implies a good balance between risky and risk-free investments.
We consider two types of imitation which we call cautious learning (CL) and winner takes all (WTA). In the CL type of imitation, investors revise their strategies with caution and do not change abruptly. The WTA type of imitation corresponds to a more drastic imitation process. These two types of imitation are given in the following definitions.9
Although we consider strategy updating each period based on the performance of one-period payoff, a natural extension would be strategy updating in a longer horizon based on multiple-period payoff.


The definition of CL given in (12), using a threshold in positive profitability, states that imitation may only occur in response to a net loss in the realized risky payoff. Besides, the loss-making investor will imitate the strategy that reaps the maximum trading gain, with a probability depending on their relative performance Δπt. The probability function (
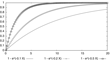
is bounded between 0 and 1 as Δπt≥0, and is monotonically increasing in Δπt but with a diminishing increase. Figure 1 depicts the probability function with different values of α a greater α means a higher probability to imitate when a loss occurs.

1−e−αΔπ with different values of α.
Following the WTA rule given in (13), regardless of the profitability of his original strategy, the investor always makes a move as long as there exists an outperforming strategy. The design of the WTA rule is for comparison purposes and is not a close description of human behavior, although it is similar in many ways to the investment strategy outlined in Pesaran and Timmermann (1995). [“Human behaviour, even rational human behaviour, is not to be accounted for by a handful of invariants. It is certainly not to be accounted for by assuming perfect adaptation to the environment” Simon (1979).] The CL rule, with first a threshold and second a probability function, appears to be more plausible.10
The pace of learning is influenced, though not fully determined, by institutional factors; we consider that this influence is better reflected by the CL rule rather than the WTA rule.
The imitative learning processes determine the dynamics of investor ratios
in the equilibrium price equation (5). The winning strategy will surely attract more market participants to put it into practice. However, more investors practicing the same strategy would probably mean that a deviant may well exploit this situation. Here is when a winning strategy loses its lead. The best strategy in the current period by no means guarantees its future success. The winning investor type changes through time with market conditions and capital reallocation, and so does the investor ratio.
THEORETICAL ANALYSIS IN A SIMPLIFIED MODEL
This section solves analytically whether agents' interaction, including herding, leads to asset dependency. It considers a simplified model for tractability. The results are summarized in the following propositions.
PROPOSITION 1. Assume Rf = 1, YS = 0S, and zero dividends. Consider a simple case of two investor types: value investors with a fraction of 1−θt, and technical traders with a fraction of θt; the S × 1 vector of price forecasts made at time t by investor i is given by
and
, consistent with (7),(8) and (9). Then, the market equilibrium equation (5) can be rewritten as

where
is the S × 1 vector of transformed prices, and
is the S×1 vector of transformed forecast functions.
is an S×S diagonal matrix with the diagonal entries from
Proof., See Appendix A.
Proposition 1 states that, under certain assumptions, the market equilibrium price equation (5) can be expressed in terms of the transformed prices, which are a simple product of the investor ratio and transformed forecast functions. This transformation will largely facilitate the analysis of the herd effect on asset dependency. The focus now is on the investigation of the relation between the dynamic change in the investor ratio θt and the dependency of the transformed prices
.
PROPOSITION 2. Based on Proposition 1, let
where
indicating that function fθ takes S different real numbers and calculates one new real number, and let
, where
Both functions fθ and fAare assumed to be continuously differentiable. Assuming that the S transformed prices in
are independent and the Jacobian matrix of At is diagonal, we can obtain the following results:
- (i) The covariance matrix of , is diagonal. Therefore, when θt is fixed at θ, the covariance matrix of , is also diagonal.
- (ii)Let , where
- a. When μ=0S, then cov[qt] is diagonal (note that this part of result (ii) is consistent with (i).
- b. When μ≠0S, then is nondiagonal.
Proof., See Appendix B.
Here, the definitions of the investor ratio θt and transformed forecast functions
are consistent with the discussions in the previous sections. θt changes due to herding. Investors decide whether to imitate according to their realized trading profits, which is a result of past prices. Also, the technical forecast is a function of past prices. The only restriction here is that Proposition 2 assumes an influence of only one-period lag.
To isolate the ex-ante correlation effects, the S transformed prices in
are assumed to be uncorrelated. Similarly, the Jacobian matrix of
is assumed to be diagonal. The diagonal Jacobian matrix of
implies no prior belief in asset dependency in the forecast function
. That is, when forecasting the future movement of one particular security, the investor uses only the information of that security, not the information of other securities.
Essentially, μ measures the change in the investor ratio due to a change in the realized profits, evaluated at the average profit level. It in fact reflects herding. Imitation motivated by the comparison of realized trading profits leads to nonzero μ, whereas a static model of no interaction among investors has a fixed investor ratio and, hence, μ=0S. Proposition 2 states that, given the assumptions discussed above, a fixed investor ratio (in the absence of herding) will guarantee no asset dependency. By contrast, a changing investor ratio, driven by profit motives, will lead to asset dependency. Overall, this section provides the analytical results that show, under some commonly used assumptions, that herding shapes the dynamics of the investor ratio and is the major driving force to cross-asset comovements.11
Note that although the analytical results are derived in price context, for correlations conditional on past information, price correlations will equal return correlations. This can be simply illustrated by
.
RETURN CORRELATIONS AND SIMULATION RESULTS
We wish to identify the association between imitative learning and asset co-movement. The approach using numerical simulations is to compare the cross-sectional correlation of security returns arising from three models:12
For tractability, we only consider the results of these three models. Of course, an advanced approach could be a combination, or even a regime switching, of various learning processes.

Notice that the inverse of price vector again denotes the vector of element-wise inverse. Security returns are calculated from the IID dividend process and the equilibrium price. It must be clarified that the equilibrium price is obtained from equation (5), using investors' forecasts
given in Section 3 and investor fractions
determined by the imitation processes given in Section 4. Imitation determines
, and, hence, influences the price formation and consequently the return correlation.
Let
,
, and
denote the respective correlation of security returns under the models of NA, CL, and WTA. We extend to take into account market conditions. Let ρL, ρM, and ρU denote the conditional correlations of security returns; they are the correlations conditional on the downside, normal, and upside markets, respectively. The market is said to be in a downside (upside) condition when the market index price is below (above) the δ quantile [(1−δ) quantile] of its distribution; the market condition is normal otherwise. The conditional correlations can be written as

where F(Pindex) is the CDF of the market index price, and 0<δ<1.
To investigate the association between imitative learning and asset co-movement, we examine the following inequalities on both unconditional and conditional correlations:


The inequality given by (16) implies that asset dependency can be endogenously induced by herding, and that hasty imitation is likely to have a significant effect. This implication can be of great relevance in understanding the making of extreme market events.
Essentially, the inequalities given in (17) further test the inequality (16) under each market condition. Conditional correlation bridges the possible effect of herding on asset co-movement with changing market conditions. Will the herd effect on asset dependency, if any, remain unchanged across different market states? Are market conditions irrelevant when hasty imitation is present? We hope to unravel these issues using the conditional correlation results.
The cross comparison of the inequalities given by (17) is further conducted:



The issue of whether cross-asset correlations tend to increase in volatile market conditions has provoked great research interest, and this pattern of nonconstant correlations has been reported in many empirical studies [e.g., Silvapulle and Granger (2001)]. The test specified by (18-1) is to confirm this pattern in the simple benchmark NA model. Inequalities given in (18-2) and (18-3) are to test how investors' learning processes interact with the market condition. The implication of (18-2) and (18-3) is that, given the same learning model, its effect on asset co-movements will depend on the market condition, in a way consistent with the empirical pattern of nonconstant correlations.13
It must be clarified that, even if the inequalities given by (18–2) and (18–3) hold, it by no means implies that the pattern of nonconstant correlations is caused by imitation; one can only conclude that the effect of imitation on asset dependency is consistent with the pattern of non-constant correlations.
There are 1,250 time periods (approximately five years of trading days); 50 securities and, hence, 1,225 pairs of cross correlations of security returns. The parameter values used for numerical simulations are given in Appendix C. The summary statistics of the unconditional and conditional cross-correlation results14
Only the results of positive correlations that correspond to asset co-movement in the same direction will be reported. The study of negative correlation has a different focus. Positive and negative correlations contain separate information; taking average of them may omit useful information.

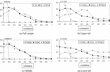
DistributionsNote that the x axis starts from 0.1 because the labels on the x axis indicate the ending numbers of the category; for example, 0.1 indicate the category (0, 0.1). of unconditional and conditional cross-correlations of security returns under the models of NA, CL, and WTA.

From the results of the unconditional correlation coefficients, it is clear that the NA model has the lowest correlation level, with an average of 0.028 and more than 99% of
lower than 0.1. The correlation level increases dramatically in the presence of herding, but the difference between
and
is not as striking; the respective average values of
and
are 0.251 and 0.319. The simulation results also suggest that a higher level of return correlations is accompanied by a higher level of standard deviations. The unconditional correlation outcomes lead us to confirm the inequality given by (16). Furthermore, the conditional correlation results15
There is also a minor observation that the level of the correlations conditional on a normal market condition is, among all the conditional ones, most close to the level of the unconditional correlations. This is not surprising, as the condition of ρM, on the market index price being between 10% to 90% quantiles, captures the majority of the sample distribution.
The conditional correlations show consistent outcomes with the unconditional correlations. These results confirm the inequalities given by (17). It is found a persistent evidence of higher return correlations across different states of the market in the presence of herding. Furthermore, the difference is more pronounced in the upside and downside markets than in the normal. Taken together, these observations have a crucial implication. They imply a situation in which abnormal market conditions, such as a bear market, can amplify the herd effect, which in turn exacerbates asset dependency. The herd effect on asset dependency thus engages in a self-reinforcing process that can eventually lead to disastrous phenomena such as crashes.
EMPIRICAL STUDY AND CORRELATION SYMMETRY TEST
The empirical investigation on the connection between herding and asset dependency is impeded by the difficulty in measuring the size of herding in the market and the complexity of many interacting factors that may or may not include herding. This is a typical problem that faces many researchers in identifying the true causes of a certain phenomenon; the real world is of such complexity that mostly we are not able to study the effect of interest in isolation of others. Moreover, detailed data on the strategies followed by investors across global equity markets are not readily available. Thus, our empirical study in this section does not intend to identify the herd effect as a cause of asset dependency in the real world. Instead, using data from two diverse markets, namely, the U.K. and Taiwan equity markets, it intends to show the real patterns of cross-sectional correlation in security returns and to compare them with the simulation results presented in the previous section.
Data are collected from the daily closing price series16
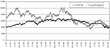
The market indices of the FTSE 100 and TWSI over a slightly longer period are given in Appendix D for reference.
Note that, here, the computation of security returns is consistent with (14) by assuming zero dividends.


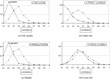
Distributions of unconditional and conditional cross correlations of security returns of the top 50 stocks of the FTSE 100 and TWSI, from 1 November 1997 to 31 October 2002.
For the period concerned, the top 50 stocks of the TWSI are found to have persistently higher levels of correlation than the top 50 stocks of the FTSE 100; their average unconditional correlations, for instance, are 0.338 and 0.181, respectively. The correlation standard deviation of the top 50 Taiwan equity market is nevertheless not much higher than that of the United Kingdom. Furthermore, when the comparison is conducted across different market conditions, both U.K. and Taiwan top equity markets are found to exhibit a common pattern of a markedly higher level of return correlations particularly in the downside market.18
However, unlike the simulation results, here we do not observe a significantly higher level of return correlations in the upside market.
What are the implications of the above two observations? Given these empirical results of return correlations from one developed and one emerging markets, it is still difficult to draw any direct implications on the relations between the herd effect and asset dependency. However, there are observations of interesting patterns when comparing these empirical results with the simulation outcomes reported in the previous section. First, a comparison between the correlation patterns of the real data and of the simulated markets suggests that the models characterized by herding behaviour will generate simulation results closer to the real patterns of asset dependency than the static artificial market of isolated agents. Second, both of the top 50 U.K. and Taiwan equity markets exhibit the patterns of asymmetric conditional correlations. This finding shows consistency with the finding in many previous empirical studies. To be more rigorous, a set of econometric tests following Hong et al. (2004) is introduced and conducted here in order to examine whether or not the observed pattern of asymmetric return correlations holds true in both of these two greatly different equity markets.
Testing Symmetry of Exceeding Correlations
Hong et al. (2004) following Ang and Chen (2002) consider a test of the symmetry of return correlations when returns are both very large and very small. The idea is simple. Let r1 and r2 be two returns standardized to have mean zero and variance one. Based on the sample observations, for r1t and r2t that are greater than the threshold level c, we can compute a correlation coefficient, that is, the correlation for exceedingly large returns. For those r1t and r2t that are less than the threshold level −c, we can compute another correlation coefficient, that is, the correlation for exceedingly small returns. These correlation coefficients are the “exceedance” correlations in Hong et al. (2004) but will be referred to as the exceeding correlation at the level c in the section. A test of return correlation symmetry now can be constructed by comparing these two exceeding correlations.
Formally, the exceeding correlation at the level c is defined as the correlation of the standardized returns r1 and r2, conditional on both returns exceeding c standard deviations from their respective means. For example, for c = 0, the correlation coefficient is computed conditional on the pair of returns both greater (or less) than their respective means; for c = 1, the correlation coefficient is computed conditional on the pair of returns both deviating from their respective means by one standard deviation. The exceeding correlations at the level c is defined by


The null hypothesis for the symmetric correlation test is given by

Let
denote the number of observations that both r1t and r2t are greater than c. The sample average of those r1t such that r1t and r2t are greater than c at time t is then calculated by

where 1A is the indicator function of the event A. Similarly,
is the number of observations for which both r1t and r2t are less than −c at time t, and the sample average of those r1t such that r1t and r2t are both less than −c at time t is given by

The corresponding sample variances are, respectively
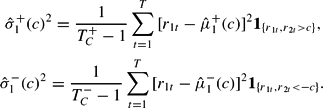
Analogous notations
,
,
, and
are defined for r2t in the same fashion.
Consider now further standardization of r1t using the sample averages and sample variances given earlier:

Similarly, r2t can also be standardized as
and
. Based on these standardized returns, the sample exceeding correlations are defined as

A test of the null hypothesis can be constructed by checking whether
is sufficiently close to
for various choices of c. Given m levels of c1, …, cm, let

Hong et al. (2004) proposed the following joint test statistic for the null hypothesis of symmetric correlations.

where
is a consistent estimator of the asymptotic variance-covariance matrix Ω. It is shown in Hong et al. (2004) that the asymptotic null distribution of Jm is the chi-square distribution of degrees of freedom m, χ2(m).
When implementing the symmetry test of return correlations, several steps need to be clarified. The standardized returns are first computed using the full-sample means and variances. In order to compute the joint statistic Jm, m levels of c1, …, cm need to be chosen. Note that in Hong et al. (2004) following Ang and Chen (2002), m=4 with the levels of c1=0, c2=0.5, c3=1, and c4=1.5 are chosen. Here the computation of the test statistic also will be based on these four exceedance levels. The vectors of sample exceeding correlations are thus computed as
and
. The Newey-West (1987) estimator
, consistent with the asymptotic variance-covariance matrix Ω, is computed. Note that
is a 4 × 4 matrix in this application. Specifically, let

where


The Newey-West estimator, for a chosen truncation lag p (a positive integer), is
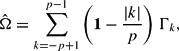
where the (i, j)th element of Γk is γk(ci, cj). There are different ways to determine the truncation lag p. Instead of using a data-dependent method, here the lag is set as p≈T1/3, which is also a common choice in applications.
The results of symmetry tests for exceeding return correlations of the top 50stocks from FTSE 100 are not reported for lack of space but are available from the authors on request. We present here a sketch of our findings. We calculate the results when there are at least 15 observations such that the pair of stock returns both satisfies the condition of exceeding one standard deviation of their respective means. Recall that there are 1,225 pairs of return correlations from the top 50 stocks of FTSE 100. A total of 473 correlation pairs are reported, and their sample correlation coefficients, test statistic, and associated are computed. Among these 473 test results, it is found that 140 pairs of stock returns have less than 5%. Hence, the null hypothesis of symmetric exceeding correlations is rejected statistically for these 140 stock pairs at 5% significance level. This amounts to nearly 30% of all the results. By contrast, at 10% significance level, it is found that the symmetry null hypothesis is rejected for 182 stock pairs, which amounts to 38% of the total results reported.
We repeat these calculations using a higher exceedance level c = 1.5 for the returns but a lower threshold level, 10, for the number of observations. We compute the test results when there are at least 10 observations such that the pair of stock returns both satisfies the condition of exceeding 1.5 standard deviations of their respective means. Based on the criteria, the number of relevant correlation pairs has reduced markedly to 31. Among these 31 correlation pairs, it is found that six of them have p-values less than 5%. Hence, the symmetry null hypothesis is rejected at the 5% significance level for six correlation pairs of a total number of 31 pairs. The rejection rate of symmetric exceeding correlations is approximately 20% in this case. By contrast, at the10% significance level, the rejection rate is nearly 30% as there are nine return pairs of 31 that reject the null hypothesis of correlation symmetry.
Comparing the first result with the second results, the rejection rates obtained suggest that, when the threshold exceedance level is higher up (from c = 1 to c = 1.5), the tendency of observing asymmetric correlations is in fact lower using the FTSE 100 data (from approximately 30% to 20% at the 5% significance level, and from approximately 38% to 30% at the 10% significance level). The drop in the symmetry rejection rate is about 10% at both significance levels. This has an important implication. In the event of extreme stock returns, upside and downside correlations are less likely to be asymmetric in the top 50 U.K. equity market. However, it also should be clarified that, in either case, there is nontrivial evidence of asymmetric correlation patterns found in the top 50 U.K. equity market. We shall come back to this point in the conclusion section.
We also compute the results of symmetry tests for exceeding return correlations of the top 50 stocks from TWSI. The test results are when there are at least 15 observations such that the pair of TWSI stock returns both satisfies the condition of exceeding one standard deviation of their respective means, that is, c = 1. Among the 1,225 pairs of return correlations from the top 50 stocks of TWSI, there are a total of 672 pairs. Among these 672 correlation pairs, 189 pairs are found to have p-values less than the 5%. Hence, the symmetry hypothesis is rejected statistically for these 189 correlation pairs at the 5% significance level. This amounts to a rejection rate of 28%. By contrast, at the 10% significance level, the symmetry hypothesis is rejected for 247 pairs, which amounts to approximately 37% of the results reported.
Again, results are obtained using a higher exceedance level c = 1.5 for the returns but a lower threshold level, 10, for the number of observations. Thus, we compute the test results when there are at least 10 observations such that the pair of stock returns both satisfies the condition of exceeding 1.5 standard deviations of their respective means. The number of relevant correlation pairs now reduces markedly from 672 to 29. The symmetry hypothesis is rejected statistically at the 5% significance level for 11 correlation pairs out of a total number of 29 in this case. The rejection rate amounts to nearly 38%. By contrast, at the 10% significance level, the symmetry hypothesis is rejected for 15 pairs of 29, which gives a rejection rate of a little more than 48%.
The test results obtained from the top 50 stocks of the Taiwan equity market show statistically clear evidence of considerable levels of asymmetric exceeding correlations at both the 5% and the 10% significance levels. Furthermore, a comparison between the results of the U.K. and Taiwan markets demonstrates similar rejection rates of correlation symmetry, when the exceedance level is c = 1 and the threshold observation number is 15. More specifically, both markets have a rejection rate of approximately 30% at the 5% significance level and a rate of approximately 40% at the 10% significance level. This similarity regarding the statistical rejection of symmetric correlations is indeed a surprising observation, as these two markets are different in many ways; in particular, one is a developed market while the other is an emerging market, and their association is far weaker than those in the same geographical region where immediate financial contagion is possible.
Nevertheless, the test results of these two markets do differ largely when the exceedance level is c = 1.5 and the threshold observation number is 10. As discussed earlier, the symmetry rejection rate reduces by nearly 10% in the top 50 U.K. equity market with a higher exceedance level c = 1.5 and a lower threshold observation number 10. On the contrary, for its counterpart results from the Taiwan market, it is seen an increase in the symmetry rejection rate by around 10% instead (from 28% to 38% at the 5% significance level, and from 37% to 48% at the 10% significance level). Therefore, unlike its U.K. counterpart, the top 50 Taiwan equity market in fact is more likely to have asymmetric upside and downside correlations in the events of extreme stock returns. Finally, Table 3 provides a summary of the results given earlier. The count number of relevant correlation pairs satisfying the prespecified exceedance level and threshold observation number is summarized, together with the number of statistical rejections of the null hypothesis and its ratio out of the relevant total count.

CONCLUDING REMARKS
This paper investigates the herd effect on asset dependency. The level of cross correlations in security returns is examined through the dynamic impact of rational imitative learning among agents endowed with heterogeneous expectations in price forecasts. The static model with isolated noninteracting agents is set as the benchmark model for comparison. In a simple but tractable setting, it is demonstrated analytically that imitation driven by profit motives indeed leads to asset dependency. The simulation results, based on more complex but realistic assumptions, also support the theoretical analysis. The results show that, unlike the benchmark model that generates virtually zero cross correlations in security returns, herding endogenously induces a significant level of asset co-movements.
This work contributes to the literature in that it demonstrates, both analytically and numerically, a sustainable causality relation between herding and asset dependency. This relation is further established unexpectedly in the reverse direction, by another major observation in this study that herding is found to be most pronounced under abnormal market conditions. More specially, the present study uncovers a self-reinforcing process, in which herding by the vast majority induces dependency across assets, which leads to abnormal market conditions and, hence, amplifies the herding phenomenon, which again further exacerbates asset dependency. Therefore, the implications of the present model are of significant relevance in understanding the making of extreme market events.
It is noteworthy that this observation, namely, a higher level of asset dependency in extreme markets, is consistent with the finding by several empirical studies, such as that of Silvapulle and Granger (2001) and a more recent work by Sancetta and Satchell (2003). Using daily returns on 30 Dow Jones Industrial stocks for the period 1991–1999, Silvapulle and Granger (2001) adopt the value-at-risk approach to investigate the validity of portfolio diversification when there are negative large movements in the stock returns. They find that the average conditional correlation of 30 stocks is much higher when the market is bearish and therefore suggest that the benefits of portfolio diversification would be eroded consequently. Sancetta and Satchell (2003) use Sharpe's factor model to provide an explanation to the observed higher level of cross correlations in large market falls. They argue that this pattern of nonconstant correlations is due to the fact that one crucial factor, namely, the market, has become increasing important in extreme conditions.
The levels of return correlations in the U.K. and Taiwan equity markets are also studied in this paper. In particular, the present work contributes to the literature of the asymmetric patterns of return correlations by conducting empirical econometric tests of correlation symmetry, based on the methodology provided in Ang and Chen (2002), and Hong et al. (2004). Using the datasets of the top 50 stocks in Taiwan and U.K. equity markets, the test results show statistically nontrivial rejection rates of correlation symmetry in the event of extreme returns. This is particularly true in the case of Taiwan where considerable evidence of asymmetric exceeding correlations is found at both 5% and 10% significance levels. This finding of asymmetric correlation patterns in the top 50 stocks in both Taiwan and U.K. equity markets has implications for risk management. In both cases, diversification as a means of managing portfolio risk is unlikely to be effective in periods of extreme losses. Moreover, it is likely to be less effective for Taiwan than for the United Kingdom, given the results of our econometric tests. However, there are means other than portfolio diversification for risk management; for instance, one could use Index Puts to provide a means of downside protection for equity portfolios. It is also noteworthy that when comparing the empirical results with the simulation outcomes, one important observation emerges. It is found that models in the presence of herding generate results closer to the real patterns of asset dependency than the static benchmark model with isolated agents. Nevertheless, whether the observations have any implication on the level of herding in these two much different markets, or any implication on the effects of other characteristics, such as localness19
Compared with many international corporations in the U.S. or the U.K. markets, most Taiwanese companies are “local” in the sense that they are small and medium enterprises (SMEs).
There is an important social aspect closely related to the investor behavior modeled in this study; to quote MacKenzie (2003), the financial markets are not an imperfectly insulated sphere of economic rationality, but a sphere in which the “economic” and the “social” interweave seamlessly … the key “social risks” seem to come from inside the financial markets rather than from outside. Herding, even if rational, can be viewed as a key internal social risk, following the terminology of MacKenzie (2003). This form of social risk enters the sphere by reshaping the investor ecology, most of the time uneconomically. In the present model, imitative learning results in a temporary, fragile convergence on the outperforming investment strategy. The stability depends on the learning pace, which is in reality influenced by institutional conditions. The nature of instability and fragility is partly what brings about the internal risk. By contrast, convergence, even a temporary one, implies a certain degree of homogeneity which has a counterintuitive implication on stability. The idea can be grasped by that a small error can snowball due to the lack of offsetting effects that could otherwise arise with heterogeneity. When information is incomplete and agents are boundedly rational, homogeneity may not be superior to heterogeneity in stabilizing the market.
It might be thought that it is obvious that herding/imitation in investment strategies leads to asset correlations. We disagree with this position, and the logic is described as follows. The issue here concerns whether herding, as a temporary, fragile convergence of investment behavior, can indeed lead to a significant level of asset dependency over a relatively long horizon. It is a danger to presume that a current winning investment strategy will remain successful in future trading periods and continue to attract investors. The market is not static but dynamically changing, and so is the winner. Indeed, as unfolded later in this study, the market dynamics is a result of complex interaction between changing forecasts and investor ratios. Current success by no means guarantees future success. In fact, more people practicing the same strategy will give a higher incentive for a deviant to exploit the situation. This is where the winner loses its lead. Therefore, it should be noted that herding/imitation among market participants in no way automatically implies asset dependency.
The present study is of considerable relevance for financial regulators. Previous studies, including those of Grinblatt, Titman, and Wermers (1995), Scharfstein and Stein (1990), and Welch (2000), have documented significant evidence of herding among mutual fund managers and financial analysts. Indeed, one of the standard features of institutional investment, at least in the United Kingdom, is to use the median fund manager of a given universe as a benchmark; two such manager universes are the Combined Actuarial Performance Services (CAPS) and World Markets (WM) whose members together hold approximately 40% of U.K. equities. It is widely thought that peer-group benchmarks are systematically flawed. An in-depth related investigation was conducted in producing part of the Myner's Report (2001); in Sections 3 and 5 of the Report, it is specifically recommended that the use of peer-group benchmarks should be discouraged. In addition, the concern presented in this study can be broadened to the level of international finance, in that the models may be modified to be utilized for testing contagion in the international financial markets.
There are efforts in progress to prohibit mediocrity such as the discontinuance of peer-group benchmarks and to discourage herding behavior in financial markets. Nevertheless, by contrast, much literature has argued for a higher level of transparency in financial systems. These two perspectives would evidently bring about conflict. The benefits of a transparent financial system have been widely studied, but there are relatively few studies that inquire into its potential costs. Hasbrouck (1988, 1991), Gemmill (1996), Madhavan (1996), and Pagano and Roell (1996), respectively, support the viewpoint that transparency is socially desirable in light of the following issues: fairness, efficiency, and adverse selection problems. However, regulatory changes that make investment behavior more transparent and make individual investors more aware of other investors' actions can enhance uniformity of action and bring about the opposite of the intended purpose. A good balance needs to be obtained by taking into account both the desirable features of transparency and the potential risk in information exposure and the public's spurious response.
APPENDIX A
Following the market equilibrium equation (5), we assume Rf = 1,
, and zero dividends, and consider a simple case of two investor types: value investors with a fraction of 1−θt, and technical traders with a fraction of θt. (5) can be rewritten as

where
denotes the S × 1 vector of price forecasts made at time t by investor i, and it is defined in a way consistent with (7), (8), and (9):

The equilibrium price (A.1) now becomes

Define
. It is an S × S diagonal matrix whose diagonal entries are the entries of
so that
. (A.3) can be rewritten as

Multiplying both sides by
(by definition, we know that
exists), (A.4) can be rearranged as
. (A.5)
Let
and
. (A.5) is then given by
.
APPENDIX B
Let
,
, and
,
.
To isolate the ex-ante correlation effects, we assume that the S transformed prices in
are independent, so that
is a diagonal matrix. For convenience, write
,
.
Define
, where
for i = j, and sij = 0 for i≠j.
is an S × S diagonal matrix. Similarly,
is an S × S diagonal matrix defined by
, where
for i = j, and kij = 0 for i≠j.
We approximate θt and
using the first-order Taylor's expansion.


Thus,
, and
.
Let
and
;
.
The Jacobian matrix J is assumed to be diagonal, that is, no prior belief in asset dependency in the forecast function
.
The covariance of At is calculated by

Since J and Ωq are diagonal matrices, it is easy to show that
is also a diagonal matrix. Therefore, when θt is fixed at θ, the covariance matrix of
,
, is also a diagonal matrix.
Now we proceed to prove the result (ii) in Proposition 2.
The expectation of qr is given by

The covariance of
is given by

We now calculate the first term on the right-hand side (RHS) of (B.5).

The constituent terms in (B.6) are calculated here.



Thus, (B.6) is given by the following:

Substituting (B.10) into (B.5) and from
given by (B.4), we finally obtain
.

Recall that J, Ωq,
,
, and
are all diagonal matrices, and
is a vector. First, it is straightforward to show that the sum of the terms on the third line on the RHS of (B.11) is diagonal. Second, when μ = 0S, all the terms on both the first and second lines on the RHS of (B.11) vanish. Therefore, when μ = 0S,
is a diagonal matrix given by
.
When μ≠0S, it is clear that the fourth term (JΩqμμ′ Ω′qJ′) on the RHS of (B.11) is a nondiagonal symmetric matrix. Also, all the other terms on both the first and second lines on the RHS of (B.11) are nondiagonal matrices as long as
. Therefore when μ≠0S,
is a nondiagonal matrix.
APPENDIX C
IS is the S × S identity matrix and 1S is the S × 1 vector of 1s.
denotes the equal fractions of investor types in the NA model. Also,
means that the dividend process of each security is uniformly distributed between 0 and 1.

APPENDIX D

FIGURE D.1. The market indices of the FTSE 100 and TWSI from 1 January 1997 to 31 October 2002.
Steffi Yang is a Research Fellow of the British Academy and Wolfson College. Financial support from Bill and Melinda Gates Foundation is gratefully acknowledged. The authors wish to thank Mark Salmon for his useful comments. Any error remains the responsibility of the authors.