Introduction
Lameness in dairy cattle is a continuing problem that greatly affects the welfare of the animals (Farm Animal Welfare Council, 1997) and causes reduced productivity and poor performance (Warnick et al., Reference Warnick, Pelzer, Meadows, diLorenzo and Whittier1995). Several factors that affect dairy cattle lameness have been suggested. Housing environment (e.g. pasture, concrete floors) has been found to be significantly associated with locomotive problems (Gitau et al., Reference Gitau, McDermott and Mbiuki1996; Somers et al., Reference Somers, Frankena, Noordhuizen-Stassen and Metz2003), and both time of year and time post calving have been shown to affect lesion formation and locomotion (Offer et al., Reference Offer, McNulty and Logue2000; MacCallum et al., Reference MacCallum, Knight, Hendry, Wilde, Logue and Offer2002). Body weight (BW) reflects changes in size and shape of animals over time (Monsi, Reference Monsi1992), and may affect locomotion negatively. Singh et al. (Reference Singh, Ward, Lautenbach and Murry1993) showed that lame cows lay down for longer periods than healthy cows and so consumed less food. Even when grazing, lame cows tended to lay down for longer and ate for shorter periods than healthy cows.
Reports on the effect of lameness on milk production levels of cows have varied among researchers. Green et al. (Reference Green, Hedges, Schukken, Blowey and Packington2002) analysed test-day yields from 900 cows on five farms and estimated a 360 kg reduction in milk yield per 305-day lactation. Warnick et al. (Reference Warnick, Pelzer, Meadows, diLorenzo and Whittier1995) observed that milk yield was reduced for up to 2 weeks before lameness was recognised, perhaps resulting from reduced intakes and negative energy balance. Other authors have reported an increase in milk yield (Barkema et al., Reference Barkema, Westrik, van Keulen, Schukken and Brand1994) and no change in milk yield (Martin et al., Reference Martin, Aziz, Sandals and Curtis1982).
A UK governmental study (Lobley et al., 2001) concluded that many livestock areas will show further polarisation between intensively managed dairy farms and more extensive enterprises. Larger dairy farms will expand and intensify while smaller farms will move to more extensive systems. Intensive dairy farms are characterised by high-yielding cows fed high levels of concentrates and housed indoors much (if not all) of the year. The genetic correlation between production and health traits is generally unfavourable (Pryce et al., Reference Pryce, Esslemont, Thompson, Veerkamp, Kossaibati and Simm1998) and selection for yield has resulted in increased mastitis, fertility problems and lameness. Research into the effects of intensive management on health traits is not well documented but, with the increase in high-input farming systems, is an area that requires monitoring.
The aims of this study are (1) to examine the functional relationship between locomotion score and explanatory variables such as management regime, (2) to evaluate the association between daily milk yield and locomotion score and (3) to investigate the effect of lameness on the shape of the lactation curve.
Material and methods
Data
The data used in this analysis were collected from the Langhill herd at Crichton Royal Farm in Dumfriesshire, Scotland between 2003 and 2005. The herd comprised two genetic groups: control (C) (daughters of average bulls in the UK for fat + protein yields) and selected (S) (daughters of highest ranking bulls in the UK for fat + protein yields). Cows were randomly allocated to two management regimes, XE (housed all year round and fed a high-concentrate and low-forage diet) and XM (cows allowed to graze from April to October and receiving at least 75% diet DM from forage), at first calving and they remained on the same regime until they were culled or removed from the experiment. Cows calved all year round.
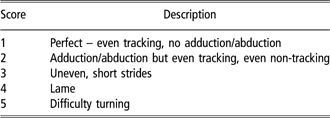
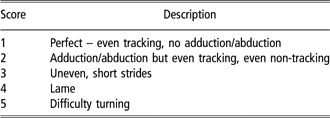
Data were obtained from five lactations. Incidence of lameness on the farm was described using a locomotion scoring technique shown in Table 1. The method is based on the system of Manson and Leaver (Reference Manson and Leaver1998), and uses a 5-point scale, where a 1-point score depicts sound (normal) and 5 reflects difficulty in turning.
Locomotion scoring system used at Crichton Farm
Each cow had multiple records depending on how often she was locomotion scored. Animals in the study herd calved between 22 (1st lactation) and 84 (5th lactation) months of age (age at calving) and were within 1 and 350 days in milk (DIM). Three trained technicians undertook both locomotion scoring and body condition scoring (BCS) weekly. All cows were locomotion scored as they left the milking parlour, i.e. on the same surface. BCS was recorded on a standard subjective scale of 0 to 5 with quarterly increments (Lowman et al., 1976). Maximum BCS recorded for cows was 4. The cows were milked three times per day and each cow was weighed as she left the milking parlour. Weights were expressed as a daily average.
Data were edited to remove extraneous observations or cows with extreme recordings (>4 standard deviations from the mean). Month of scoring was taken from date of recording, likewise month of calving from date of calving (both calendar months). After editing, 14026 locomotion records and 98651 daily milk yield records on 248 cows remained.
Statistical analysis
Locomotion study
Cows were grouped into 1st lactation cows and later lactation cows (2nd, 3rd, 4th and 5th lactation) as there were few 3rd (106), 4th (54) and 5th (20) lactation animals. There were 163 1st lactation cows, 73 in group XM and 90 in group XE; 79 in group S and 84 in group C. The later lactation group comprised 180 cows and 313 cow lactations. There were 95 later lactation cows in group XM and 85 in group XE; 84 in group S and 96 in group C. First lactation cows and later lactation cows were analysed separately.
The statistical model is

where Yijk = kth locomotion score (1 to 5) on the jth cow with ith fixed factors and covariate measurements; μ = mean; Fi = effect of ith fixed factors – month of locomotion scoring, month of calving (MOC), management group, management group × month of scoring interaction, genetic group, year of inspection, lactation number (for cows only), technician undertaking the scoring and ith linear and quadratic covariates – BCS, BW, age at calving; Cij = random effect of cow; eijk = residual random error.
In addition, in the analysis of later lactation cows, a cow lactation random term was included in the model to account for repeatability across lactations.
The order of fitting of variables was varied (each after all others) so that F-statistics were conditional on all other effects in the model. Including cow identity as a random effect in the model linked all observations on each cow.
The analysis described above includes month of locomotion scoring and month of calving as fixed effects but the results do not explicitly give information on the association between the time from calving (i.e. DIM) and the locomotion score. To address this, and avoid any problems with aliasing, the analysis was repeated excluding month of locomotion scoring from the model and including DIM as a linear and quadratic covariate. A further analysis allowed the regression of locomotion score on DIM to vary depending on the month of calving.
All analyses were performed using residual maximum likelihood (REML) in the software package R (Venables et al., 2005).
Milk yield analysis
The objective in this analysis was to evaluate the association between milk production of heifers and cows and locomotion score. The trait, therefore, was daily milk yield. The basic model of analysis was as above, but excluded classifier and month of locomotion scoring. In addition to other variables, DIM (as a 3rd order polynomial), locomotion score, month of milk recording, management group × month of calving interaction and interactions between locomotion score and both management group and genetic group were included in the model.
Analysis of ‘lame or never lame’ cows
A further investigation examined differences in the shape of the lactation curves of cows that were scored lame during the lactation and those judged never lame. For the purpose of this analysis, cows locomotion scored 1 or 2 were considered sound (never lame) while those scored 3, 4 or 5 were classified as lame. Lame cows were grouped into those that became lame on or before 60 DIM (i.e. before the time of peak yield) and those that became lame after 60 DIM. For this analysis we used the same model as for the analysis of milk yield but fitted a separate lactation curve for each group of cows. This analysis allowed us to statistically compare curve coefficients across groups. A similar analysis was not performed for heifers because a preliminary analysis indicated no significant variation in their milk yield due to locomotion score.
Results
Locomotion study
Locomotion score was assumed normally distributed and analysed using a simple linear mixed model. Although residuals were not perfectly normally distributed (slightly skewed and leptokurtic), they did not deviate sufficiently from normal to justify a more sophisticated analysis.
The average locomotion score for the herd was 2.04. Only 11% of the cows in the herd were lame at any point during the lactation, i.e. scored ⩾3. For lactation 1 animals, locomotion scores ranged from 1 to 4, with 82 heifers being scored 3 at least once and 70 receiving at least one score of 4. For later lactation cows, locomotion scores ranged from 1 to 5, although only four cows (each with many scores of 4) were locomotion scored 5. There were 117 cows with at least one score of 3 and 110 with one or more locomotion scores of 4.
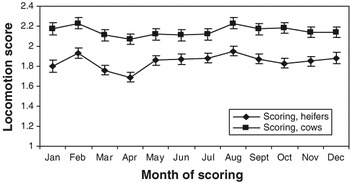
Figure 1 shows the fitted lameness values by month of locomotion scoring for heifers and cows. Solutions for month of locomotion scoring are relative to January. Month of scoring was significantly (P < 0.001) associated with the locomotion of heifers and cows in a similar pattern. However, the graph shows that later lactation cows were more susceptible to increased locomotion disorders than heifers. After adjusting for management group, winter and summer months were the highest risk periods with peak rise in herd lameness occurring in February and August. Mid to late spring (months 3 to 4) were the safest period. There was a steady but slow increase in lameness incidence from mid autumn through the winter months.
Predicted incidence of lameness by month of scoring. Month of locomotion scoring for heifers (⧫) and month of locomotion scoring for cows (▪) are shown. For X-axis, Jan = January, Feb = February, Mar = March, Apr = April, Jun = June, Jul = July, Aug = August, Sept = September, Oct = October, Nov = November and Dec = December.

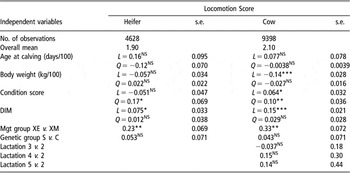
Table 2 shows the least square estimates for locomotion score for both heifers and cows.
Least square mean estimates of explanatory variables for locomotion score of heifers and cows. Note that, when DIM was included in the analysis of locomotion score, month of inspection was omitted from the model

L = linear coefficient; Q = quadratic coefficient; DIM = days in milk; Mgt = management; s.e. = standard error.
DIM as included in the model = (actual days in milk−175)/175 and so values lie between ±1.
There was a significant (P < 0.001) linear association between BW and the locomotion of cows in later lactation. The estimated effect was negative (a linear regression coefficient of −0.14 for a 100 kg difference in BW), indicating that a lower BW was associated with increased locomotive problems. The condition score of both heifers and cows was significantly associated with their locomotion score. Animals with a higher body condition had higher locomotion scores. No significant association between locomotion score and parity was detected.
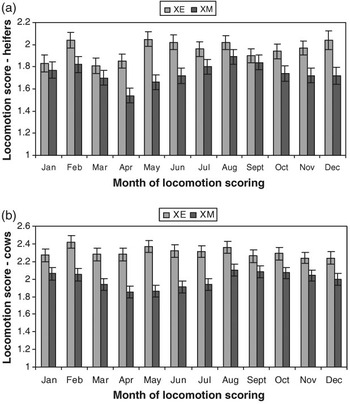
There was a significant association between management group and the locomotion of both heifers and cows and management group × month of scoring interaction was also significant for all animals. Cows in the XE group (housed all year and fed a high concentrate + low-forage diet) suffered an increase in lameness compared with those in group XM (at grass in the summer months and fed low concentrate + high forage). Figure 2a and b show average locomotion score by month of locomotion scoring for heifers and cows in both management groups. It is clear that, irrespective of when the animals were locomotion scored, heifers and cows in the XE group had a higher mean locomotion score than those in the XM group, and this difference varied depending on the time of year of scoring. During early summer, lameness decreased in the animals turned out to graze, whereas in summer lameness was at a higher level for heifers and cows housed all year round.
(a) and (b) Predicted influence of management group on locomotion of heifers and cows. (XM ▪= at grass in summer/fed a low concentrate diet) and (XE ▓= housed all year/fed a high concentrate diet). Labelling for X-axis is the same as in Figure 1.

When month of locomotion scoring was replaced by DIM in the model, there was a significant association between time post calving and locomotion for both heifers (P < 0.05) and cows (P < 0.001). These associations were linear, indicating that locomotive problems increased with DIM. However, repeating the analysis and allowing the linear and quadratic coefficients to vary depending on the month of calving indicated that the relationship between locomotive problems and DIM varied depending on the month of calving. For calvings from December to April, locomotive problems were, in general, at a minimum in mid-lactation (i.e. during summer), whereas for summer and autumn calvings the incidence of locomotive problems increased with DIM.
In all analyses the cow variance component and the cow lactation variance component were significantly different from zero, indicating repeatability of locomotion problems within lactation (for both heifers and cows) and across lactations (cows).
Milk yield analysis
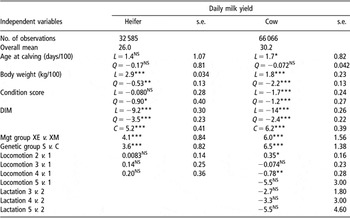
Month of calving and its interaction with the management group removed no significant variation in the milk yield of both heifers and cows. For heifers, no significant associations were detected with age at calving, locomotion score and interactions between locomotion score and management group and locomotion score and genetic group. For cows, there was no significant association between parity and yield. All other variables included in the models were statistically significant. Results (Table 3) showed a quadratic association between BW and yield, with heavier animals producing more milk. Similarly, a quadratic association between BCS and milk yield was observed for both heifers and cows, with very thin animals and fatter animals producing less milk. For cows, a locomotion score of 4 was associated with a 0.78 kg loss in daily milk yield compared with cows scored 1. The association between locomotion score and milk yield varied depending on the management group and the genetic group.
Least square mean estimates of explanatory variables for milk yield of heifers and cows

Note that, when days in milk (DIM) were included in the analysis of locomotion score, month of inspection was omitted from the model. L = linear coefficient; Q = quadratic coefficient; C = cubic coefficient; Mgt = management; s.e. = standard error.
DIM as included in the model = (actual days in milk−175)/175 and so values lie between ±1.
Management group XM was associated with a lower milk production, compared with group XE (the high-concentrate group). Differences between management groups were 4.1 and 6.0 kg for heifers and cows, respectively.
As expected, this study recorded lower milk production in the control genetic group than in the select genetic group. Select heifers produced approximately 3.6 kg more milk daily than the control heifers while select cows in later lactation gave 6.5 kg/day higher milk yield compared with the control cows.
Analysis of ‘lame or never lame’
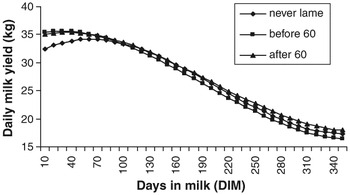
There were no significant differences in the average 305-day yield of cows never lame, those lame before day 60 and those lame after day 60. Results (Figure 3) indicate that the group of cows that was lame early in lactation had a higher average milk yield during the first few weeks of lactation than cows never lame or those lame after day 60. A significant difference (t-test, P < 0.001) in the quadratic coefficient was found for the lactation curves of sound cows and those lame before 60 DIM. There were significant differences (P < 0.05) in the linear, quadratic and cubic coefficients of cows never lame and those lame after day 60. In addition, there was a significant difference (P < 0.05) in the linear coefficients of cows lame before day 60 and those lame after day 60. These differences in curve coefficients indicate that the shape of the lactation curves differed statistically between the three groups of cows. If we define persistency as the ratio of the average yield on day 280 to the average yield on day 60, the persistency of sound cows was higher (58%) than that of cows lame before day 60 (55%).
Milk production curves for lame v. non-lame cows. Cows lame before 60 DIM (▪), cows lame after 60 DIM (▴) and cows never lame (⧫).

Discussion
Locomotion study
This study considered locomotion score rather than the more usual lameness recording. Lameness is typically recorded on a present or absent basis, with the threshold between these two outcomes somewhat subjectively defined. Locomotion scoring gives additional information on the gait of the animals and can identify varying degrees of lameness and provide an indication of the presence and severity of foot problems.
The range in locomotion scores was 1 to 4 for the heifers and 1 to 5 for cows. In essence, no heifer was severely lame. Hirst et al. (Reference Hirst, Murray, Ward and French2002) noted a steady increase in lameness with parity up to lactation 6, when the relationship began to level off. Increased clinical lameness as cows age has also been noted by Boettcher et al. (Reference Boettcher, Dekkers, Warnick and Wells1998), and Pötzsch et al. (Reference Pötzsch, Collis, Blowey, Packington and Green2003) found that white line disease lameness increased with increasing parity. We were, however, unable to detect significant differences in the locomotion scores of later lactation animals (parities 2 to 5). This is probably due to the small number of animals in each parity and the low proportion of lame and severely lame cows in our data.
Cows in management group XE were more prone to locomotive problems than those in XM. There are two main reasons for this. Firstly, cows in XE were housed all year round. In general, cows kept on pasture are likely to suffer fewer locomotion problems than those housed indoors (Gitau et al., Reference Gitau, McDermott and Mbiuki1996; Somers et al., Reference Somers, Frankena, Noordhuizen-Stassen and Metz2003; Onyiro and Brotherstone, Reference Onyiro and Brotherstone2008). Secondly, this group was fed higher levels of concentrate to support their higher milk yield. This has been associated with increased levels of lameness (Kelly and Leaver, Reference Kelly and Leaver1990; Livesey et al., Reference Livesey, Harrington, Johnstone, May and Metcalf1998). However, the effect of nutrition on levels of lameness is equivocal, as several studies have failed to show significant effects of feeding and suggest that increased lameness results from an interaction of several risk factors (calving, housing, metabolic and environmental challenges) (Bergsten and Frank, Reference Bergsten and Frank1996a; Olsson et al., Reference Olsson, Bergsten and Wiktorsson1998).
For both heifers and cows in group XM, locomotive problems were fewest during early summer but increased in August. According to the staff (oral communication), this could be due to farm tracks becoming firmer and cows having longer walks to more distant fields.
For both heifers and cows in group XE, locomotive problems were greatest in February and in the summer months, possibly due to the effect of continuous housing, high-concentrate feeding and changes in the support structure of the hooves associated with calving (Tarlton et al., Reference Tarlton, Holah, Evans, Jones, Pearson and Webster2002).
The association between BW and locomotion problems is not well documented. Webster (Reference Webster2001) studied the development of lesions in heifers and concluded that there was no association between lesion scores and BW. The results obtained in this study indicate that cows that were lame were also lighter in weight, possibly due to a reduction in appetite.
Many researchers report a significant association between DIM and lameness. Offer et al. (Reference Offer, McNulty and Logue2000) found significant effects of DIM on lesion formation, claw conformation and heel erosion. Tranter and Morris (Reference Tranter and Morris1991) noted that cases of lameness increased until around 100 DIM, then decreased, whereas Boettcher et al. (Reference Boettcher, Dekkers, Warnick and Wells1998) and Green et al. (Reference Green, Hedges, Schukken, Blowey and Packington2002) reported that lameness was more common during early lactation. This analysis shows that both DIM and month of calving (or DIM and month of inspection) should be considered when examining the association between lameness and stage of lactation as this association may vary depending on the month of calving or the month of inspection.
Milk yield analysis
Locomotion problems were associated with decreased milk production of cows in lactation 2 to 5, evidence that these problems may adversely affect milk production. A lame cow (locomotion score 4) was associated with an average loss of 0.78 kg of daily milk yield compared with a sound cow (locomotion score 1). Similarly, a locomotion score of 5 was associated with a reduction in milk yield of 5.5 kg. Note, though, that the high standard error of this estimate meant it was statistically not different from zero. This association between locomotion disorders and reduced milk yield is consistent with the results from other studies. An economic analysis of data from 21 Dutch dairy farms estimated that cows culled for lameness had 3.3 kg/day lower milk production than other cows (Enting et al., Reference Enting, Kooij, Dijkhuizen, Huirne and Noordhuizen-Stassen1997). Rajala-Schultz et al. (Reference Rajala-Schultz, Grohn and McCulloch1999) estimated 1.5 to 2.8 kg/day milk losses within 2 weeks after veterinary-diagnosed lameness in Finnish dairy cows. More recently, Green et al. (Reference Green, Hedges, Schukken, Blowey and Packington2002) concluded that lame cows have been higher producers that are failing to produce rather than cows that produce less milk.
Very low BCS and increased BCS were associated with decreased milk production in this analysis. BCS is measured independently of BW and frame size; thus, it is a reflection of the degree of subcutaneous fat deposition in the body. The rate of utilisation of this fat during lactation affects milk yield. No heifer or cow was considered obese (BCS = 5) by the scorer but some cows were thin (BCS = 1). Coffey et al. (Reference Coffey, Simm and Brotherstone2002) showed clearly that reduction in BCS as lactation progresses is less severe in heifers than later lactation cows, and is commensurate with the lower yield, feed intake and live weight exhibited by 1st lactation cows. A higher milk loss in relation to BCS was recorded for cows than for heifers. This may be due to successive lactations resulting in the substantive rapid depletion of body fat and protein reserves, and subsequently influencing milk yield.
‘Lame or never lame’ cows
The lactation yield of cows that were never lame was not significantly different from the yield of cows lame before day 60. However, the initial yield of cows lame before day 60 was higher than the yield of never-lame cows. This higher yield declined after the first quarter of lactation, indicating that high-yielding cows fail to sustain their high production capacity throughout lactation as a result of locomotion problems. Hence, profit would be greatest for cows that were never lame. The lactation yield of cows lame after day 60 was greater than the yield of cows that were never lame (difference of 214 kg; s.e. = 211), although this difference was not statistically significant. This does not advocate selection for cows with poor feet and legs but indicates that higher levels of milk production are associated with higher levels of locomotion problems. Deluyker et al. (Reference Deluyker, Gay, Weaver and Azari1991) also reported higher levels of lameness in herds with higher levels of milk production. High milk yield has also been associated with high levels of mastitis (Waage et al., Reference Waage, Sviland and Ødegard1998), poor fertility and reduced longevity (Collard et al., Reference Collard, Boettcher, Dekkers, Petitclerc and Schaeffer2000; Wathes and Taylor, Reference Wathes and Taylor2002), stressing the need for inclusion of health-and welfare-related traits as well as production traits in selection indices for herd improvement.
The group of cows recorded as sound throughout lactation had a higher persistency than those lame before day 60. Other researchers have also reported favourable associations between persistency and health. Harder et al. (Reference Harder, Bennewitz, Hinrichs and Kalm2006) estimated approximate genetic correlations between persistency of milk yield and claw and leg diseases in the range −0.13 to −0.46, and concluded that good persistency is associated with fewer claw and leg diseases. Muir et al. (Reference Muir, Fatehi and Schaeffer2004) estimated genetic relationships between lactation persistency and reproductive performance and concluded that selection for persistency has merit for genetically improving heifer reproductive performance.
The animals used in this study are part of a research herd. The main aim of the research at the farm is to develop sustainable breeding systems with particular emphasis on improving health and welfare. The locomotion scoring system at the farm was designed to be simple and effective so that as many farmers as possible would adopt it. However, the herd is a commercial herd and is managed in a profitable manner. Although management practices are good, there is no reason to suppose that results from this study cannot be applied to the general dairy cattle population.
Conclusions
This analysis has shown that the most important variables influencing locomotion in heifers and cows are management regime and time of year when locomotion scoring takes place. Cows housed all year and fed a high-concentrate diet are more prone to locomotive problems than those managed in a more extensive system. The difference is most obvious during the grazing season. A significant relationship between decreased BW of lactation 2 to 5 cows and increased locomotive problems was also found, which may reflect the loss of appetite suffered by lame cows. This study also concluded that locomotive problems adversely affect the milk production of dairy cows (but not during the 1st lactation), and that high-yielding cows are more prone to problems. The non-significant impact of genetic group on locomotion, irrespective of other factors, is an indication of good herd management.
Acknowledgements
We are grateful to the farm staff at Langhill for carefully recording the data used in this study over a long period of time. Special thanks to Ian White who painstakingly guided analysis of the data and Professor W. G. Hill for his useful comments and suggestions on the paper.