
Introduction
Porous media are materials that contain pores, i.e., void spaces that are embedded in the condensed phase of the material. Examples include rocks, clay, ceramics, membranes, and biologic tissue. Porous media continue to attract research interest stimulated by novel micro- and nanoscale engineering applications, e.g., in the biomedical[Reference Khanafer and Vafai1] and energy sectors.[Reference Tarascon and Armand2] These applications often pose multiple physics problems. For example, the utilization of non-woven fibrous membranes as filters or detectors depends on morphology, wettability, and interactions of dissolved components. A central research problem is the determination of effective properties that describe the behavior of a porous medium on macroscopic scales, i.e., the properties that are relevant and observable in laboratory or field experiments.
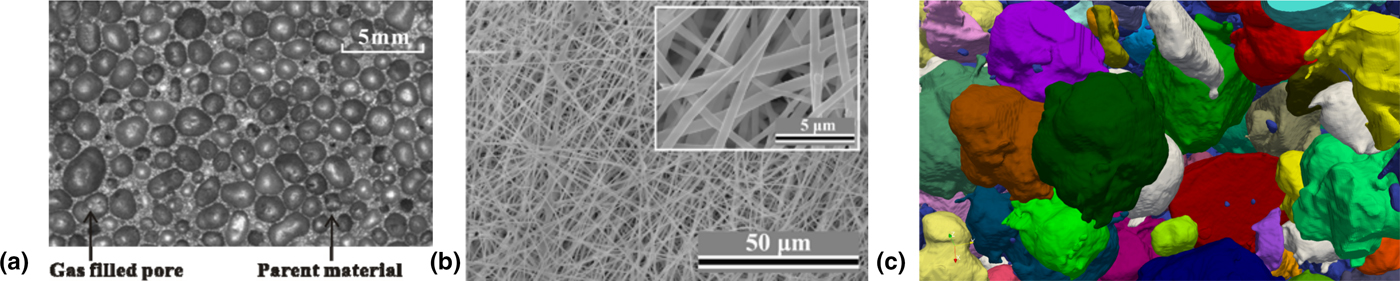
The challenge in describing the macroscopic dynamics effectively lies in the intricate structure of porous media. Three examples of different types of porous media are shown in Fig. 1. The pore sizes typically span a range of length scales, giving rise to complex morphology and topology that often exhibit significant heterogeneity and anisotropy. Consequently, the dynamics on the microscale are highly non-trivial and strongly influenced by the geometry of the pore space. Predicting macroscopic transport properties thus requires both an accurate representation of the geometry and sufficiently sophisticated models of the physical interactions.
Examples of different types of porous media. (a) Aluminum foam (porosity ϕ = 0.76) as a typical close-celled medium with non-spherical pores. Reproduced from Ref. Reference Yang, Lu and Kim3. © IOP Publishing. Reproduced with permission. All rights reserved. (b) SEM micrographs of YAG fiber membranes obtained from an electrospinning solution containing 1.5 wt. % PEO. The fiber membranes were electrospun at 30% relative RH and heat treated at 1000 °C. Reproduced from Ref. Reference Chen, Trofimov, Jacobsohn, Xiao, Kornev, Xu and Peng4. © Springer Science + Business Media New York 2017. With permission of Springer. (c) Mesostructure of lithium cobalt oxide reconstructed from a three-dimensional FIB/SEM image stack. The segmented active particles are shown in different colors. Reproduced from Ref. Reference Roberts, Mendoza, Brunini, Trembacki, Noble and Grillet5 with permission of ASME.

Considerable efforts have been spent on developing advanced imaging methods that can capture the structure of the pore space. Experimental techniques such as x-ray computed tomography and scanning electron microscopy (SEM) are now capable of providing three-dimensional (3D) images that resolve pores on the scale of microns and smaller.[Reference Blunt6, Reference Xiong, Baychev and Jivkov7] Such images provide information on the local properties of pore space at very high level of detail.[Reference Gueven, Frijters, Harting, Luding and Steeb8] This information can be used to construct computational models that can predict the flow and transport through the experimentally recorded pore space.
There are essentially two types of modeling approaches, namely, pore-scale[Reference Blunt, Bijeljic, Dong, Gharbi, Iglauer, Mostaghimi, Paluszny and Pentland9] and pore-network models.[Reference Xiong, Baychev and Jivkov7] While pore-scale models address the smallest scale and aim at predicting effective parameters that capture the specific interactions and surface effects for individual pores, pore-network models are mesoscale models that adopt effective models for single pores and predict the flow and transport through larger networks of pores. Pore-network models bridge between the pore-scale and the macroscale and rely on models that discard irrelevant features of the microscopic dynamics. In contrast, pore-scale models resolve a greater amount of detail and are therefore more accurate but also computationally more expensive. With increasing performance of available computing resources, however, the computational demands of pore-scale models have become less of a concern. On the other hand, direct bridging between the pore-scale and the macroscale implicates a need for improved pore-scale models that capture essential details of physico-chemical processes with sufficient accuracy and fidelity.
A number of computational approaches can be applied to porous media, including particle-based methods and density functional techniques.[Reference Meakin and Tartakovsky10] In recent years, the lattice Boltzmann method (LBM) has gained in popularity as a versatile mesoscopic method that can be used to model a range of physical processes beyond single-phase fluid dynamics. For instance, multiphase models[Reference Shan and Chen11, Reference Shan and Chen12] and electrokinetics solvers[Reference Capuani, Pagonabarraga and Frenkel13] have been successfully implemented in the lattice Boltzmann framework. Moreover, the underlying grid enables a straightforward representation of the porous geometry by dividing the grid into solid matrix and pore space. The LBM has been used to simulate a range of transport phenomena in a variety of different porous media.[Reference Gueven, Frijters, Harting, Luding and Steeb8, Reference Nabovati, Llewellin and Sousa14–Reference Ghassemi and Pak16] Such multiscale modeling and simulation can be a valuable aid in designing systems using functionalized porous media and tailored geometries. However, careful validation and optimization of computer models are imperative and require close feedback with experimentation. The path forward thus leads to an integrated approach that connects theory and experiments through multiscale modeling and data analysis.
In this review, we highlight the basic building blocks of an integrated approach for multiscale modeling of porous media. The remainder of the paper is organized as follows. In Section II, we discuss the mesoscale structure of porous media and how it can be recorded using advanced imaging techniques. In Section III, we highlight a few selected applications of porous media that are of timely interest and demonstrate the relevance of flow phenomena. Section IV introduces the basic mathematical formulations that are used to describe transport phenomena in porous media, and Section V reviews multiscale modeling approaches for numerical simulation of multiphysics properties across the scales. We summarize in Section VI and close with a discussion of challenges and future directions for multiscale modeling of porous media.
Mesoscale structure of porous media
Virtually all materials contain internal surfaces and phase boundaries and thus are porous media at the microstructure level. The length scales where this occurs can vary, e.g., from nanometers for porous silicon to meters for rocks and soils. Moreover, the shape, size, and connectivity of the pores give rise to a variety of microstructures. In most cases, a multi-level hierarchy of pore structures exists, and local variations give rise to heterogeneous morphology on larger scales. The length scale where the size and shape of pores and connecting throats is observed is commonly referred to as the “mesoscale”. The complexity of the mesoscale architecture influences the macroscopic properties of porous media, and the development of predictive models thus relies on the accurate characterization of the mesoscale structure.
The geometry of a porous medium is given by the partition of the sample into the solid matrix M and the pore space P. However, on macroscopic scales it is impractical to specify the geometry in full detail, and general characterizations of the geometry are sought. Commonly used characterizations of porous media include the porosity ϕ, hydraulic radius r h, and tortuosity T. The porosity is defined as the volume fraction of pore space, i.e., the ratio ϕ = V P/V bulk. In a porous medium filled with a single-phase fluid, the porosity can also be expressed in terms of the densities of the phases ϕ = (ρ M − ρ bulk)/(ρ M − ρ P). Porosity can be measured experimentally using, e.g., gas expansion or mercury intrusion porosimetry.[Reference Xiong, Baychev and Jivkov7, Reference Hilfer, Prigogine and Rice17] The latter can measure the open porosity only, i.e., the pore space that is connected to the surface of the sample. Another geometric quantity of interest is the specific internal surface S = A P/V bulk, which yields an inverse length and quantifies the surface to volume ratio of the porous medium. It can be measured using similar experimental techniques as for porosity, e.g., gas adsorption isotherms. A global characteristic radius of the pore space can be defined as the volume of pore space divided by its area R c = ϕV bulk/A P. The porosity, specific internal surface, and the characteristic radius are global properties of porous media, i.e., they do not capture local variations in the pore space which are characterized by local porosity and pore size. To quantify the local pore characteristics, the pore space is divided into individual pores by defining pore throats at the local minima of the hydraulic radius ratio R h = S/P, i.e., the ratio of the cross-sectional area S and the perimeter P of the cross-section.[Reference Kwiecien, Macdonald and Dullien18, Reference Dullien19] The partition of pore space allows one to define a pore-size distribution function Π(r) as the probability of finding a pore with a size smaller than r. An alternative to pore size distributions are local porosity distributions which are based on partitioning the porous medium into localized measurement cells.[Reference Hilfer, Prigogine and Rice17] The definition of specific internal surface carries over naturally to local specific internal surface distributions. Since the local porosity distribution depends on the partitioning into measurement cells, the size of the measurement cells can be varied in order to determine a correlation length up to which local variations are important. Beyond the correlation length the porous medium can be treated as homogeneous, however, if the porous medium is heterogeneous on all scales, a finite correlation length does not exist.[Reference Hilfer, Prigogine and Rice17]
While the porosity and pore size distributions describe local morphology in terms of volume and area ratios, they do not capture the connectivity of the pore space. The latter is important for transport phenomena that are primarily dependent on the connectedness of the pores by pore throats. The topological properties can be characterized by pore coordination number and the pore coordination spectrum, i.e., the distribution of pores connected by a certain number of pore throats. If two opposite surfaces of the porous medium (or the local measurement cell) are connected by a path through the pore space, the porous medium is referred to as (locally) percolating. The percolation threshold depends on the specific partitioning and percolation model.[Reference Hilfer, Prigogine and Rice17] A simplified measure of the topology of porous media is the tortuosity that characterizes the length of the pathways through pore space. It is defined as the ratio T = L i/L of the length L i of a complex convoluted path through a porous medium over a straight-line distance L. The tortuosity depends strongly on the properties of pore space, including porosity, specific surface, connectivity, and their respective distributions, in a non-trivial way.[Reference Panda and Lake20, Reference Garrouch, Ali and Qasem21] Hence, in practice a number of empirical models have been suggested that are often specific to certain types of porous media and experimental conditions.
The interpretation of experimental measurements is often based on simplified models of porous media such as the capillary tube model. In the capillary tube model, the pore space is modeled as an array of cylindrical tubes that do not intersect each other. The porosity of the capillary tube model is 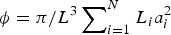 $\phi = \pi /L^3\sum\nolimits_{i = 1}^N L_ia_i^2 $, where N is the number of tubes in a porous medium of dimension L, and L i and a i are the length and the radius of the ith tube, respectively. Similarly, the specific internal surface is given by
 $S = 2\pi /L^3\sum\nolimits_{i = 1}^N L_ia_i$.
Experimental characterization of porous media
There are various ways to characterize porous media experimentally. Two common approaches are porosimetry and imaging. Mercury porosimetry is arguably the most common method to quantify the geometry of pore space.[Reference Xiong, Baychev and Jivkov7, Reference Hilfer, Prigogine and Rice17] It is based on the injection of mercury into the evacuated pore space as a function of external pressure. Since mercury has a high surface tension and is highly non-wetting, larger pores are filled first and the amount of injected mercury is an indicator of the fraction of pores that have a certain size. The pore size distribution can be extracted by relating the size of the pores to the capillary pressure of mercury through the Lucas–Washburn relation.[Reference Lucas22, Reference Washburn23] This interpretation of the measured injected volume is based on the capillary tube model and thus assumes that all pores are equally accessible. While more elaborate capillary network models can be used to provide more accurate pore size distributions for porous media with complex microstructure[Reference Xiong, Baychev and Jivkov7] mercury porosimetry can only be used to measure the open pore space and does not provide any connectivity information.
The surface area of pore space can be probed by gas adsorption.[Reference Sing24] Like mercury injection, gas adosorption is governed by surface tension and pressure. Depending on the targeted pore size and ambient conditions, adsorptives such as nitrogen, argon or carbon dioxide are used to determine the physical adsorption isotherms. A number of theories are available to interpret the measured isotherms, e.g., the BET (Brunauer–Emmett–Teller)[Reference Brunauer, Emmett and Teller25] or BJH (Barret–Joiner–Halenda)[Reference Barrett, Joyner and Halenda26] method. The interpretation methods rely on specific assumptions on the shape of the pores and the nature of the adsorbate; hence, the accuracy of the extracted pore size distribution can be limited for porous media whose microstructure differs from the assumptions.[Reference Xiong, Baychev and Jivkov7] For hierarchical microstructures, newer interpretation models have been developed that use simulation methods such as molecular dynamics and density functional theory[Reference Meakin and Tartakovsky10] in order to improve the accuracy for a wider range of pore sizes and geometries.[Reference Sing24]
Imaging techniques
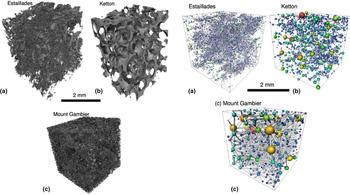
Modern imaging methods are capable of capturing 3D representations of the full geometry and topology of porous media. For instance, x-rays allow one to scan the internal structure of a 3D sample by rotating the sample and recording the absorption in all directions. A standard non-destructive technique is x-ray computed micro-tomography (micro-CT).[Reference Blunt, Bijeljic, Dong, Gharbi, Iglauer, Mostaghimi, Paluszny and Pentland9, Reference Ketcham and Carlson27] The image resolution of micro-CT scanners depends on the beam set-up, the detectors, and the sample size. Laboratory systems have a typical resolution of up to 50 µm, and some systems are capable of providing submicron resolution in the range of 50 nm.[Reference Xiong, Baychev and Jivkov7] Synchroton sources can also be used for CT imaging and provide resolutions about 1 µm. The advantage of synchroton-based CT is that monochromatic beams are available and the beam is collimated, thus reducing aberration artifacts. After the acquisition, the recorded absorption data is processed and a stack of two-dimensional (2D) images is generated. This stack can be segmented to obtain a 3D representation of the solid matrix or pore space. Three examples of pore-space representations obtained from micro-CT images of porous carbonate samples are shown in Fig. 2. The main limitation of micro-CT is the available resolution, and the reconstructed 3D representation may miss the smallest details of the pore space.[Reference Blunt, Bijeljic, Dong, Gharbi, Iglauer, Mostaghimi, Paluszny and Pentland9] In addition, the insufficient contrast in the absorption data can lead to the inaccurate representation of features in the reconstructed images. Some image artifacts such as noise can be accounted for during processing by applying filters and thresholds that have been calibrated for the specific CT setup. However, micro-CT cannot provide any information beyond the sample size such that heterogeneities on larger scales will not be captured.
Visualization of pore space (left) and corresponding pore-network representations (right) for three porous carbonates: (a) Estaillades, (b) Ketton, (c) Mount Gambier. The pore-space images (left) were reconstructed from three-dimensional micro-CT images of the samples. The networks (right) show the pores as spheres and the pore throats as cylinders, where the sizes are derived from the pore-space images. Reprinted from Ref. Reference Blunt, Bijeljic, Dong, Gharbi, Iglauer, Mostaghimi, Paluszny and Pentland9 with permission from Elsevier.

Higher resolution in the 10 nm range can be achieved using SEM. Most porous media can sufficiently be resolved at this resolution, however, only 2D images can be captured and no information about the 3D topology can be extracted. This can be mitigated by combining SEM with focused ion beams (FIB). The FIB is used to cut the sample into fine slices which can be imaged with SEM to provide small-scale pore features. The information provided by the combined FIB/SEM can augment data obtained from micro-CT to generate a 3D registration of pore space. FIB/SEM is a destructive imaging technique, but it can provide the best resolution of pore space covering the geometry and topology in the whole range from cm to nm.[Reference Xiong, Baychev and Jivkov7] The combination of different imaging techniques paves the way to more realistic geometry representations that can be integrated with multiscale modeling and simulation.
Complex flows in porous media
Flow and transport through porous media are of particular interest as the void space of porous media is typically filled with fluids (gases or liquids). However, the pore sizes typically span a range of length scales and the resulting geometry leads to highly non-trivial flow patterns. In addition, the dynamic behavior is often governed by an interplay of different physical mechanisms such as viscous friction, interfacial tension, and charge interactions. The transport coefficients emerge from an intricate competition of hydrodynamic, thermodynamic, and electrokinetic effects in the bulk and at the surface of the geometry. General models to obtain the transport coefficients as a function of the bulk properties of the medium and the fluid are rarely available. The prediction of flow phenomena in porous media thus remains a formidable task and is a genuine multiscale and multiphysics problem. For engineering applications, on the other hand, the rich phenomenology of porous media offers ample opportunities to design systems using functionalized materials and tailored geometries. Here, we exemplarily highlight a few applications of porous media that are of timely interest.
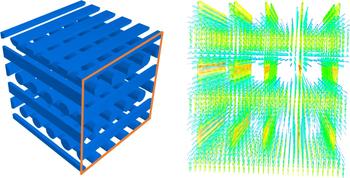
A classical application of porous media is filtration. Aerosol filtration is relevant in a range of sectors including civil and automotive engineering, and health. Similarly, water purification is among the most pressing needs for global health.[Reference Shannon, Bohn, Elimelech, Georgiadis, Mariñas and Mayes28, Reference Amin, Alazba and Manzoor29] Filtration is based on the removal of contaminants from gaseous or liquid fluids streaming through a porous medium. The efficiency of filtration media depends primarily on the pore size (typically on the micron scale) and the flow resistance, and there is typically a trade-off between the collection efficiency and the required pressure drop.[Reference Théron, Lys, Joubert, Bertrand and Le Coq30] However, the detailed filtration characteristics depend on a number of factors such as the morphology of the medium, pore size distribution, and surface functionalization. One important class of filtration media are fibrous membrane fabrics which can be further divided into woven and non-woven fabrics. Woven fabrics consist of a regular pore structure, nevertheless the texture varies depending on the type of weave. This can significantly affect the fluid flow, and the flow pattern in the basic fabric pore have an influence on the overall flow resistance.[Reference Lu, Tung and Hwang31] Theoretical or numerical predictions of the permeability or flow resistance thus have to take the details of the tortuous geometry into account. A numerically computed flow field through an array of fibers representing a model fibrous membrane is shown in Fig. 3. Nonwoven fabrics are a low-cost alternative thanks to inexpensive manufacturing methods such as melt blowing and spun bonding. However, their characterization is more complicated due to local variations in fiber orientation, pore size distribution, etc. Nonwoven fabrics thus exhibit a more heterogeneous and anisotropic morphology which can be both advantageous and limiting for filtration.[Reference Gregor32] The irregular structure of the void space makes it more difficult to determine the tortuosity which influences the flow through the interstices and the filtration performance.[Reference Vallabh, Banks-Lee and Seyam33] Characterization of the porous geometry of non-woven fibrous media[Reference Théron, Lys, Joubert, Bertrand and Le Coq30] is thus an important aspect of gaining a better understanding of the macroscopic flow properties, which may ultimately guide improvement of the filtration capabilities.
Flow through an array of fibers representing a model fibrous membrane. The fibers are arranged in layers where each layer is rotated by 90° with respect to the previous one. Simulations were performed using the lattice Boltzmann method implemented in the LB3D software package.[Reference Schmieschek, Shamardin, Frijters, Krüger, Schiller, Harting and Coveney34] The flow field is visualized with arrow glyphs where the color indicates the velocity magnitude. The flux can be measured for varying pressure gradient in order to determine the permeability in Darcy's law.

Another active area of research is hydrocarbon recovery from reservoirs. Here the scales range from the millimeter grain size to meters on the reservoir scale and to kilometers on the field scale. The oil recovery process is governed by viscous friction, surface wetting, and multiphase interactions between hydrocarbons and injected fluids.[Reference Zitha, Felder, Zornes, Brown and Mohanty35] In order to extract hydrocarbons from the reservoir, the viscous drag in the porous medium has to be overcome by the pressure gradient. This is basically the simplest realization of Darcy's law (see Section IV), where the permeability is a property of the porous geometry. The natural pressure is typically only sufficient to recover about 20% of hydrocarbons from the reservoir.[Reference Zitha, Felder, Zornes, Brown and Mohanty35] While pressure depletion can be delayed by the expansion of aquifers or gas caps, the most common method to sustain pressure is waterflooding. Besides maintaining the pressure, the injected water turns the fluid into a multiphase mixture, where the oil displacement depends on factors such as interfacial tension and surface wettability. The multiphase behavior opens up various routes for enhanced oil recovery that can broadly be divided into thermal and non-thermal recovery methods. While thermal methods mainly aim at decreasing the oil viscosity through heating, non-thermal methods modify the mixture composition in order to tune the multiphase interactions in order to increase displacement efficiency. For example, surfactant flooding is used to tune the interfacial tension and wettability, which can lead to a reduction in capillary pressure allowing more oil to be extracted from the pores. Surfactants can also be mixed with gas to create foams that improve the mobility of the residual oil. Similarly, modifying the rock/fluid interactions can increase the displacement efficiency. Apart from targeting the surface chemistry, one can introduce ionic interactions to activate electrokinetic transport in response to electric fields.[Reference Ghazanfari, Shrestha, Miroshnik and Pamukcu36] For instance, a change in ionic composition has been linked to improved oil displacement for low-salinity waterflooding[Reference Seccombe, Lager, Webb, Jerauld and Fueg37, Reference Webb, Lager and Black38]; however, the underlying mechanism is not fully understood.
Electrokinetic transport in porous media involves additional physical mechanisms that are also highly relevant for batteries and fuel cells. In Li-ion batteries, a voltage is present due to the free energy difference of lithium intercalation in the porous cathode and anode, respectively. Electric current results from the transport of electrons in the circuit while the Li-ions undergo transport from the anode to the cathode. The electrodes are composite porous media consisting of active particles, binder, and conductive. The pore space is filled with electrolyte, and during discharge, the lithium ions migrate to the surface of the active particles and through the electrolyte. The capacity and conductivity depend strongly on the properties of the porous electrodes, primarily the cathode material, which is often lithium cobalt oxide. Over the last one or two decades, considerable efforts to improve performance and safety have focused on the electrochemistry.[Reference Tarascon and Armand2] One of the performance degradation issues is capacity fade due to loss of lithium to side reactions. This can occur in particular in the solid-electrolyte interphase and, whereas it can be addressed by modifying the surface chemistry, the effect of the pore structure on capacity fade has received little attention. Another concern is the swelling of the active particles upon Lithium intercalation which can degrade the performance and ultimately lead to failure.[Reference Garrick, Kanneganti, Huang and Weidner39, Reference Abada, Marlair, Lecocq, Petit, Sauvant-Moynot and Huet40] To better understand the non-equilibrium dynamics during charge and discharge, the coupling between electrochemistry, thermodynamics, and mechanics needs to be considered.[Reference Roberts, Mendoza, Brunini, Trembacki, Noble and Grillet5, Reference Smith and Bazant41] To this end, multiphysics models can be used to simulate the behavior of realistic porous geometries. Roberts et al.[Reference Roberts, Mendoza, Brunini, Trembacki, Noble and Grillet5] have performed simulations of experimentally reconstructed mesostructures and found that both the particle shape and the structure of the porous network can significantly affect the capacity and mechanical performance of the battery. The detailed functional dependence of macroscopic properties on the mesoscale structure, e.g., pore size distribution, anisotropy, etc., is the subject of ongoing research using multiscale models.[Reference Lee, Sastry and Park42–Reference Turner, Allu, Berrill, Elwasif, Kalnaus, Kumar, Lebrun-Grandie, Pannala and Simunovic44]
The above examples illustrate how the multiscale and multiphysics nature of porous media gives rise to complex flow behavior. Porous media are indeed multiscale systems in a twofold way: First, the morphology of the medium and the pore size distribution introduce a range of mesoscopic length scales inherent in the geometry. Second, the physical interactions may span time- and length-scales of a different order of magnitude, e.g., the diffusion in the active particles occurs on shorter times than the diffusion through the electrolyte. Bridging the microscale and the macroscale thus does not only require multiscale models to capture the relevant physical mechanisms but also experiment specific representations of the porous geometry that accurately reflect the morphology of the porous medium across scales.
Mathematical modeling of transport phenomena in porous media
Most transport phenomena require to solve a boundary value problem on the complex geometry of pore space. For instance, incompressible fluid flow is governed by the Stokes equations
 $$\eta \nabla ^2{\bf u}({\bf r}) = \nabla P({\bf r}),$$
 $$\nabla \cdot {\bf u}({\bf r}) = 0,$$
where  ${\bf u}({\bf r})$ denotes the flow velocity,
 $P({\bf r})$ the pressure, and η the dynamic viscosity of the fluid. The boundary condition on the surface of pore space is typically the no-slip boundary condition
 $${\bf u}({\bf r}_s) = 0.$$
Due to the complicated geometry of the surface, obtaining analytical solutions for porous media is often not feasible. Therefore, simplified descriptions based on empirical relationships are commonly used. The most widely used formulation is Darcy's law [Reference Dullien19, Reference Darcy45]
 $$\displaystyle{1 \over A}{\bf q} = - \displaystyle{1 \over \eta} {\ssf K} \cdot \nabla P,$$
which describes the volumetric discharge rate q through a cross-sectional A of the porous medium subject to a hydraulic gradient  $\nabla P$. The linear Darcy's law is valid for stationary low Reynolds number flow of an incompressible Newtonian fluid with dynamic viscosity η. The permeability tensor K is an effective physical property (with units of area) that depends on the geometry and topology of pore space. Darcy's law can be derived from the Stokes equations by means of an asymptotic expansion in a small parameter ε that represents the ratio of microscopic to macroscopic length scales.[Reference Hilfer, Prigogine and Rice17] In an isotropic porous medium, the permeability tensor K reduces to a scalar permeability k.
The determination of the permeability k as a function of the geometry and topology of the porous medium has been a central objective in many investigations and remains an active research topic. A widely referenced approach is the Kozeny–Carman (KC) model,[Reference Dullien19, Reference Kozeny46–Reference Carman48] which is based on the capillary tube model. The discharge rate of N capillary tubes of radius a i and lengths L i is  $Q = \sum\nolimits_{i = 1}^N \pi a_i^4 \Delta P/(8\eta L_i)$, and the average permeability of a cubic sample of size L is thus
 $$\langle k\rangle = \displaystyle{\pi \over 8}\displaystyle{N \over L}\left\langle {\displaystyle{{a^4} \over L}} \right\rangle. $$
The KC model assumes that a mean-field approximation is valid in which case the average permeability can be written as
 $$\langle k\rangle = \displaystyle{{\langle \phi \rangle {\langle a\rangle} ^2} \over {8{\langle T\rangle} ^2}} = \displaystyle{{{\langle \phi \rangle} ^3} \over {2{\langle T\rangle} ^2{\langle S\rangle} ^2}}.$$
In the mean-field approximation, the ratio 〈ϕ〉/〈S〉 becomes equal to the average hydrodynamic radius R h = 〈a〉/2.[Reference Hilfer, Prigogine and Rice17]
The semi-empirical KC permeability k for monodisperse granular media is commonly written in the form[Reference Pan, Hilpert and Miller49–Reference Duda, Koza and Matyka51]
 $$k = \displaystyle{1 \over {C{\kern 1pt} T^2S^2}}\displaystyle{{\phi ^3} \over {{(1 - \phi )}^2}},$$
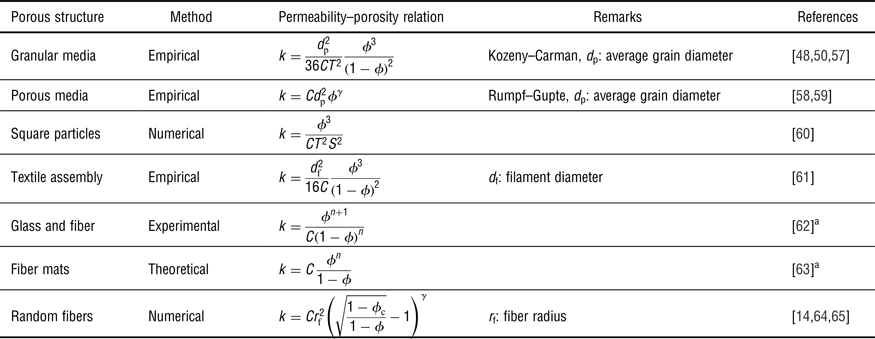
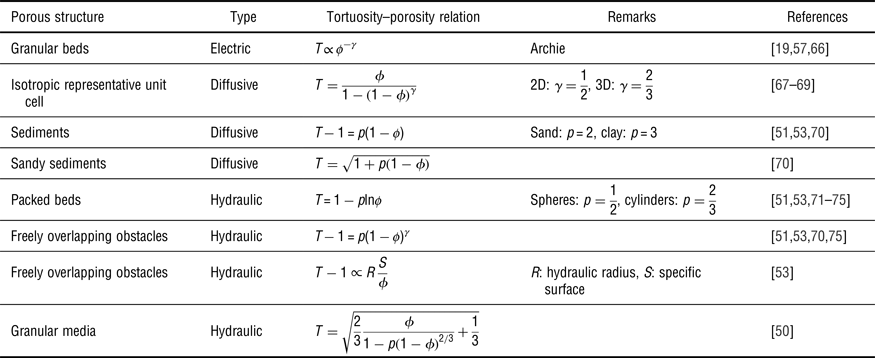
where C is the KC (Kozeny–Carman) constant that depends on the specific structure of the porous medium. A considerable body of work has been devoted to determining permeability relations for various types of porous media.[Reference Ahmadi, Mohammadi and Hayati50, Reference Xu and Yu52] However, in most cases, only the value of CT 2 can be extracted and the KC constant and the tortuosity T remain undetermined. The tortuosity is used in various contexts, and the difference between the geometric and hydraulic, electric, diffusional, etc. tortuosities has been recognized.[Reference Duda, Koza and Matyka51, Reference Matyka, Khalili and Koza53–Reference Allen and Sun56] Accordingly, no unified theory for tortuosity is available,[Reference Matyka, Khalili and Koza53] and numerical and experimental correlations carry some uncertainty regarding their applicability to different types of porous media and porosity range. An analytical expression for tortuosity of sphere arrays can, for example, be derived based on a representative elementary volume (REV) model[Reference Ahmadi, Mohammadi and Hayati50] or by means of fractal geometry.[Reference Xu and Yu52] In practice, the tortuosity–porosity relation is commonly cast in the power law form T − 1 = p(1 − ϕ)γ; however, the values of γ extracted from empirical trends remain non-universal.[Reference Allen and Sun56] Tables 1 and 2 list various correlations for permeability and tortuosity as a function of porosity for different porous media. We should note that the table only lists a selection of the most common correlations used in the literature. Most studies have focused on the scalar KC permeability without attempting to clarify the tensorial nature of the permeability in Darcy's law. This is just one aspect where computational models can provide additional insight by revealing tensorial permeability-porosity relationships.
Permeability–porosity relations proposed in the literature for different porous media. Here C is a constant permeability factor (sometimes called Kozeny–Carman constant), S is the specific internal surface, and T is the tortuosity of the porous medium. γ is an (empirical) scaling exponent.

a As cited in Ref. Reference Xu and Yu52.
Tortuosity–porosity relations proposed in the literature for different porous media. Here γ is an (empirical) scaling exponent and p is an (empirical) shape factor.

Multiscale modeling of porous media
The central objective of modeling porous media is to be able to predict the phenomenological and quantitative behavior of a porous medium on macroscopic scales, i.e., the scales that are observed in laboratory or field experiments. Due to the complex geometry of pore space and the hierarchy of length scales, a fully resolved model of the porous medium is usually not feasible. Therefore, macroscopic models of porous media use effective properties such as the permeability in Darcy's law. The equations governing the macroscopic variables arise from averaging over the microscopic features of pore space. They are thus a coarse-grained representation of the microscopic dynamics, much like coarse-grained models of macro-molecules arise from averaging over fast degrees of freedom. The difference is that in the latter case the average is taken in time, while for porous media the average is performed over a spatial domain. The averaging process is referred to as homogenization and is based on the notion of a REV. The REV is a subdomain of the porous medium which contains sufficient information such that the average yields a representative effective property. The average of a quantity θ over phase i is written as
 $$\langle \theta _i({\bf r})\rangle = \int_{{\rm REV}} \theta ({\bf {r}^{\prime}})\chi _i({\bf {r}^{\prime}})\omega ({\bf {r}^{\prime}} - {\bf r})d{\kern 1pt} {\bf {r}^{\prime}},$$
where  $\chi _i({\bf r})$ is the indicator function for phase i, and
 $\omega ({\bf r})$ is a suitable weight function. Standard choices for the weight function are a constant or Gaussian function. The size of the REV is a mesoscopic length scale beyond which the variance of the effective properties decays and the average becomes a constant. For instance, averaging Darcy's law, Eq. (4), over a REV with the local pressure gradient
 $\nabla P({\bf r}) = s({\bf r})\nabla P$ yields
 $$\langle {\bf v}\rangle = - \displaystyle{1 \over \eta} \langle sk\rangle \nabla P,$$
where K = 〈sk〉 is the effective permeability. Note that in order to determine the effective permeability, the statistical distribution of the microscopic permeability  $k({\bf r})$ and the scaling factor
 $s({\bf r})$ for the local pressure gradient need to be known. The process of transitioning from the microscale description to the coarse-grained description by determining the effective permeability is called upscaling. The microscopic heterogeneities are absorbed into the effective properties and the porous medium becomes homogeneous on the coarse-grained scale. Various upscaling methods exist,[Reference Chen76, Reference Renard and de Marsily77] however, in many situations they face difficulties regarding accuracy and robustness. In recent years, upscaling has increasingly become augmented by numerical methods such as the HMM (heterogeneous multiscale methods).[Reference E and Engquist78] The development of novel multiscale methods has led to robust, accurate, and efficient procedures that outperform the classical upscaling techniques in many practical applications. Today, the determination of effective properties and macroscopic flow predictions thus relies more and more on numerical multiscale modeling.
Pore-network models
A simplified representation of pore space consists of a network of idealized pores connected by pore throats. The pores and throats constitute the nodes and bonds of a pore network and are assumed to have simple geometric shapes for which the permeability (and other properties) is known. In this sense, pore-network models are a coarse-grained representation that retains the essential features on a mesoscale. Instead of averaging Darcy's equation, the flow through the network elements is described by a discretized Laplace equation
 $$\sum\limits_j \displaystyle{{k_{ij}} \over \eta} (P_i - P_j) = 0,$$
where P i is the pressure  $P({\bf r}_i)$ at the element i of the network, and
 $k_{ij} = k[({\bf r}_i + {\bf r}_j)/2]$ is the permeability of the throat connecting i and j. The discrete Eq. (10) can be solved using, e.g., successive overrelaxation or conjugate gradient methods. The boundary conditions give rise to a source term on the right-hand side if i is a boundary node. Pore-network models date back to the seminal work of Fatt[Reference Fatt79] who used a random resistor network to study two-phase capillary displacement. Since then, significant advances have been made and a variety of more sophisticated network models have been developed. On the one hand, these aim at including more details of the pore-scale physics such as wettability and relative permeability, or improved physical models for non-Newtonian displacement and non-linear extensions of Darcy's law.[Reference Blunt, Bijeljic, Dong, Gharbi, Iglauer, Mostaghimi, Paluszny and Pentland9] There are also ongoing efforts to develop pore-network models for electrokinetic flows.[Reference Obliger, Duvail, Jardat, Coelho, Békri and Rotenberg80, Reference Obliger, Jardat, Coelho, Bekri and Rotenberg81] On the other hand, better representations of the geometry and topology of pore space have been sought. These include more accurate modeling of the morphology of the throats in order to capture the influence of surface wetting in multiphase flows.[Reference Xiong, Baychev and Jivkov7, Reference Blunt, Bijeljic, Dong, Gharbi, Iglauer, Mostaghimi, Paluszny and Pentland9, Reference Blunt, Jackson, Piri and Valvatne82] The main aim, however, is to accurately represent the spatial correlations and connectivity of pore space which are not captured by statistically mapped networks. For this reason, randomly generated representations of porous media are often not predictive[Reference Mehmani and Balhoff83] and are of limited value in multiscale modeling.
Network reconstruction
Constructing the pore network for a particular representation of a porous medium is a key element in pore-network modeling. The first realistic models for granular media were based on simulated grain packing and diagenesis.[Reference Bryant and Blunt84–Reference Bryant, Mellor and Cade86] Pore centers are identified in the void space and the topology is created by connecting four or less adjacent pores. However, grain-based network reconstruction is limited to porous media that consist of spherical grains. Alternative approaches are based on the reconstruction of porous media from experimentally acquired images of pore space. The maximal ball method places spheres on every voxel and grows them until they touch the solid matrix. The largest inscribed spheres are identified as pores while smaller spheres represent pore throats. While this method can identify the pores, it tends to produce too high coordination numbers and the pore throats may include cascades of small spheres.[Reference Xiong, Baychev and Jivkov7] In contrast, the erosion–dilation method and the medial axis method use certain transformations to reduce the pore space to its topological skeleton. The pores are identified based on a tessellation of the sample space. While these methods preserve the topology of pore space, the identification of pores remains ambiguous and is sensitive to resolution and image quality.[Reference Xiong, Baychev and Jivkov7] Figure 2 shows three examples of pore-network representations consisting of pores and pore throats whose sizes were determined from the corresponding micro-CT images. In general, the network reconstruction methods suffer from the lack of a rigorous distinction of pores and pore throats. The reconstructed morphology may depend on this definition and on the specific discretization and resolution. Therefore, different pore-network models can be constructed for the same image data, and it can only be validated a posteriori whether a representation yields accurate physical predictions. Hence, the comparison to results from direct models and experimental data is essential to determine whether the pore-network predictions of the relevant properties are sensitive to the particular reconstruction strategy.[Reference Xiong, Baychev and Jivkov7]
Direct models
Direct models have the advantage that they do not seek a simplified representation of the porous medium but use the voxelized 3D geometry of pore space to solve the governing equations on a discrete grid. Since the only limitation of this approach is the resolution and quality of the image, direct models are ideally suited to investigate the physics of porous media down to the pore scale.[Reference Biswal, Held, Khanna, Wang and Hilfer87] In principle, any numerical method can be applied to solve the governing equations and classical approaches include finite-difference, finite-element methods, and density functional methods.[Reference Meakin and Tartakovsky10] However, most of these methods are plagued by the difficulty of incorporating the complex boundary conditions of pore space. In addition, the treatment of interfaces in multiphase systems requires additional effort in order to accurately locate and track the interface. The LBM, on the other hand, allows incorporation of arbitrary boundary shapes with relative ease and does not require any interface tracking in multiphase systems. Therefore, the LBM is arguably the most versatile method for direct modeling of porous media.
Lattice Boltzmann methods
The LBM is a lattice kinetic method that reproduces the incompressible Navier–Stokes equation on hydrodynamic length and time scales. Unlike particle-based methods, it represents the fluid by a set of discrete (mass) distribution functions on a regular cubic lattice.
The geometry of pore space can be modeled on the grid by marking the nodes that are located within the solid matrix. At the boundary between fluid nodes and solid nodes a bounce-back boundary condition is applied which reverses the velocity of a particle distribution when it impinges the boundary. More involved boundary conditions have been developed to improve accuracy.[Reference Bouzidi, Firdaouss and Lallemand88, Reference Ginzburg and d'Humières89]
A multiphase mixture can be modeled in the LBM by including a second set of distributions that evolve on the same lattice. A short-range interaction force is applied between the component σ and σ′. The short-range interactions induce a surface tension at the interface between the components and control the phase separation of the components. Thanks to the kinetic basis and the mesoscopic scale of the LBM, it can be coupled to a range of other physical dynamics if they are amenable to a lattice representation on a similar scale. For instance, Capuani et al.[Reference Capuani, Pagonabarraga and Frenkel13] have developed a link-flux algorithm to solve the electrokinetic equations on the same lattice and couple the ionic fluxes to the hydrodynamic flow field. This approach can be applied to simulate pore-scale electrokinetic flow in porous media.[Reference Rotenberg, Pagonabarraga and Frenkel90, Reference Rotenberg and Pagonabarraga91] While the LBM is based on a structureless fluid and reproduces hydrodynamics in the limit of small Knudsen number, it has also been applied to finite Knudsen number flows[Reference Toschi and Succi92] and nanoscale flows in thin-film geometries.[Reference Horbach and Succi93] For more comprehensive reviews of various LBMs, we refer the reader to Ref. Reference Schmieschek, Shamardin, Frijters, Krüger, Schiller, Harting and Coveney34 and Reference Dünweg and Ladd94.
Geometry generation and reconstruction
There are essentially two ways to obtain the porous geometry for direct modeling. The first is based on computer-generated structures that mimic the morphology and topology of a certain type of porous medium. The seminal example is grain-based models for diagenesis and compaction of granular media and sandstones.[Reference Bryant and Blunt84–Reference Bryant, Mellor and Cade86] They model the natural formation process by growing a random packing of spheres until they overlap and percolate. The packing is compacted by moving the centers of the spheres closer together in the direction of compression. Grain size distributions can be modeled by using spheres of different radius. While grain-based models where originally used to construct pore-network models, they can be used straightforwardly in direct models. Instead of spheres, other basic shapes such as ellipsoids, cubes, parallelepipeds, and fibers can be used.
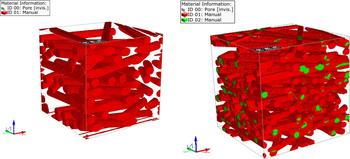
Random arrangements of fibers can be used as models for paper, textiles, and non-woven materials. For instance, Koponen et al.[Reference Koponen, Kandhai, Hellén, Alava, Hoekstra, Kataja, Niskanen, Sloot and Timonen95] have used random fiber sheets to study the permeability of paper and non-woven fabrics. Ordered and disordered fiber arrangements were compared by Clague et al.[Reference Clague, Kandhai, Zhang and Sloot64] in wall-bounded and unbounded flows. Nabovati et al. have studied the influence of fiber radius, curvature, and aspect ratio on the permeability of non-overlapping and overlapping random fiber arrangements. In our research, we employ a workflow using the GeoDict software[96] to generate models of non-woven fibrous media. The fibers are placed randomly but only a limited range of directions is allowed, giving rise to an anisotropic arrangement that mimics non-woven mats produced by electrospinning.[Reference Chen, Trofimov, Jacobsohn, Xiao, Kornev, Xu and Peng4] Both overlapping and non-overlapping arrangements can be created to cover a range of porosities. Two examples of anisotropic, random fiber arrangements are shown in Fig. 4. An animated visualization of the 3D structures is available in the Supplementary material. In contrast to stochastic models for porous media, process-based models for the generation of porous media yield a better representation of the porous medium beyond porosity. While random generation can recover the local porosity, it typically fails to give an accurate representation of the connectivity which can significantly deteriorate the predictive capabilities of stochastic models. Modeling the formation process gives a more realistic representation of pore space; however, the process-based simulation can be difficult to realize for specific types of porous media.
Fibrous membranes with varying porosity generated with the software GeoDict.[96] (left) Non-overlapping fibers with a porosity of ϕ = 0.796. (right) Overlapping fibers with a porosity of ϕ = 0.695.

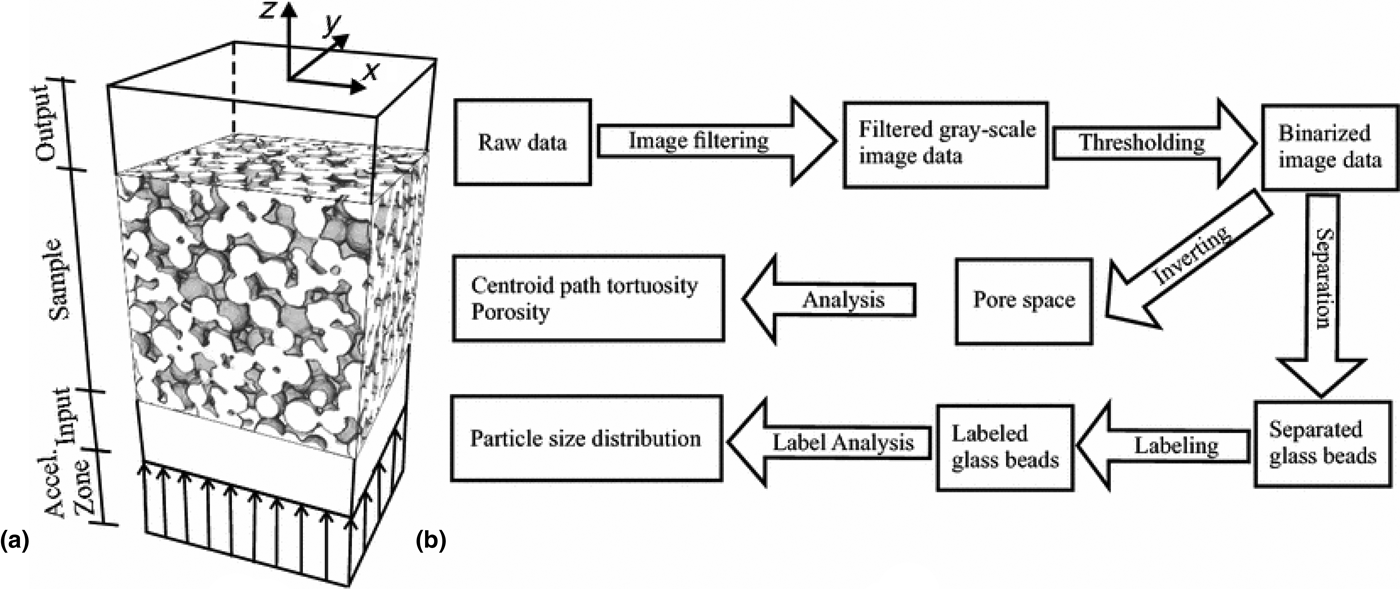
The second approach is based on experimental imaging techniques such as micro-CT/XRCT and FIB/SEM. Image reconstruction can deliver the most realistic representations of porous media by digitizing the full 3D pore space. Heterogeneities are naturally included and the reconstructed geometry yields realistic pore spectra and connectivity information. However, extracting the necessary information from the experimentally recorded images is not trivial and requires careful filtering and segmentation techniques. Gueven et al.[Reference Gueven, Frijters, Harting, Luding and Steeb8] have digitized CT images of porous sintered glass bead packings. They applied several filters to the raw data before segmenting the geometry, which is necessary to adjust the gray-scale distribution such that the glass beads and the pore space can reliably be identified. The filters included the removal of peaks (bright spots), phase contrast improvement to enhance the edges of the glass beads, and noise reduction and thresholding to generate a binarized image. The resulting binary map was used to analyze the particle size distribution, pore throat distribution, porosity, and tortuosity. The workflow for this image analysis is shown in Fig. 5. The voxelized geometry was then used to perform lattice Boltzmann simulations to determine the permeability of different domains of the sample. The resolution of the CT images was 16 µm and domains of up to 1024 × 1024 × 2048 voxels were considered. The results demonstrate that direct modeling can predict the local variations in permeability with good accuracy as long as a representative sample size is used.
Flowchart of the image analysis workflow employed by Gueven et al.[Reference Gueven, Frijters, Harting, Luding and Steeb8] based on XRCT images of sintered glass bead systems. Several filters are applied to the raw images in order to obtain a binary gray scale distribution. The binarized image was segmented to analyze the bead distribution. The pore space was analyzed by inverting the binarized image. Reproduced from Ref. Reference Gueven, Frijters, Harting, Luding and Steeb8 under the terms of the Creative Commons Attribution License (http://creativecommons.org/licenses/by/4.0).

The use of FIB/SEM image reconstruction for direct modeling was used, e.g., by Roberts et al.[Reference Roberts, Mendoza, Brunini, Trembacki, Noble and Grillet5] They binarized images of lithium–cobalt–oxide and segmented the active particle, binder, and electrolyte phases, where the identification of individual particles was facilitated by a watershed algorithm. The aim of the work was to perform finite-element simulations of the coupled electrochemical–mechanical–thermal equations governing the intercalation of lithium in the porous material. Therefore, instead of using the voxel data directly, a tetrahedral mesh was created and decomposed into a phase conforming mesh according to the segmentation of the original image. The smallest mesh size used by Roberts et al. was 0.0625 µm resulting in more than 100 × 106 elements, and second-order accuracy of the results was verified. An analysis of the required REV of the reconstructed images is also possible.[Reference Kanit, Forest, Galliet, Mounoury and Jeulin97]
These examples serve to show that the progress in imaging techniques makes it possible to reconstruct high-fidelity direct models of porous media. Limitations in image quality can partly be overcome using digital image processing techniques, and direct modeling can reach the experimental resolution provided the numerical techniques are sufficiently efficient and computationally feasible.
Conclusions and future directions
In this contribution, we have reviewed the development of modeling approaches for transport phenomena in porous media. Advances in this research area are driven by the need to better understand the physical mechanisms that are at play across the scales in porous media. These mechanisms impact the performance of important technological applications such as water filtration, hydrocarbon recovery, and energy storage. The heterogeneous structure of porous media is of particular importance and leads to a complex interplay of multiscale and multiphysics effects.
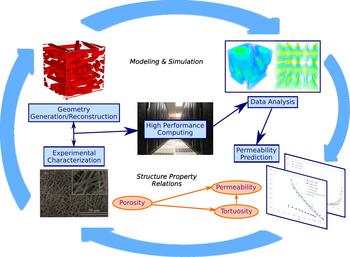
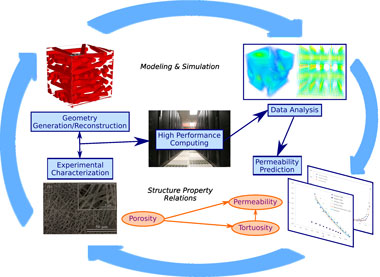
Modern imaging methods such as micro-CT/XRCT and FIB/SEM are now capable of probing the geometry of pore space with sub-micron resolution. At the same time, advances in high-performance computing have made simulations with millions and billions of voxels feasible. The combination of these developments enables numerical simulation of transport in porous media with unprecedented accuracy, and direct modeling of sample sizes on the scale of laboratory experiments are becoming possible. Figure 6 illustrates an integrated workflow that combines multiscale modeling and simulation with the generation of realistic geometries according to experimental images. This workflow is in principle applicable to a broad class of porous media including rocks, clays, ceramics, and polymeric materials.
Illustration of an integrated workflow for multiscale modeling of porous media. Experimental images are used to characterize the porous medium and to generate or reconstruct realistic geometries. Pore-scale simulations are used to determine the local permeability and other effective properties. These inform theoretical analysis and upscaling approaches to model the porous medium on larger scales. The whole process is iterative and two-way communication between smaller and larger scales is used in hybrid methods. High-performance computing enables multiscale multiphysics simulations of porous media with improved predictive capabilities.

Multiscale modeling is particularly suited in this context since it allows one to determine effective micro-scale properties that can be used with coarse-grained models at larger scales. Here, data-driven approaches and machine learning can prove valuable to amalgamate all available information. We anticipate that a better integration of modeling approaches and data analysis will further improve our predictive capabilities since a purely data-driven approach is prone to overfitting and limited in the physical insight it can provide.
Advanced multiphysics models can be used to address constitutive relations for a range of model parameters. This makes it possible to dial in physico-chemical surface characteristics at the pore scale such as heterogeneous wettability and surface charges. While these properties remain difficult to measure precisely in experiments, multiscale simulations enable us to predict their effect on macroscopic transport phenomena. The insights gained from simulation models can thus be used for rational design of porous media with tailored transport properties. Whereas a full incorporation of models from micro-scale to macro-scale remains computationally challenging, it is anticipated that the next generation of supercomputing systems with exascale performance will lead to the emergence of novel computing patterns[Reference Alowayyed, Groen, Coveney and Hoekstra98] that will boost the feasibility of model- and data-driven materials design.
Modeling of porous media thus continues towards more sophisticated models as novel applications emerge, e.g., in biomedical engineering.[Reference Khanafer and Vafai1] Integrated approaches that combine advanced imaging techniques with multiscale modeling and high-performance computing will facilitate numerical simulation of transport phenomena in realistic pore-space geometries, which will help transform simulation models of porous media into predictive tools of wide applicability.
Supplementary material
The supplementary material for this article can be found at https://doi.org/10.1557/mrc.2018.29
Acknowledgments
We thank Fei Peng and Luiz G. Jacobsohn for valuable discussions concerning the permeability of electrospun YAG fiber membranes. Clemson University is acknowledged for generous allotment of compute time on Palmetto cluster.