Major League Baseball's 1947 integration was a pivotal event in America's movement away from racial segregation. Though some large industries had integrated prior to baseball, these earlier integrations were generally inconspicuous.Footnote 1 For example, the Ford Motor Company appeared to be well-integrated by the 1920's, but due to high levels of internal segregation, few inside Ford (and even fewer outside of Detroit) could appreciate the diverse racial composition of Ford employees.Footnote 2 A more public event was the establishment of the Fair Employment Practice Commission during World War II, yet the actual impacts and efficacy the integrations sparked were not transparent to the public.Footnote 3 While these earlier integrations were no doubt important, the American workplace, and society at large, remained largely segregated in 1947.
Three years prior to baseball's integration, Gunnar Myrdal suggested a solution to this persistent segregation. In An American Dilemma, he concluded that that “more public events” were essential to overcoming “white indifference,” and in fact that “publicity is of the highest strategic importance” for racial equality.Footnote 4 Unlike earlier integrations, Major League Baseball's prominence made its integration a truly public event that could meet Myrdal's charge. More than 18.5 million consumers attended Major League baseball games in 1947, with many millions more attending games in other leagues.Footnote 5 Even outside of Major League cities, most every newspaper dedicated numerous daily column-inches to baseball, and nearly every major news outlet covered baseball's integration.Footnote 6 Baseball's integration also reached from sports into popular culture—for example, a song about Jackie Robinson (the man who integrated baseball in 1947) reached as high as #13 on national radio charts. In fact, prior to Brown v. The Board of Education of Topeka, baseball's integration was an issue of “even greater salience” than school desegregation in the fight for Civil Rights.Footnote 7 Through baseball, a nation would bear direct witness to the success or failure of an institution's integration.
The importance of baseball's integration may be best measured by the impact it had on future integration efforts. Baseball integrated in 1947, a year before President Truman integrated the armed forces, seven years before the Brown case, and 17 years before the Civil Rights Act of 1964. Baseball was also a catalyst for these subsequent “public” integrations.Footnote 8 Long before efforts to integrate other public spaces could be considered, “dozens of minor league baseball teams, even in places like Montgomery [Alabama] and Durham [North Carolina], signed their first black players.”Footnote 9 Even strongholds of segregation were accepting of baseball's integration as an initial step toward integration; Birmingham, Alabama willingly repealed its ban on interracial sporting competitions in an attempt to get the Dodgers to visit during spring training in 1954.Footnote 10 Baseball provided such a lasting
icon of desegregation that decades later “the Jackie Robinson story was used repeatedly as a metaphor during integration of the southern textile industry.”Footnote 11
Civil Rights leaders were also keenly aware of baseball's importance, and Robinson's contributions. In particular, Martin Luther King Jr. poignantly captured Robinson's importance to the Civil Rights Movement, stating “back in the days when integration wasn't fashionable, he underwent the trauma and the humiliation and the loneliness which comes with being a pilgrim walking the lonesome byways toward the high road of Freedom. He was a sit-inner before the sit-ins, a freedom rider before the Freedom Rides.”Footnote 12 This national salience made baseball's integration a “great experiment,” both socially and economically. As such, baseball's integration served as something of an integration litmus test for the nation, one that garnered a great deal more public attention than most any prior industry's integration.
In addition to its historical importance, the integration of Major League Baseball also provided excellent data that make it an ideal case study of the market discrimination at play in this era. The integration of the first Major League Baseball team was abrupt, public, and absent the governmental involvement that affected the integration patterns in many previous case studies of integration.Footnote 13 This allows for a “clean” analysis of the market forces working for and against integration. The slow and public nature of baseball's integration provides excellent data on both individual- and firm-level productivity. These data allow for unique analysis into the sources and magnitudes of the economic discrimination that affected baseball's integration.
But despite its unique positioning, relatively little economic analysis has been performed on baseball's integration.Footnote 14 And while many papers document evidence of discrimination in sports, most have focused on customer discrimination, and none have attempted to disentangle the multiple potential sources or motivations behind discrimination.Footnote 15 Since this article uses a rich data set that includes individual- and firm-level productivity measures from an actual market, I am better able to identify the sources of economic discrimination surrounding baseball's integration.
Ultimately, I find that the median team sacrificed profits of nearly $2.2 million in 1950 dollars (more than $19 million in 2010 dollars) by remaining segregated. I then show that the incentives to integrate should have been clear by 1950, and identify the most likely reason for the delay of integration as owner hesitancy based on their own discrimination or collective discrimination by their players.
A Brief History of Baseball's Segregation and Integration
Major League baseball first integrated in 1884, when the integrated Toledo Blue Stockings joined the Major Leagues; but this period of integration was short-lived.Footnote 16 After the 1884 season, white professional baseball adopted a “gentlemen's agreement” discouraging any teams from hiring black players. The strength of this rule was bolstered by many prominent players claiming that they would refuse to play for or against “any team with colored players.”Footnote 17 At this time the Major Leagues and the franchises they comprised were very much in flux, and the loss of a prominent star could well have caused irreparable damage to a team's reputation and financial success.Footnote 18 Whether this threat was a reason or an excuse for segregation, the “gentlemen's agreement” effectively barred black players from the Major Leagues in 1884; by 1898 every minor league had adopted a similar policy.Footnote 19
In response to the “gentlemen's agreement,” entrepreneurs began founding leagues composed of players excluded from the Major Leagues based on race. While many of these leagues were small and financially unviable, even at the outset they comprised a great deal of talent.Footnote 20 The nature of the Negro Leagues changed in 1920 when Andrew “Rube” Foster founded the Negro National League, and the “major” Negro Leagues were born.Footnote 21 These leagues were well-organized, well-advertised, played in most Major League cities, and even in many Major League stadiums.Footnote 22 They drew large crowds, were financially relevant, and displayed a product of comparable, and in some cases higher, quality than the all-white leagues. Given the attendance, publicity, and quality of the Negro Leagues, the owners or customers of white Major League franchises were likely well-aware of the talent available to a team willing to break the “gentlemen's agreement.”
In October 1945 Robinson signed a minor league contract with the Brooklyn Dodgers. After integrating the minor leagues in 1946, Robinson took the field for Brooklyn on 15 April 1947 and became the first black man to play Major League baseball in 63 years. The on-field returns were immediate: Robinson won the Rookie of the Year Award and finished third in the league's Most Valuable Player balloting. Robinson's success was not unique: three of the first five former Negro League players to play in the white Major Leagues would eventually be elected to the Hall of Fame, and despite their sparse numbers and relative short time horizon, former Negro League players would be comprise one-sixth of Major League Baseball's “All-Century Team.”Footnote 23
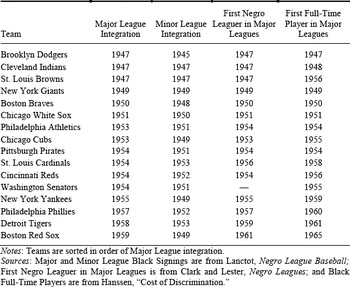
Some franchises quickly followed the Dodger's lead and integrated. Table 1 shows the years when each Major League franchise reached some key integration landmarks. But by 1950, long after the potential returns to integration should have been apparent, 12 of the 16 Major League teams had still failed to integrate. It would take until 1965 before every team had employed at least one full-time black player.
YEARS OF INTEGRATION FOR MAJOR LEAGUE FRANCHISES

Notes:
Teams are sorted in order of Major League integration.
Sources:
Major and Minor League Black Signings are from Lanctot, Negro League Baseball; First Negro Leaguer in Major Leagues is from Clark and Lester, Negro Leagues; and Black Full-Time Players are from Hanssen, “Cost of Discrimination.”
Data
The data used for this analysis include Major League team-level data on productivity, individual-level data on the Major League and “pre-market” productivity of all former Negro League players who participated in the Major Leagues, and similar individual-level data for all white players who made their Major League debuts between 1950 and 1953. Individual-level data include an assortment of measures of Major League productivity, as well as pre-market indicators potentially relevant for the prediction of this Major League productivity. The team-level data is a constructed panel of all 16 Major League teams over the 16 years inclusive of 1946–1961.Footnote 24 These team-level data include measures of each team's performance, attendance, and the demographic characteristics of their cities. Additional data on team finances were also collected from the 1951 and 1957 hearings conducted by the House of Representatives’ Committee on the Judiciary Inquiry into Organized Professional Team Sports. These data include profits and losses for all Major League franchises from 1920–1950, as well as somewhat more detailed revenue and cost breakdowns for the years 1946, 1950, and 1952–1956.
As noted earlier, measures of an individual's productivity are rare, but key to assessing economic discrimination. Since such measures have not been used in previous economic studies of baseball's integration, they have not been able to identify the sources of economic discrimination. In this analysis, Expected Runs Produced (ERP) per At Bat is used to measure a player's productivity. ERP is a simple linear transformation of individual performance measures that yields the expected team runs resulting from a player's efforts.Footnote 25ERP can also be aggregated to the team level and is highly accurate at predicting the total runs scored by a team in larger samples.Footnote 26 More importantly, ERP is very effective at predicting the output for high-productivity players and teams. This property makes it ideal for this analysis as many of the former Negro League players and their teams were well above average in their production.Footnote 27 A limitation of ERP is that it only reflects the contribution of batting with no evaluation of a player's defense or pitching.Footnote 28 As there were very few black pitchers given the opportunity to perform at the Major League level, this study focuses only on positional players. That the barriers facing black pitchers appear to have been higher than those faced by black positional players is an interesting topic in its own right, and could imply a form of “color line” discrimination not explored here.Footnote 29
I measure a team's integration in two ways: a simple binary variable indicating whether the team employed a former Negro League player, and the proportion of a team's at bats that went to former Negro League players. The measures allow flexibility in identifying the response to hiring the first and subsequent Negro League players, while also measuring the extent to which the players contributed to the team.Footnote 30
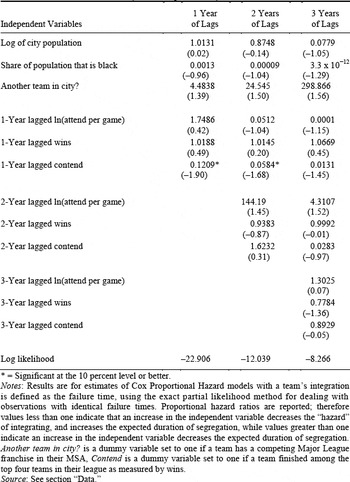
One concern with these data is the possibility that there might be systematic endogenous selection into integration. This presents a problem if the teams that integrated early were systematically “better” than those that resisted integration, an effect that might lead to inflated estimates of the returns to integration. Previous work has found little evidence that integration was a function of easily measured performance features of the teams.Footnote 31Table 2 shows the results of a similar analysis using the Cox Proportional Hazard model to examine the impact of lagged team productivity factors on the persistence of segregation. Only one productivity factor had a statistically significant influence on a team's integration. When a team was in contention to win the league in the previous year, that team was statistically significantly less likely to integrate in two of the three specifications. This finding implies that the coefficients of a regression of productivity on integration will be biased in a negative direction, a bias that works against my findings that Negro League players increased the productivity of teams.
COX PROPORTIONAL HAZARD MODEL ESTIMATES OF THE IMPACTS OF TEAM CHARACTERISTICS ON INTEGRATION, HAZARD RATIOS REPORTED (z-scores in parentheses)

* = Significant at the 10 percent level or better.
Notes:
Results are for estimates of Cox Proportional Hazard models with a team's integration is defined as the failure time, using the exact partial likelihood method for dealing with observations with identical failure times. Proportional hazard ratios are reported; therefore values less than one indicate that an increase in the independent variable decreases the “hazard” of integrating, and increases the expected duration of segregation, while values greater than one indicate an increase in the independent variable decreases the expected duration of segregation. Another team in city? is a dummy variable set to one if a team has a competing Major League franchise in their MSA, Contend is a dummy variable set to one if a team finished among the top four teams in their league as measured by wins.
Sources:
See section “Data.”
Tests of Taste-Based Economic Models of Discrimination
To explore the impact of integration on a team's productivity, I run regressions of ERP per At Bat and a team's Wins on the integration measures and a set of controls. I also include team and year fixed effects to adjust for any team- or time-specific effects, such as home stadiums that facilitate scoring or league-wide scoring cycles. The inclusion of these fixed effects presents some econometric difficulty for estimating standard errors. To mitigate this problem, I employ a block bootstrap procedure to determine statistical significance. Footnote 32
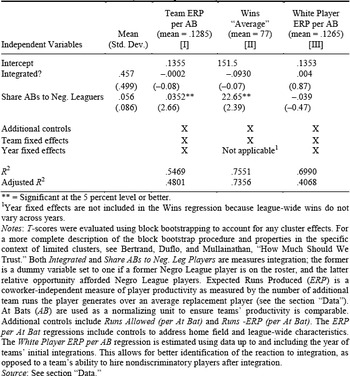
The results from the productivity regressions show that Negro League players were a high-productivity option for teams in this era. Specification I in Table 3 shows the estimates of the impact of integration on a team's ERP per At Bat. The coefficient on the dummy variable indicating whether a team is integrated is both small and statistically insignificant, while the coefficient on the proportion ofa team's at bats going to a former Negro League player is positive and statistically significant. This implies that there was little change to the productivity of a team's players when a team simply added a former Negro League player to the roster and he got no at bats. However, the coefficient for the Share of At Bats given to former Negro League players shows that a team could have increased its productivity by 2.9 percent at the mean ERP per at bat if it brought in a Negro League player and made him a full-time player with one-ninth of the teamsat bats.Footnote 33 This finding is consistent with the classic Becker prediction that formerly excluded workers were more productive than the workers they replaced, and that integration increased the average productivity of a firm's workers. Specification II in Table 3 shows the results when a team's wins are used as an alternative measure of productivity. The relative size and significance of the integration terms’ coefficients in this regression are similar to those of the individual-level productivity regression. Integrating with a full-time former Negro League player would have increased that teams expected wins by 2.42, or 3.15 percent of the average team's total productivity. This is further evidence that the increased individual-level productivity documented in specification I translated to greater success for the team as a whole. As these results indicate that a team's overall productivity rose as more Negro League labor was utilized more, the challenge now is to understand why integration proceeded slowly despite these productivity returns.
REGRESSIONS OF TEAM AND PLAYER PRODUCTIVITY MEASURES FOR THE PERIOD 1947–1961 (t-scores in parentheses)

** = Significant at the 5 percent level or better.
1 Year fixed effects are not included in the Wins regression because league-wide wins do not vary across years.
Notes:
T-scores were evaluated using block bootstrapping to account for any cluster effects. For a more complete description of the block bootstrap procedure and properties in the specific context of limited clusters, see Bertrand, Duflo, and Mullainathan, “How Much Should We Trust.” Both Integrated and Share ABs to Neg. Leg Players are measures integration; the former is a dummy variable set to one if a former Negro League player is on the roster, and the latter relative opportunity afforded Negro League players. Expected Runs Produced (ERP) is a coworker-independent measure of player productivity as measured by the number of additional team runs the player generates over an average replacement player (see the section “Data”). At Bats (AB) are used as a normalizing unit to ensure teams’ productivity is comparable. Additional controls include Runs Allowed (per At Bat) and Runs -ERP (per At Bat). The ERP per At Bat regressions include controls to address home field and league-wide characteristics. The White Player ERP per AB regression is estimated using data up to and including the year of teams’ initial integrations. This allows for better identification of the reaction to integration, as opposed to a team's ability to hire nondiscriminatory players after integration.
Sources:
See section “Data.”
Considering Coworker Discrimination
Coworker discrimination is notoriously difficult to disentangle from other types of discrimination. In fact, if coworker discrimination was prevalent enough, organized workers could have effectively kept owners from integrating as they had done in numerous unions in the early 1900s.Footnote 34 If players were able to convince owners to resist integration, they could have translated their prejudice into owners’ actions (or inaction). This type of coworker discrimination would have affected the owners’ extensive integration decision. As such, only individual coworker discrimination can be effectively isolated from owner discrimination.
Traditional models of individual coworker discrimination describe a situation when workers of a particular type have distaste for working alongside workers of a different type. These models conclude that favored workers will demand (but not receive) a higher wage when working with members of the disfavored group. But because of Major League Baseball's “reserve clause”—a policy that effectively indentured a player to his team in perpetuity, so long as the team offered him at least the league's minimum salary—players had virtually no ability to command higher wages. Despite this, some owners expressed concern that players unable to affect their wages would instead change effort levels.Footnote 35
If white players had strong discriminatory attitudes, the introduction of Negro League players who were taking jobs from whites might have led to team strife that could have resulted in lower productivity by the white players on integrated teams. Specification III in Table 3 shows the results of a regression of the ERP per At Bat of White Players on measures of integration. Note that this regression is estimated using data only through the years of each team's initial integration to eliminate the impacts of any post-integration changes in team composition, and better isolate any response to the “shock” of integration. These results show the productivity of remaining white players was not substantially affected by the replacement of white players with former Negro League players. The coefficient of the presence of any Negro League players is positive, but not statistically significant. Although the coefficient on the proportion of a team's at bats going to former Negro League players is negative, integrating a full-time former Negro League player reduced average White ERP per At Bat by only –0.26 percent. This “zero response” can be partially explained by the fact that former Negro League players were not typically brought in to replace the lowest-skilled players, but were more often employed to fill spots vacated by retirement, injury, trades, or to fulfill specific position needs. Also of note is that there is no evidence that teams engaged in more frequent trading around the time of integration in order to remove prejudiced players from their rosters.
While these results provide no evidence to support a hypothesis of individual-level economic discrimination by Major League players, they also provide no evidence against more collective coworker efforts to dissuade owners from integrating. This is probably not surprising, as any individual who could have been identified as reducing his effort or output in response to integration would risk immediate replacement. As such, any manifestation of coworker discrimination was likely a collective effort to stave off integration.
Testing for Customer Discrimination
Customer discrimination is a particularly important concern in the context of the baseball industry because the consumer's evaluation of baseball involves watching and rooting for the players on a team. Thus, racial antipathy toward a player likely reduced the interest in a team more than say the purchase of a product that was produced or sold to the consumer by a black worker.
The number of fans attending a team's home games is the measure used to evaluate customer discrimination. There is a concern with this simple measure: there is a distinct possibility that the fans who attended games after integration are not entirely the same fans who attended before integration. This makes the identification of individual customer discrimination impossible and raises the possibility that post-integration customers had a different value for teams. However, net attendance will reveal if discriminatory fans who stopped attending games were outnumbered by the new fans induced by integration. Unfortunately, there are no available data that will allow for contrasting the value of lost and gained fans (e.g., relative sales of bleacher tickets versus box seats), so the “blunt instrument” of total attendance will have to suffice. One could also be concerned that teams altered their pricing strategies in the year they integrated in order to induce more fans to attend, but there is no evidence this occurred. Between 1950 and 1961, the period for which data are available, teams raised average ticket prices an average of 3.50 times and by a total of $0.49. Meanwhile, teams that integrated raised prices an average of 3.58 times and by a total of $0.48.Footnote 36 Additionally, five of the 12 teams that integrated in these years actually increased their average ticket prices in the year they integrated, while none decreased their ticket prices. As such, ticket prices do not appear to have been negatively influenced by their integration.
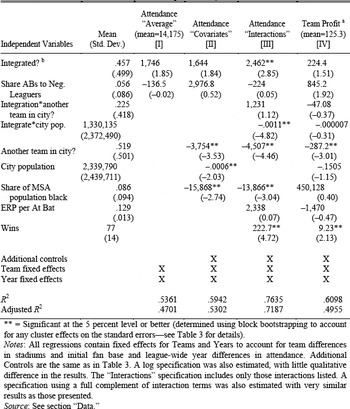
Table 4 shows the results of three regressions of teams’ attendances on measures of integration and other variables. Specification I shows the results of a specification using only the two measures of integration and fixed effects for teams and years. The coefficient on the Integrated dummy variable is positive and statistically significant at better than the 10 percent level, while the coefficient on the Share of At Bats to Negro Leaguers is negative but statistically insignificant. The estimated coefficients show that a team that integrated by adding a former Negro League player who played full-time would have experienced an increase in per game attendance of 1,731 (the coefficient for Integrated, 1,746 + (1/9)*–136.5, the coefficient for Share of At Bats to Former Negro League Players). This represents an increase of 12.2 percent of the average team's attendance. Specification II shows the estimates when covariates for team productivity, city characteristics, and competition are included in the regression. The estimates are quite similar to those presented in specification I. In this specification, the average attendance gain available through integration with a full-time former Negro Leaguer would have been 1,974 per game, or 13.9 percent of the average team's attendance.
REGRESSIONS OF PER GAME ATTENDANCE AND PROFIT, 1947–1961 (t-scores in parentheses)

** = Significant at the 5 percent level or better (determined using block bootstrapping to account for any cluster effects on the standard errors—see Table 3 for details).
Notes:
All regressions contain fixed effects for Teams and Years to account for team differences in stadiums and initial fan base and league-wide year differences in attendance. Additional Controls are the same as in Table 3. A log specification was also estimated, with little qualitative difference in the results. The “Interactions” specification includes only those interactions listed. A specification using a full complement of interaction terms was also estimated with very similar results as those presented.
Sources:
See section “Data.”
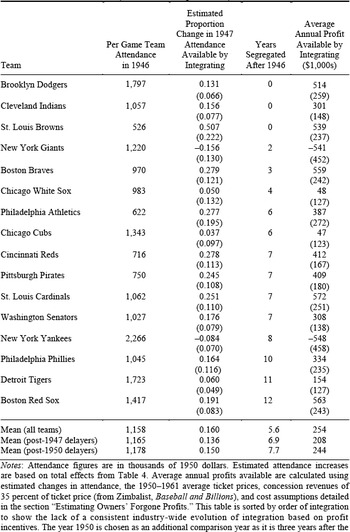
However, the effects of integration on attendance likely interacted with the characteristics of a team's city, which led me to estimate the model including the interaction effects in specification III.Footnote 37 The estimated effect of integration is complicated by the inclusion of the interaction terms. As a first cut, if a team was competing with another team in the same city and the city population was the league average of 2.3 million people, integrating with a full-time former Negro League player would have raised attendance by 7.7 percent. Table 5 provides team-by-team estimates of the change in attendance that would have been anticipated had the team integrated in 1947. All of the teams except the New York Giants and the New York Yankees are predicted to have had positive attendance gains. Despite the prediction, the New York Giants were the fourth team to integrated. At the other extreme of the predictions, the longest holdout to integration (the Boston Red Sox) had one of the highest projected returns from integration. They also had one of the lowest levels of profits prior to integration, losing more than $95,000 in 1946. In summary, the vast majority of teams’ attendance predictions are positive and substantial. This finding is in sharp contrast to a hypothesis of customer discrimination.
ESTIMATED ATTENDANCE AND PROFITS AVAILABLE TO TEAMS VIA INTEGRATION (standard errors in parentheses)

Notes:
Attendance figures are in thousands of 1950 dollars. Estimated attendance increases are based on total effects from Table 4. Average annual profits available are calculated using estimated changes in attendance, the 1950–1961 average ticket prices, concession revenues of 35 percent of ticket price (from Zimbalist, Baseball and Billions), and cost assumptions detailed in the section “Estimating Owners’ Forgone Profits.” This table is sorted by order of integration to show the lack of a consistent industry-wide evolution of integration based on profit incentives. The year 1950 is chosen as an additional comparison year as it is three years after the success of Brooklyn's integration, long enough that teams could reasonably have avoided much of the uncertainty surrounding integration. There is also evidence that the returns to be made from integration were not exhausted by 1950. Specifically, the Chicago White Sox, the first team to integrate after 1950, saw their average attendance increase from 9,890 in the year prior to their integration to 17,028 in their year of integration.
Sources:
See the discussion in sections “Data” and “Estimating Owners’ Forgone Profits.”
There is one additional measure that might have signaled customer discrimination to owners of all white teams—the attendance at home games when an opposing team was integrated. To briefly assess this possibility, I explore the attendance reactions of the Detroit Tigers and Boston Red Sox, the last two teams to integrate, to the integrations of the Philadelphia Athletics, Washington Senators, and New York Yankees, the three teams that integrated just prior to their integration. In the year prior to their integrations, attendance at games against the three soon-to-be-integrated teams was 95.1 percent of the average home attendance for Detroit and Boston. In the year after integration, attendance at these games was nearly identical, at 95.3 percent of the average home attendance. While hardly evidence of the apparently high latent demand for integrated baseball that existed, these numbers do nothing to support the idea that fan response to integrated opponents provided a signal of customer discrimination to Detroit's and Boston's owners.
Estimating Owners’ Foregone Profits
Owner discrimination models are among the most commonly presumed discrimination models, yet they are perhaps the most difficult to evaluate due to the absence of direct, quantifiable evidence of owner utility and/or distaste. But it should be obvious that if the returns from integration outweigh the owner's distaste, that owner would choose to integrate. Accordingly, in place of a direct analysis of individual owner preferences, I offer a revealed preference analysis based on estimates of the forgone profits that could have been achieved had an owner integrated earlier. As these estimates are of the actual profits forgone by an owner (not the maximum profits owners might have chosen to sacrifice), they serve as a lower bound on the level of owner distaste for integration.Footnote 38
The estimated annual profits available to each team from integration are detailed in Table 5. These estimates are obtained by estimating both the revenues and cost a team would have realized by integrating. The revenue estimates are simply the estimated attendance gains from integration multiplied by the average ticket price and concession income per customer. The ticket price used is the average price for each franchise over the period 1950–1961, and the concession income is set to 35 percent of ticket revenues.Footnote 39
Estimates of the costs associated with integration rely on a number of available data, including outlays to scout and sign Negro League players and relative salary effects of these players compared to white players. These costs are borne solely by the team that integrates, and not subject to any strategic or external considerations. Two additional costs, lost stadium rental revenue and decreased relative advantage in signing prejudiced white players, are shared by all teams when any team integrates. Many Major League teams earned revenues from renting their stadium to local Negro League franchises. As each Major League team's decision to integrate had an impact on the likelihood of survival of the Negro Leagues, it would have reduced every team's expected stadium rental revenue to teams in those leagues. Similarly, the more teams that integrated, the lower the expectations young white players would have had that any organization would remain all white or that they could avoid playing against black players. As such, each team is assumed to only have controlled one-sixteenth of both of these costs, as each of the 16 teams in the league is capable of impacting them.
The costs assumed include per player costs of $10,000 for the scouting and signing of each player, additional costs of $15,000 in lost scouting advantage, and $30,000 in lost stadium rental revenue realized once, when a team initially integrated.Footnote 40 As former Negro League players were typically paid less than the players they replaced, an average payroll decrease of $9,494 relative to the league average is assumed. This is the average salary change by the eight teams that reported data on player salaries at the time of their integration during the 1957 Congressional Hearings. This change in payroll should include both the salary savings of hiring a low-cost player, and any increases to compensate discriminating players. However, to ensure these estimates are conservative, an additional cost of 10 percent of the average white player salaries on integrated teams is assumed. It should be noted that there is no evidence of such a response in salaries, however integrated teams did pay more in bonuses than did all white teams due largely to improved team performance. Further, there is no way to isolate any increase in monitoring, for example, higher managerial salaries to compensate for team chemistry or increased security costs, from the reported “general operational costs.”
Multiplying the annual profits available through integration by the number of years a team remained segregated shows the median Major League team gave up nearly $2.2 million in 1950 dollars (more than $19 million in 2010 dollars) during the period that they remained segregated. Although the blocked nature of these data make the precise level of statistical significance for these results difficult to establish, most of the estimates have relatively high t-scores. The average t-score is 1.71. As such, these estimates imply that most teams could have both yielded high expected profits from integration, and been fairly confident that integration would indeed be profitable.
These results are robust to the possibility that some teams may have been risk averse and adopted a “wait and see” attitude towards integration. When only those teams that remained segregated beyond 1950—when the returns to integration should have been obvious— are considered, the median team's lost profits are still more than $1.2 million in 1950 dollars (over $11 million in 2010 dollars). These results are also robust to the possibility of discontinuous returns and assumptions about the owners’ foresight. When early integrators are dropped from the analysis to account for the possibility they may have reaped disproportionately high returns, the relevant coefficients on integration in Tables 3 and 4 remain statistically significant at the 5 percent level, although the profit estimates based on these coefficients drop by about 15 percent. When the analysis is repeated using data restricted to only information available in 1950—making the implicit and strong assumption that owners had no more foresight into the operations of their teams than the econometrician would have—the estimated returns to integration are actually higher (although the standard errors of these estimates are also higher).
As an additional check on the relative magnitudes of the profit estimates, Table 4 also includes the results from a regression of team profits. Unfortunately, data on profits are limited in availability and subject to more idiosyncratic variability than are the attendance data. Specifically, measures of profits are only available for the years 1946–1950, and 1952–1955, and are highly volatile due to fluctuations costs that are independent of integration, such as stadium renovations or losses incurred by the farm systems.Footnote 41
Despite these limitations, the profit regression shows general support of both the direction and magnitude of the estimates in Table 5. The coefficients on both of the non-interacted integration measures are positive and large. If a team was competing with another team in the same city and the city population was the league average of 2.3 million people, integrating with a full-time former Negro League player would have raised profits by attendance by $254.8 thousand. This estimated total effect is similar in magnitude to the average annual profits predicted in Table 5. Some care must be taken in drawing conclusions from this estimate, however; only the coefficient on the share of at bats for Negro Leaguers is statistically significant at the 10 percent level, and the t-score for prediction is around 1.40.
Finally, it should not be overlooked that these financial returns are in addition to the increased wins and the potential for championships their teams might have achieved through integration. In short, not only did owners leave a great deal of profit on the table, but they did so by willingly providing a lower quality product to their customers.
Testing for Statistical Discrimination
While it might seem odd to apply a model of statistical discrimination to an industry where output and pre-market signals are easily observed, it is important to note that these models only require that the signals sent by different groups correlate differently with the productivity, not that those signals are difficult to observe. These models take the general form
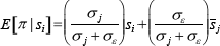
where E[πi] is worker i's expected productivity, σj is the standard deviation of a signal from a j-type workers, σε is the noise associated with a worker's signal, s i is the productivity signal sent by worker i, and s j is the average productivity of a j-type worker.Footnote 42 In this context of negligible wage competition, the expected productivity should impact employment opportunities more than compensation. In other words: the higher a player's expected productivity relative to his competition, the greater the likelihood that player will be given an opportunity to perform at the Major League level (in all likelihood at a typical rookie's salary, regardless of race). As Negro Leaguers had both higher average productivity and lower wages than their white counterparts, it follows that the signal strength for these players would have had to be much lower than that of white players in order for statistical discrimination to slow the speed of baseball's integration.
To estimate the predictive strength of pre-market signals on Major League productivity, I run the following regression separately for white and former Negro League players

where MajorLeagueERP is the measure of productivity, X represents a set of measured pre-market indicators, and ε is a stochastic error term. In these regressions, it is the R 2 and not the predicted βs that serves as the appropriate measure of signal strength. As R 2 measure the portion of the variance in ERP explained by the regressors, it serves as a viable proxy for the  term in equation 1.Footnote 43 Thus, a lower R 2 for Negro League players would be indicative of the lower signal strength required for a statistical discrimination explanation of baseball's slow integration.
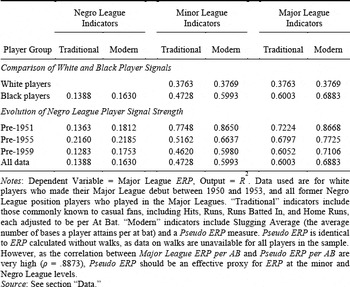
Table 6 shows the results of different specifications of the signaling regression expressed in equation 2. I run separate regressions on only Negro League data, only minor league data, and combined Negro and minor league data using two sets of pre-market indicators: “traditional” measures of a player's minor league performance that even a casual fan could have been aware of (hits, runs, home runs, and runs batted in per at bat rates), and “modern” indicators encompassing the traditional measures as well as the minor league slugging average (total bases per at bat) and PseudoERP per at bat (see Table 6 for a description of PseudoERP). To account for the possibility that teams had to “learn” how to accurately predict the performance of Negro League players, I also present results of regressions using cumulative data from progressing 4-year intervals.
RELATIVE SIGNAL STRENGTHS OF PRE-MARKET PRODUCTIVITY INDICATORS FOR MAJOR LEAGUE EXPECTED RUNS PRODUCED, AS MEASURED BY R 2

Notes:
Dependent Variable = Major League ERP, Output = R 2. Data used are for whiteplayers who made their Major League debut between 1950 and 1953, and all former Negro League position players who played in the Major Leagues. “Traditional” indicators include those commonly known to casual fans, including Hits, Runs, Runs Batted In, and Home Runs, each adjusted to be per At Bat. “Modern” indicators include Slugging Average (the average number of bases a player attains per at bat) and a Pseudo ERP measure. Pseudo ERP is identical to ERP calculated without walks, as data on walks are unavailable for all players in the sample. However, as the correlation between Major League ERP per AB and Pseudo ERP per AB are very high (ρ = .8873), Pseudo ERP should be an effective proxy for ERP at the minor and Negro League levels.
Sources:
See section “Data.”
In each comparable specification, the R 2 for former Negro League players was actually higher than that of their white counterparts, opposite the result predicted by statistical discrimination. There is also no evidence of a “learning curve” in predicting the performance of former Negro League players. In fact, the R 2 for former Negro League players is higher when the analysis is restricted to early integrators. This is less surprising than it might first appear. As early integrators were able to select from the entire distribution of Negro League players, they could choose not just the best players, but also those who were most likely to succeed. Regardless, these findings are in such sharp contrast to the hypothesis of statistical discrimination they may imply that alternative forms of discrimination were stronger. By promoting a white minor leaguer in place of a former Negro Leaguer, owners actually decreased their expected payoffs and exposed themselves to increased risk. As such, the alternative forms of discrimination needed to exceed both the productivity advantage and the informational advantage former Negro League players possessed.
DISCUSSION AND CONCLUSION
This article examines the sources and magnitude of economic discrimination that slowed the integration of Major League Baseball. Customer, individual-level coworker, and statistical discrimination do not appear to have impacted this market. Only owner hesitancy can explain the delay of integration in Major League Baseball; however, this hesitancy might not be the sole result of owner discrimination. If discriminating players convinced owners they were all (or at least predominantly) unwilling to play on an integrated team, then the resulting segregation would be indistinguishable from owner discrimination. Just as important as the source of the discrimination is its cost; the median team sacrificed an estimated $2.2 million in 1950 dollars (more than $19 million in 2010 dollars) to delay integration. But, the incentives to integrate were too large for discrimination to win out forever, and each team eventually integrated (despite few changes in ownership).
The finding that owners or collectives of players may have been responsible for the economic discrimination that manifested in this market is probably not surprising to those familiar with this era and industry. What is perhaps more surprising is the finding that individual coworker, customer, and statistical discrimination did not appear to significantly impact this market. This could be the result of the industry's structure. Because labor and consumers in the industry had little market power, the impact their individual prejudices could have been limited.
These findings have implications well beyond the baseball industry. Baseball's integration was a historically significant event, and may yield insight into the more general labor market discrimination at play in this era. Though the baseball industry was a relatively small industry, its integration was a nationally salient event that influenced the integration of many other industries and institutions. Additionally, since baseball was a noncompetitive industry, the discrimination documented here could yield insight into the average level of discriminatory preferences in the larger market.Footnote 44 Finally, baseball's visibility also meant owners could hide neither their discriminatory hiring nor the negative impact it had on the quality of their product from their consumers.
 the comparability of this term to the signal weight term in equation 1 is straightforward.