


%20--%3e%3c!DOCTYPE%20svg%20PUBLIC%20'-//W3C//DTD%20SVG%201.0//EN'%20'http://www.w3.org/TR/2001/REC-SVG-20010904/DTD/svg10.dtd'%3e%3csvg%20version='1.0'%20id='Layer_1'%20xmlns='http://www.w3.org/2000/svg'%20xmlns:xlink='http://www.w3.org/1999/xlink'%20x='0px'%20y='0px'%20width='64px'%20height='64px'%20viewBox='5.5%20-3.5%2064%2064'%20enable-background='new%205.5%20-3.5%2064%2064'%20xml:space='preserve'%3e%3cg%3e%3ccircle%20fill='%23FFFFFF'%20fill-opacity='0'%20cx='37.785'%20cy='28.501'%20r='28.836'/%3e%3cpath%20fill='%23595959'%20d='M37.441-3.5c8.951,0,16.572,3.125,22.857,9.372c3.008,3.009,5.295,6.448,6.857,10.314%20c1.561,3.867,2.344,7.971,2.344,12.314c0,4.381-0.773,8.486-2.314,12.313c-1.543,3.828-3.82,7.21-6.828,10.143%20c-3.123,3.085-6.666,5.448-10.629,7.086c-3.961,1.638-8.057,2.457-12.285,2.457s-8.276-0.808-12.143-2.429%20c-3.866-1.618-7.333-3.961-10.4-7.027c-3.067-3.066-5.4-6.524-7-10.372S5.5,32.767,5.5,28.5c0-4.229,0.809-8.295,2.428-12.2%20c1.619-3.905,3.972-7.4,7.057-10.486C21.08-0.394,28.565-3.5,37.441-3.5z%20M37.557,2.272c-7.314,0-13.467,2.553-18.458,7.657%20c-2.515,2.553-4.448,5.419-5.8,8.6c-1.354,3.181-2.029,6.505-2.029,9.972c0,3.429,0.675,6.734,2.029,9.913%20c1.353,3.183,3.285,6.021,5.8,8.516c2.514,2.496,5.351,4.399,8.515,5.715c3.161,1.314,6.476,1.971,9.943,1.971%20c3.428,0,6.75-0.665,9.973-1.999c3.219-1.335,6.121-3.257,8.713-5.771c4.99-4.876,7.484-10.99,7.484-18.344%20c0-3.543-0.648-6.895-1.943-10.057c-1.293-3.162-3.18-5.98-5.654-8.458C50.984,4.844,44.795,2.272,37.557,2.272z%20M37.156,23.187%20l-4.287,2.229c-0.458-0.951-1.019-1.619-1.685-2c-0.667-0.38-1.286-0.571-1.858-0.571c-2.856,0-4.286,1.885-4.286,5.657%20c0,1.714,0.362,3.084,1.085,4.113c0.724,1.029,1.791,1.544,3.201,1.544c1.867,0,3.181-0.915,3.944-2.743l3.942,2%20c-0.838,1.563-2,2.791-3.486,3.686c-1.484,0.896-3.123,1.343-4.914,1.343c-2.857,0-5.163-0.875-6.915-2.629%20c-1.752-1.752-2.628-4.19-2.628-7.313c0-3.048,0.886-5.466,2.657-7.257c1.771-1.79,4.009-2.686,6.715-2.686%20C32.604,18.558,35.441,20.101,37.156,23.187z%20M55.613,23.187l-4.229,2.229c-0.457-0.951-1.02-1.619-1.686-2%20c-0.668-0.38-1.307-0.571-1.914-0.571c-2.857,0-4.287,1.885-4.287,5.657c0,1.714,0.363,3.084,1.086,4.113%20c0.723,1.029,1.789,1.544,3.201,1.544c1.865,0,3.18-0.915,3.941-2.743l4,2c-0.875,1.563-2.057,2.791-3.541,3.686%20c-1.486,0.896-3.105,1.343-4.857,1.343c-2.896,0-5.209-0.875-6.941-2.629c-1.736-1.752-2.602-4.19-2.602-7.313%20c0-3.048,0.885-5.466,2.658-7.257c1.77-1.79,4.008-2.686,6.713-2.686C51.117,18.558,53.938,20.101,55.613,23.187z'/%3e%3c/g%3e%3c/svg%3e)
%20--%3e%3c!DOCTYPE%20svg%20PUBLIC%20'-//W3C//DTD%20SVG%201.0//EN'%20'http://www.w3.org/TR/2001/REC-SVG-20010904/DTD/svg10.dtd'%3e%3csvg%20version='1.0'%20id='Layer_1'%20xmlns='http://www.w3.org/2000/svg'%20xmlns:xlink='http://www.w3.org/1999/xlink'%20x='0px'%20y='0px'%20width='64px'%20height='64px'%20viewBox='5.5%20-3.5%2064%2064'%20enable-background='new%205.5%20-3.5%2064%2064'%20xml:space='preserve'%3e%3cg%3e%3ccircle%20fill='%23FFFFFF'%20fill-opacity='0'%20cx='37.637'%20cy='28.806'%20r='28.276'/%3e%3cg%3e%3cpath%20fill='%23595959'%20d='M37.443-3.5c8.988,0,16.57,3.085,22.742,9.257C66.393,11.967,69.5,19.548,69.5,28.5c0,8.991-3.049,16.476-9.145,22.456%20C53.879,57.319,46.242,60.5,37.443,60.5c-8.649,0-16.153-3.144-22.514-9.43C8.644,44.784,5.5,37.262,5.5,28.5%20c0-8.761,3.144-16.342,9.429-22.742C21.101-0.415,28.604-3.5,37.443-3.5z%20M37.557,2.272c-7.276,0-13.428,2.553-18.457,7.657%20c-5.22,5.334-7.829,11.525-7.829,18.572c0,7.086,2.59,13.22,7.77,18.398c5.181,5.182,11.352,7.771,18.514,7.771%20c7.123,0,13.334-2.607,18.629-7.828c5.029-4.838,7.543-10.952,7.543-18.343c0-7.276-2.553-13.465-7.656-18.571%20C50.967,4.824,44.795,2.272,37.557,2.272z%20M46.129,20.557v13.085h-3.656v15.542h-9.944V33.643h-3.656V20.557%20c0-0.572,0.2-1.057,0.599-1.457c0.401-0.399,0.887-0.6,1.457-0.6h13.144c0.533,0,1.01,0.2,1.428,0.6%20C45.918,19.5,46.129,19.986,46.129,20.557z%20M33.042,12.329c0-3.008,1.485-4.514,4.458-4.514s4.457,1.504,4.457,4.514%20c0,2.971-1.486,4.457-4.457,4.457S33.042,15.3,33.042,12.329z'/%3e%3c/g%3e%3c/g%3e%3c/svg%3e)
Introduction
In the US, antimicrobial-resistant infections continue to cause significant morbidity and mortality and influence clinician decision-making. Reference Sutton and Ashley1,Reference Hasegawa, Perencevich, Dukes and Goto2 Spatial and seasonal variation in rates of resistant infections suggests that behaviors and environments both within and outside of healthcare settings drive the likelihood of resistance in Staphylococcus aureus, Escherichia coli, and other commonly observed bacterial infections. Reference Carrel, Smith and Shi3–Reference Carrel, Shi, Hasegawa, Bricker, Boyle and Goto9 Inclusion of area-level factors and temporality has had limited predictive capacity for resistant S. aureus and E. coli within a nationwide cohort of Veterans Health Administration (VHA) patients, however, and coupled with individual patient-level data has had mixed influence on improvement in antibiogram predictive capabilities. Reference Tang, Shi, Hasegawa, Carrel, Oleson and Goto10,Reference Carrel, Shi and Clore11 Indeed, in many studies, the only significant predictor of an individual patient’s bacterial specimen exhibiting drug resistance is prior antibiotic exposure, at time scales varying from two weeks to ninety days. Reference Tang, Shi, Hasegawa, Carrel, Oleson and Goto10,Reference Kuster, Rudnick and Shigayeva12–Reference Goto, Bandyopadhyay and Shi14
Antimicrobial resistance patterns amongst S. aureus and E. coli specimens within the VHA have shown distinct spatial patterning, with higher and increasing rates of resistance to antibiotic classes such as tetracyclines, trimethoprim-sulfamethoxazole, fluoroquinolones, and extended-spectrum beta-lactamases in the VHA facilities and patient residential counties of the US South. Reference Smith, Carrel and Goto4,Reference Boyle, Shi, Hasegawa, Carrel, Oleson and Goto15 Reasons for this have been speculated to be related to warmer and wetter climate, higher rates of poverty and structural drivers of infection risk. Reference See, Wesson and Gualandi16–Reference Herold, Immergluck and Maranan21 However, as previously stated, when these spatial, behavioral, and environmental factors are explicitly included in models, only prior individual-level antibiotic exposure is consistently significantly predictive of resistance profiles. Reference Tang, Shi, Hasegawa, Carrel, Oleson and Goto10,Reference Goto, Bandyopadhyay and Shi14 Antibiotic prescribing in veterans has been shown to vary according to factors such as patient rurality (longer antibiotic courses and higher use of broad-spectrum agents), facility complexity (lower complexity exhibits higher prescribing rates), and regionally (more prescribing for outpatient respiratory infections in the US South and Central regions). Reference Evans, Fitzpatrick and Poggensee22–Reference Jones, Sauer and Jones24
In non-VHA studies, information on prescribing also indicates higher rates of antibiotic use or inappropriate prescribing in the Southern US. Reference King, Bartoces, Fleming-Dutra, Roberts and Hicks25–Reference Roberts, Hicks and Bartoces30 These studies, however, utilize data from convenience samples of privately insured individuals, data from pharmacies without linkage to patient conditions or focus only on specific health conditions. The VHA represents an opportunity for nationwide examination of antibiotic prescribing amounts directly linked to facility-level need for prescribing to understand whether regional or seasonal variation in prescribing or inappropriate prescribing is driven by underlying variation in bacterial outcomes in facilities, that is is prescribing higher in the South because of generally higher bacterial condition burden.
We sought to explore whether there was variation in antibiotic usage, of any class for any bacterial condition, amongst VHA facilities. In particular, we examined whether there was a disconnect between bacterial condition burdens (the percent of visits for a bacterial condition or for which an antibiotic was prescribed) and antibiotic prescribing loads across regions, and whether this disconnect varied seasonally as bacterial conditions have been shown to vary seasonally. In doing so, we assessed whether some regional patient populations seen at VHA facilities exhibit higher rates of bacterial conditions as an overall burden of healthcare outcomes, and whether some regions have higher levels of antibiotic prescribing than their bacterial condition burden would indicate is warranted.
Data and methods
The VHA Corporate Data Warehouse (CDW) provides patient-level information on healthcare visits as well as prescription orders. The CDW was queried for the time period of October 1, 2022 to September 30, 2024, for all facilities located in the conterminous US (48+DC). These dates avoid the most intense period of the COVID-19 pandemic and capture the most recent patient data available within the CDW. Data from six VHA facilities were excluded from the analysis due to limited availability.
At the facility level, a monthly count of all in-person and telehealth visits with providers for patients >18 years of age was generated, excluding allied health/paramedical visits (eg, social work, nurse only, laboratory visits). To estimate the number of patients a facility handles, individual patients were only counted once per month, to avoid over estimation of facility use by a patient being seen in multiple clinics in a short time. To understand facility visit burdens, a more expansive definition using all visits by patients regardless of repeated timing during a month, was generated. Thus, we can distinguish between facilities with similar patient numbers but different numbers of provider visits, or facilities that serve a small number of veterans in each month.
For each facility, a monthly count of the visits with bacterial condition diagnoses or an antibiotic prescription was calculated. Bacterial condition diagnoses were those that fell within the Tier 1 and Tier 2 categories developed by Fleming-Dutra et al. (2016) as almost always having an antibiotic treatment indicated or sometimes having an antibiotic treatment indicated, and were captured via ICD-10 codes. Reference Fleming-Dutra, Hersh and Shapiro31 We used a composite measure because either component alone is biased: diagnosis codes omit appropriate antibiotic use without an infection code (eg, inappropriate prescribing, procedural or postexposure prophylaxis), and prescriptions omit indicated conditions that were not treated. The composite therefore captures visits at which an antibiotic could plausibly have been prescribed, appropriately or not. Because each visit contributes once to the numerator regardless of course length, the exposure is not mechanically linked to the prescribing-day outcomes. We included all bacterial infectious causes rather than focusing specifically on condition types (e.g, acute respiratory tract infections) or bacteria types, (eg, Gram negative or Gram positive or other bacterial classes), instead capturing overall infectious condition burden requiring antibiotic treatment within VHA facilities.
The total bacterial condition patient and visit burden was calculated monthly by dividing the count of patients and visits associated with either a diagnosis or prescription indicating infection by the count of unique patients and total visits to facilities. The monthly percent of visits to facilities for bacterial conditions was charted to explore any variation by region or season. Region was assigned based on the four US Census regions. 32 Seasons were defined as: Winter (December, January, February), Spring (March, April, May), Summer (June, July, August), Fall (September, October, November).
Also at the facility level, monthly measures of antibiotic prescribing were calculated. All classes of systemic antimicrobials were included, as exposure to one class can sometimes confer resistance to another class and potentially drive area or facility level resistance. Reference Szybalski and Bryson33,Reference Sakenova, Cacace and Orakov34 For inpatients, antibiotics delivered as solution, additives, oral or injection were included, while for outpatients, antibiotics delivered as oral or injection were included. From each prescription, the number of prescribing days (days supply) was determined. For each facility and month, both the total number of prescribing days across all prescriptions as well as a mean days of prescribing was calculated. Reference Kim, Strominger, Zivin, Van and Maust35 Total prescribing days estimates overall durations of antibiotic treatments being prescribed, while mean days of prescribing across all prescriptions smoothes across potentially high variability in the total number and duration of prescriptions. We use these terms rather than days of therapy as both outpatient and inpatient treatments are being considered.
Facilities were stratified by the four US Census regions and monthly percent bacterial condition visits versus total and mean prescribing days in that month were calculated and charted to understand whether there exist regional mismatches, eg, whether some facilities have higher prescribing duration than their bacterial condition visit burden would suggest is necessary. The total prescribing days per 1,000 bacterial condition visits in regions and seasons was also calculated. Significance in variation between bacterial condition visit burden, total antibiotic days prescribed, total prescribing days per 1,000 bacterial condition visits and mean antibiotic days prescribed by region and season were assessed via Kruskal-Wallis tests. Smoothed loess lines stratified by region for data observed in each of the four seasons were also used to understand whether regional relationships between total and mean prescribing and bacterial condition visit percentages varied seasonally. Generalized estimating equation models accounting for correlation within facilities and across time further estimated the relationship between prescribing and bacterial condition visit percentageswhile simultaneously accounting for region and season. Models were clustered on facility with repeated measures defined as month/year and an autoregressive correlation structure with robust standard errors using the geepack package in R Studio (2025.09.2). Reference Højsgaard, Halekoh and Yan36
This cross-sectional study was approved by the institutional review board at the University of Iowa and the Research and Development Committee at the Iowa City Veterans Affairs Health Care System with a waiver of informed consent because the study was a retrospective analysis of health records with no direct contact with patients. This study followed the Strengthening the Reporting of Observational Studies in Epidemiology reporting guideline.
Results
From October 1, 2022 to September 30, 2024, there were 61,141,210 unique patients seen for 135,694,718 care visits at 130 VHA facilities in the conterminous US. Among the 130 facilities, all provide outpatient care; ∼120 provide acute medical and surgical inpatient care, and ∼10 provide only mental health or nursing home care. Of these, 6,190,552 patients had 7,812,818 visits meeting the bacterial condition burden definition, defined as visits with either a Tier 1 or Tier 2 diagnosis code or an associated antibiotic prescription (10.1% of all patients, 5.8% of all visits). VHA facilities are not uniformly distributed across the US Census regions, the highest number are in the South (n = 49) and Midwest (n = 32), the Northeast region has n = 26 facilities and the West has n = 23 facilities. The burden of bacterial condition visits amongst VHA facilities varied significantly by region and season (Table 1). Bacterial condition visit percentages were highest in facilities in the Northeast and in the winter. This pattern varies by facility, however, with some facilities in the South exhibiting the highest bacterial condition percents among total visits, though fit lines indicate relative stability in rates over time (Figure 1).
The percentage of VHA visits for a tier 1 or tier 2 condition or with an antibiotic prescription by month and region, October 2022–September 2024. Winter months are indicated by solid lines, summer months by dashed lines.

Summary statistics by region, season, and region: season for total patients, visits, bacterial conditions patients and visits, total prescribing days, total prescribing days per 1,000 bacterial condition visits, and mean prescribing days

Table 1. Long description
Significance: *** P < .001 ** P < .01 * P < .05, Kruskal-Wallis rank sum test.
Total antibiotic prescribing days and mean prescribing days significantly vary by region, and mean prescribing days significantly vary by season (Table 1). Average total prescribing days are highest in the South, lowest in the Northeast, while the average of mean prescribing days is highest in the Northeast. Seasonally, the highest average monthly mean prescribing days is in the summer.
When standardized by bacterial condition visits, total antibiotic days per 1,000 visits are highest in the Midwest and then the South, and in the Midwest across all seasons (Table 1). However, when examining facility level variation by region, there are other differences in the total days of antibiotics prescribed across bacterial condition visit percentages (Figure 2A). Facilities in the US South and Midwest have higher total days at bacterial condition percentages of 4%–8% than Western and Northeastern facilities with similar percentages of patient visits for bacterial conditions. When the mean prescribing days of antibiotics rather than total days are considered, regional differences attenuate (Figure 2B). Western and Midwest facilities comprise the majority of the upper section of the point cloud at the lower ranges of bacterial condition visit percentages, while Southern facilities with the highest burdens of patient visits for bacterial conditions have comparable mean prescribing days to other regions.
Monthly bacterial condition percent in VHA facilities versus total prescribing days (A) and mean prescribing days (B), stratified by region.

No regions show expected globally linear positive relationships between total days of prescribing and bacterial condition visit percentages when stratified by season (Figure 3). Instead, total days of prescribing peaks in facilities in all regions with ranges of bacterial condition visit percentages that are not at upper or lower extremes, and is highest in all seasons in facilities in the South. In contrast, when mean days of prescribing is considered by season and region (Figure 4), facilities in the Midwest and West with the lowest bacterial condition percent of visits have the highest prescribing durations.
Monthly bacterial condition percent in VHA facilities versus total prescribing days with smoothed fit lines stratified by region for spring (A), summer (B), fall (C), and winter (D).

Monthly bacterial condition percent in VHA facilities versus mean prescribing days with smoothed fit lines for stratified by region for spring (A), summer (B), fall (C), and winter (D).

Figure 4. Long description
Panel A: Spring. A scatter plot showing the relationship between bacterial condition percent (x-axis) and mean antibiotic days (y-axis) for the spring season. Data points are color-coded by region: Midwest (blue), Northeast (purple), South (orange), and West (green). Smoothed fit lines are included for each region. Panel B: Summer. A scatter plot showing the relationship between bacterial condition percent (x-axis) and mean antibiotic days (y-axis) for the summer season. Data points are color-coded by region: Midwest (blue), Northeast (purple), South (orange), and West (green). Smoothed fit lines are included for each region. Panel C: Fall. A scatter plot showing the relationship between bacterial condition percent (x-axis) and mean antibiotic days (y-axis) for the fall season. Data points are color-coded by region: Midwest (blue), Northeast (purple), South (orange), and West (green). Smoothed fit lines are included for each region. Panel D: Winter. A scatter plot showing the relationship between bacterial condition percent (x-axis) and mean antibiotic days (y-axis) for the winter season. Data points are color-coded by region: Midwest (blue), Northeast (purple), South (orange), and West (green). Smoothed fit lines are included for each region.
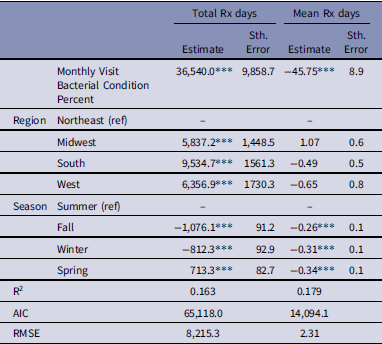
Models indicate that monthly bacterial condition visits percentages are positively and significantly associated with total antibiotic prescribing days but negatively and significantly associated with mean prescribing days (Table 2). Compared with facilities in the Northeast, facilities in other US regions are significantly associated with higher total antibiotic prescribing days but not with any significant differences in mean prescribing days. Season was significantly associated with total and mean prescribing days; Fall and Winter were negatively associated with total prescribing days compared to Summer while Spring was positively associated with total prescribing days, and all seasons were negatively associated with mean prescribing days compared to Summer.
GEE model results for total and mean prescribing days in facilities by month. Clustering within facilities based on facility ID and time waves by month/year was accounted for, an autoregressive correlation structure was assumed

Table 2. Long description
A table with 11 rows and 6 columns comparing total and mean antibiotic prescribing days across different regions and seasons. The columns are labeled ‘Monthly Visit Bacterial Condition Percent’, ‘Region’, ‘Season’, ‘Total Rx days Estimate’, ‘Total Rx days Std. Error’, ‘Mean Rx days Estimate’, and ‘Mean Rx days Std. Error’. The table includes data for regions Northeast, Midwest, South, and West, and seasons Summer, Fall, Winter, and Spring. Notable values include a significant positive association of monthly visit bacterial condition percent with total Rx days and a significant negative association with mean Rx days. Compared to the Northeast, the Midwest, South, and West show higher total Rx days. Seasons Fall and Winter show negative associations with total Rx days compared to Summer, while Spring shows a positive association. All seasons show negative associations with mean Rx days compared to Summer.
Significance: *** P < .001 ** P < .01 * P < .05.
Discussion
In the VHA, patient visits for bacterial conditions or resulting in an antibiotic prescription represented 5.8% of all 135 million patient visits from October 2022 through September 2024, and were observed for 10.1% of all 61 million unique patients. While facilities in the US South saw far more patients in far more visits than those in other regions, percentages of patients and visits for bacterial conditions or with antibiotic prescriptions were highest regionally in the Northeast. Variation within regions exists, however, with highest monthly bacterial condition visit percentages consistently observed in individual facilities in the south.
Prior research has indicated that the US South has higher rates of antimicrobial-resistant infections in VHA patients and facilities, potentially due to climate or social variables. Reference Carrel, Smith and Shi3,Reference Livorsi, Goto and Carrel5,Reference Carrel, Shi, Hasegawa, Bricker, Boyle and Goto9 Minor, though significant, seasonal variation in bacterial condition visit burdens are observed across VHA facilities, but the inclusion of all species of bacteria likely diminishes the appearance of seasonal effects typically observed in classes such as Gram-negatives or Staphylococci. Reference Leekha, Diekema and Perencevich6–Reference Perencevich, McGregor and Shardell8
Higher antibiotic use in the South has been well documented in outpatient claims and pharmacy data, and our findings are consistent with that literature. What prior studies have generally lacked, however, is a facility-level denominator of clinical need against which prescribing can be compared. By linking prescribing to the burden of conditions for which antibiotics are indicated, within a single integrated system with uniform formulary, coding, and record-keeping practices, this study shows that regional differences in total prescribing persist after accounting for the frequency of antibiotic-indicated visits, and that they are attributable to volume rather than to longer courses per prescription. This suggests regional variation is not explained by payer mix, coding practice, or differences in underlying condition burden alone.
While intraregional and seasonal variation in bacterial condition burden was anticipated, the high variability in total prescribing and the non-linearity of the observed relationship with infection burdens were not. Facilities in the South had far higher levels of total prescribing days than other regions, followed by the Midwest which had the highest total prescribing days when standardized by bacterial condition visits, and the highest levels of total prescribing were not observed at the highest levels of bacterial infection burden. This disconnect between patient need/provider perception of need and prescribing was not observed, however, when the outcome under consideration was mean prescribing days; in this case a negative relationship between monthly bacterial infection burden and prescribing duration was observed.
This difference, coupled with a peak in total prescribing at the middle of observed levels of bacterial condition burden, offers opportunities for VHA antimicrobial stewardship programs to focus their attention on facilities in the South and Midwest that perhaps have lower frequency of patients requiring antibiotics but prescribing practices that result in longer durations of antibiotic regimens. Alternatively, these facilities could serve different types of patients, such as those from rural locations, who are prescribed longer treatment courses in advance to prevent burdensome returns to the treatment facility. Reference Appaneal, Caffrey, Lopes, Dosa and LaPlante23
Compared to the summer months, total and mean prescribing days were lower in other seasons, except for the spring when total prescribing days is modeled. Longer durations could reflect clinician habit, a condition mix weighted toward infections requiring prolonged therapy (eg, skin and soft tissue, bone and joint), or patient factors such as rurality and comorbidity, none of which would increase the number of antibiotic-indicated visits. Total visit volume also varied modestly by season, with the lowest volume in winter (approximately 8% below spring), reflecting reduced routine and elective visits around the holiday period. Because bacterial condition burden is expressed as a share of all visits, part of the modest winter peak in visit percentage may reflect a smaller denominator of non-urgent visits rather than a true increase in infection-related care.
Limitations of the study include those related to patient composition and data management. Our bacterial condition burden measure was a composite union of visits with Tiers 1 and 2 diagnosis codes or associated antibiotic prescriptions. Because antibiotic prescribing was one component of this numerator, the measure is not fully independent of prescribing behavior; future work should decompose this composite into diagnosis-only, diagnosis-plus-prescription, and prescription-only components. We chose to include counts of patient visits resulting in an antibiotic prescription without an associated ICD code in Tiers 1 or 2 to capture more fully the prescribing behaviors within VHA, which could include either prescriptions for codes such as pneumonia which may be viral or bacterial in nature or for antibiotic prescribing done prophylactically for events such as tick bites.
While the VHA is the single nationwide provider of healthcare, enabling comparison across space and time in outcomes, the demographics of Veterans do not mirror those of the US more generally as Veterans tend to be older in age, predominantly male, and White. Due to data completeness, six facilities in Oregon, Illinois Washington and Ohio were excluded from the analysis; their spread across multiple Census regions likely limits the impact this has on the overall conclusions, however. Finally, decisions such as how to assign prescription refills, what types of patient visits were included in the total patient visit count (eg, not social work or lab only), calculation of bacterial condition visits from a list of candidate health record codes and seasonal delineations could impact findings. Reference Fleming-Dutra, Hersh and Shapiro31,Reference Degnan, Cluzet and David37
Higher likelihood of drug-resistant infections is linked to prior antibiotic exposure, and higher and increasing rates of drug resistance in the VHA have previously been observed in the US South. Though the US South has the largest number of VHA facilities and serves the largest number of patients, the share of their visits for bacterial conditions or resulting in an antibiotic prescription are similar to other regions. The total days of antibiotics some Southern patients are being prescribed, however, is not consistent with the burden of bacterial infections in their provider’s facilities, though average days of prescribing are. Outlier prescribing behavior, then, of longer duration than average, perhaps driven by clinician behavior, types of infections (eg, joint or valve), or patient characteristics (eg, rural residence), may be partially responsible for the higher rates of resistant infections observed regionally in facilities, and maybe be why area level investigations of social or environmental drivers of resistance are not detecting significant associations. This suggests that stewardship efforts should perhaps be directed towards shortening antibiotic courses in facilities that may not appear to be top candidates based upon levels of bacterial conditions that are not at the highest end of the observed range but for whom the mixture of infection types, provider behaviors or patient characteristics, such as rural patients, results in longer days supply of antibiotics.
Data availability statement
Data is not publicly available, and may only be accessed via permission from the Veterans Health Administration.
Acknowledgments
None.
Financial support
M.C. and Q.S. received support from the Centers for Disease Control & Prevention Epicenter program award CK000613 (total award amount $500,000). M.G. received support from the Agency for Healthcare Research and Quality under award number K08HS027472 (total award amount $741,346). M.B. reports no relevant funding sources. The views expressed in this article are those of the authors and do not necessarily reflect the position or policy of the Department of Veterans Affairs or the United States Government.
Competing interests
All authors report no conflicts of interest relevant to this article.



 Open access

