


Introduction
Results from general circulation models (GCMs) indicate that the Arctic sea-ice cover may exert a strong influence on global climate and may also be a sensitive indicator of climate change. Because of this, a knowledge of the heat and mass balance of the Arctic ice pack is critical in assessing potential impacts due to climate change. The ice-albedo feedback mechanism is nl particular importance, since the positive feedback between ice conditions and albedo may help to amplify small changes in climatic forcing (Reference Ingram, Wilson and MitchellIngram and others, 1989: Reference Manabe, Stouffer, Spelman and BryanManabe and others, 1991; Reference Rind, Healy, Parkinson and MArtinsonRind and others. 1995.) To examine the interaction of solar radiation with the ice cover on a large scale, information is needed regarding the relative areas of different ice types as well as the optical properties of the ice types.
Sea-ice surface conditions undergo large changes during the seasonal transition from spring to summer. During most of the year there is a homogeneous, highly reflective, Snow-Covered surface with little open water present. Once melt begins, this homogeneous surface transforms into a variegated surface comprising melting snow, bare ice. melt ponds and leads. Attendant with this transformation is a significant decrease in the areally averaged, wavelength-integrated albedo from approximately 0.8 to 0.5.
Melt ponds are a critical element in the heat balance of the summer sea-ice cover (Reference Ebert and CurryEbert and Curry, 1993; Reference Moritz, Curry, Thorndike and UntersteinerMoritz and others, 1993; Reference Ebert, Schramm and CurryEbert and others. 1995). Wavelength-integrated albedos for melt ponds range front 0.2 to 0.4 (Reference Grenfell and MaykutGrenfell and Maykut, 1977; Reference Grenfell and PerovichGrenfell and Perovich, 1984), and they can absorb as much as four times more solar radiation than bare ice or snow-covered ice. As melt ponds form, the albedo decreases and the amount of energy absorbed in the ice increases, thereby accelerating melting and providing a potential positive feedback mechanism. Field observations indicate that both the albedo of melt ponds, and the fractional area covered by them, can vary over a wide range and are continually changing during the melt season. Recent studies (Reference Morassutti and LedrewMorassutti and LeDrew, 1995; Reference Derksen, Piwowar and LeDerwDerksen and others, 1996) have examined the physical characteristics and the albedo of melt ponds on first-year ice. More information is needed regarding the distribution of the solar radiation deposited in a melt pond among reflection, absorption in the pond, absorption in the underlying ice and transmission to the ocean.
Significant amounts of solar radiation are input to the ocean through leads. An open lead absorbs over 90% of the incident solar radiation. Here, too, there is the potential for positive feedback, with solar radiation deposited in leads causing lateral melting, thereby increasing the size of the leads and consequently the input solar radiation to the region. The disposition of this energy among lateral melting, bottom melting, and warming of the water is a key issue. Larlier theoretical studies of summer leads (Reference ZubovZubov, 1945; Reference LanglebenLangleben, 1972: assumed that all of the solar energy deposited in a lead contributed to the lateral melting of the ice. More recent work Perovich. 1983: Reference Maykut and PerovichMaykut and Perovich. 1987; Reference PerovichPerovich and Maykut. 1990: Reference SteeleSteele. 1992; Mavkui and McPhee, 1995; Reference Sehramm and CurrySehramm and Curry. 1994 has indicated that this is not the ease, and that the magnitude and the character of ice decay are sensitive to how this heat is distributed among lateral milling, bottom ablation, and storage in the ocean.
To assess the impact of ponds and leads on the heat and mass balance of the ice cover, we need to understand the physical processes of individual leads and ponds, and we need information on the relative area of ice, ponds and leads and on the number and size of ponds and leads. In this paper the focus is on the second issue, and we discuss results Irom aerial photographs made during the 1994 Arctic Ocean Section cruise. These photographs were analyzed to determine the relative areas of ice, ponds and leads; the number, shape and size distribution of melt ponds; and the size of the aggregate scale for ice concentration and pond fraction. Results from a single day are examined in detail and compared to data from two other days. Computed estimates of the disposition of incident solar radiation among reflection, absorption and transmission are presented for these three cases.
Experiment and Methods
The Arctic Ocean Section experiment was a two-icebreaker transect across the Arctic Basin involving the CCGS Louis S. St. Laurent and the USCGC Polar Sea (Reference AsgaardAsgaard and others, 1996). The route was from the Bering Sea north to the Pole and south to Fram Strait. During this cruise we made a series of measurements investigating the optical and physical properties of the sea-ice cover. The cruise duration was from 25 July to 6 September 1994, encompassing the summer melt season and the ousel of fall freeze-up. The focus of our work was on studying the temporal and spatial variability of ice conditions, physical properties and albedos. As part of this effort, ten helicopter photography flights, each roughly 150 km long, were made to characterize ice-surface conditions and to extend surface-based measurements to the large scale.
A Nikon 35 mm camera complete with motor drive and a 250 frame roll of film was used to take 100-200 color photographs during each flight. A 50 mm lens was used, with an exposure time of 1/1000 of a second and an aperture setting of 2.8 or 4.0, depending on incident light levels. The focus was always set at infinity. The camera was mounted in a weather-protected box that was at attached to the floor of the Coast Guard HH 65A helicopter. The camera was mounted to look vertically downward, and was oriented so that the longer side of the film was aligned with the direction of flight. The standard flight path consisted of a modified box pattern around the ship, with four 25 and two 50 km-long legs. Low, overcast conditions and fog were common during the experiment, limiting when flights could occur and restricting the maximum altitude to between 100 and 700 m.
The photographs were developed and enlarged to 12.7 x 17.8 cm. They were then digitized using a flatbed scanner at a spatial resolution of 48 pixels cm -1 with 24 bit color. The use of color was critical in distinguishing between melt ponds and bare gray ice. These digital images were then processed on a personal computer using standard commercial software (Optimas, 1995). Using the full range of color it was possible to partition the surface in each image into four categories: bare and snow-covered ice, ponded ice, frozen ponds, and open water. Once an image was partitioned, the fractional area of each surface type was calculated to the nearest per cent, further analysis was performed to determine the number of melt ponds and to compute the pond area and shape factor. Due to the low altitude it was not possible to determine the floe-size distribution. However, the total lead perimeter was computed for each image. The lead perimeter and the amount of open wtiter are significant parameters in determining the amount of lateral melting (Reference PerovichPerovich, 1983; Mtiykut and Perovich. 1987; Reference SteeleSteele, 1992).
Results and Discussion
Most of this paper will concentrate on a single flight made on 31 July 1994 at 70°N, 172°W (Table 1). This flight was Selected for in-depth study since the melt season was well advanced and the surface illumination was excellent with no fog or low clouds. 160 photographs were taken from an altitude of 610m along a 142km flight track. Each photograph covered an area of 440 x 290 m. providing roughly 50% coverage along the length of the flight path. The total area covered by these photographs was 20.5 km2.
Summary of result from flights on 31 July, 13 August and 18 August 1994. The image size and total area have units of Km2. Percent areas are reported for ice (Ai), frozen ponds (Afp), melt ponds (Ap) and leads (Aw). Areally averaged values for the partitioning of the incident solar radiation are reported in terms of the percent reflected (a), absorbed in the ice (A) and deposited in the ocean (D)

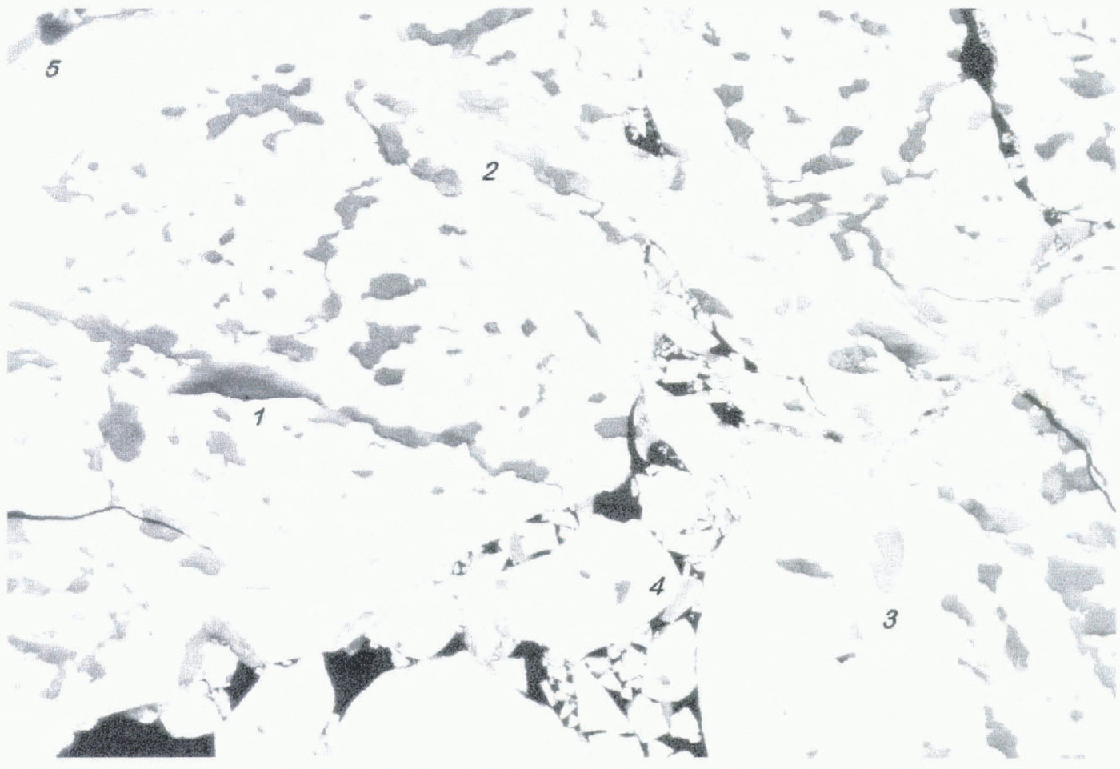
Several qualitative observations regarding the surface State of the ice, and inch ponds in particular, can be made by visually examining the images. The aerial photograph in Figure 1 provides representative examples of some of the general features of melt ponds. There were numerous melt ponds present along the entire flight path. The largest ponds actually consisted of several ponds connected by small tributaries. Ridges often had ponds associated with them, running parallel to the ridge. Melt ponds were many different shades of blue, from a light, whitish sky-blue to a dark blue-green. A very few ponds had melted through and appeared black, like the leads, There were some pond-like features at the edges of floes. These features are typically a result of lateral melting and erosion. Optically, they are similar to melt ponds, though they differ hydrologically from ponds since they are directly connected to the ocean. These edges are classified as ponds in our analysis.
A representative aerial photograph from the 31 July 1994 flight, The photograph was taken at an altitude of 660 m and has a horizontal scale of 440 m. Some general features of melt ponds are illustrated: the largest ponds were several ponds connected by small tributaries; ridges often had ponds associated with them: pond color ranged from a light, whitish sky-blue to a dark blue-green; there were pond-like features at the edges of floes; and a few ponds melted through and appeared black, like leads.
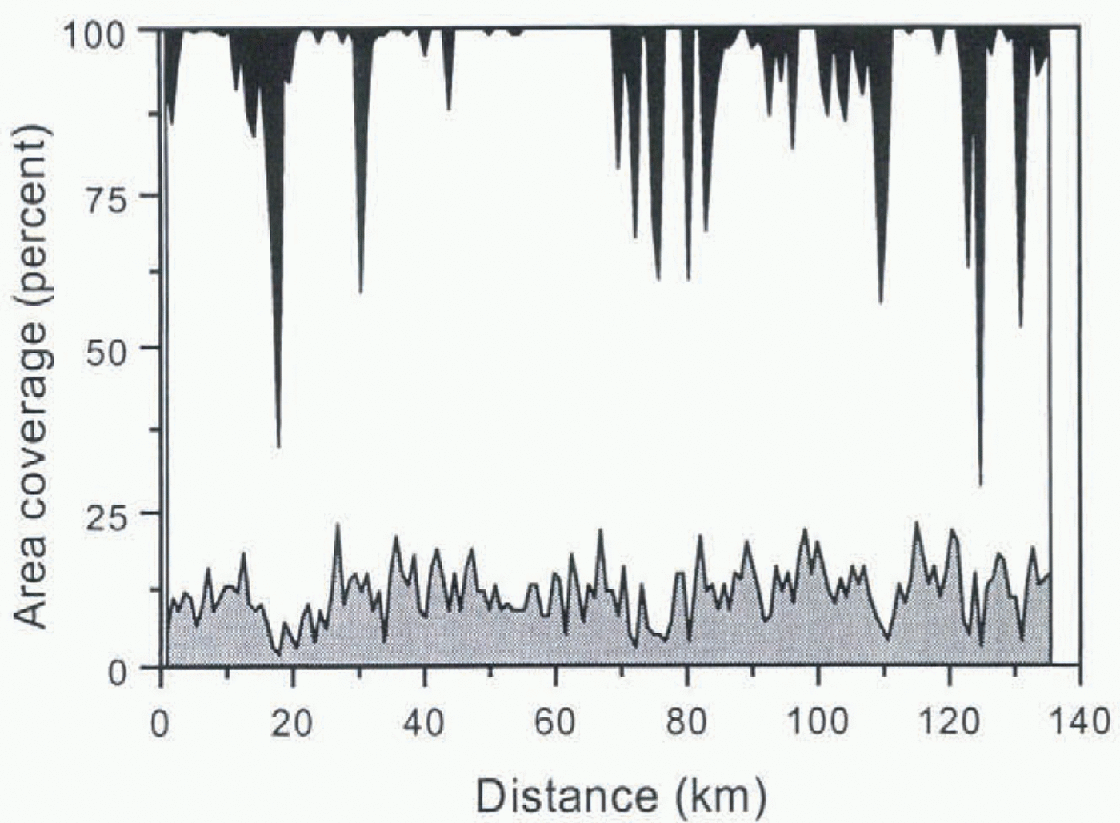
The relative areas of ice, ponds and leads along the flight path are plotted in Figure 2. There is a high degree of small-scale variability evident. The large discrete jumps of 30-60% in lead area are associated with the flight path crossing leads that were a few hundred m wide. Pond coverage fluctuated from 5 to 20%, exhibiting image-to-image variability even after adjusting for changes in the ice concentration. Combining results from all 160 images we found that there Wtts 82% ice, 12% melt ponds and 6% leads in the 20.5 km2 area studied.
Observations of the relative areas of ice, ponds and leads measured along the 142 km-long flight path on 31 July 1994. The pond area is light gray. The ice area white, and the lead area black.
An understanding of the state of the variables of the ice Cover on the aggregate scale is needed to link small-scale process-oriented models to large-scale climate models (Reference Moritz, Curry, Thorndike and UntersteinerMoritz and others, 1993). The aggregate scale can be thought of as the scale at which the sampling variability of a parameter is minimized i.e. the scale large enough to give a representative sample. We can use the relative area results from the individual photographs to examine the aggregate scale for ice concentration and pond fraction. Since we have data on only one scale, we simulate larger areas by averaging results from adjacent photographs. It should be noted that the number of samples decreases as the area increases. The standard deviation of ice concentration and pond fraction as a function of sample area is plotted in Figure 3.
Change in the standard deviation of ice concentration and pond fraction for progressively larger sample areas. Data are from 31 July 1994.

Both ice concentration and pond fraction exhibit a sharp initial drop-off, followed by a gradual tapering giving an aggregate scale dimension of roughly 2-3 km2. This result is somewhat tentative since we do not have enough areal coverage to extend the curves in Figure 3 to confirm that the standard deviation (std dev.) has reached a minimum value. Performing the same type of analysis on datasets from different locations and times of year would be valuable to investigate the variability of the aggregate-scale dimension, and to delineate between sampling variability and geophysical variability (Reference Moritz, Curry, Thorndike and UntersteinerMoritz and others, 1993).
We performed further analysis of the images to examine the characteristics of the melt ponds and leads in more detail. A subset of 131 photographs covering 17 km2 was processed to determine the number density, mean area, size distribution and shape factor for melt ponds. For this analysis, only ponds larger than 2m were included; smaller ones were below our resolution threshold. Ponds were plentiful in this region, there being more than 28000. Melt-pond-iiiimbcr densities calculated from individual images showed considerable variability, ranging from 1000 to 3500 km2, with a mean of 1794 km-2 and a std dev. of 494.
The size of the ponds also varied greatly, from 2 m2 ponds to ones as large as 8000m2. The 28 000 ponds measured had a mean and median pond area of 63 m2 and 14 m2. The cumulative probability distribution of pond area is plotted in Figure 4. Since a general description of pond area would be useful for modeling efforts, we applied data-fitting software (Jandell Scientific, 1994) to determine a functional relationship for the melt-pond size distribution. This size distribution is well lit (correlation coefficient = 0.999) by a two-parameter cumulative lognormal distribution of the form

where A is the area of the melt pond in (m2). The two parameters, μ and σ, are the mean and std dev. of the variable In(A) and have values of μ = 14.7 and σ= 1.73. There is excellent agreement between the observed cumulative distribution and the lognormal fit, except for ponds smaller than 5m2, where the lognormal lit predicts more ponds than observed. Fhis difference is a direct result of the observations not including ponds smaller than 2 m2.
Cumulative melt-pond size distribution for > 28 000 ponds taken from the 31 July 1994 photographs. The squares are the observations and the curve is the two parameter lognormal best-fit distribution.

As is evident in Figure 1, the shapes of melt ponds vary considerably from round to elongated to intricate interconnected webs. We explored this variability in shape quantitatively by computing the circularity of each melt pond. The circularit) is defined as C= P2/A, where P is the pond perimeter and A the pond area. The smallest possible value of C is 4π. corresponding to a circle. The value of C increases as the shape deviates from a circle. For example, C is equal to 16 for a square, 28 for a 5:1 rectangle and 484 for a 10:1 rectangle. The mean value of the circularity of all 28000 melt ponds was 35 and the median value was 27. These high values of circularity result from tin- elongated, and often complex, shapes of the ponds. There was no strong dependence between the circularity of a pond and its size, though there was a slight tendency for the biggest ponds to have high values of C This is consistent with our observation that large melt ponds actually consist of a connected networks of ponds.
The altitude of the helictipter was too low to allow measurement of the Hoc-size distribution. However, it was possible to estimate the ice area, lead area and floe-lead perimeter. Theoretical studies state that the disposition of solar radiation absorbed in leads and the lateral melting of those is dependent on the lead area and the floe perimeter (Reference PerovichPerovich, 1983; Reference Maykut and PerovichMaykut and Perovich. 1987: Reference SteeleSteele. 1992). In short, the greater the area of open water, the more solar radiation input to the ice-ocean system, and the greater the floe perimeter, the larger the fraction of that energy that contributes to lateral melting. Oflhe 20.5km area that was analyzed from the 31 July 1994 photographs. 19.3 km2 was cov ered by ice floes and 1.2 km2 was open water. The total lead-ice floe perimeter was 178 km.
Knowing the ice and lead area and the perimeter, estimates of the distribution of the solar radiation incident on the leads can be obtained from the results of previous modeling studies. According to the lateral-melting treatment of Reference Maykut and PerovichMaykut and Perovich (1987), a region of ice floes and open water can be considered to have an "effective" lead width equal to two times the lead area divided by the perimeter, or 15 m in this case. Their model, using meteorological forcing for the central Arctic during summer, predicts lateral-melt rates of approximately 5-7 cm d -1 for this case. Reference SteeleSteele (1992) developed tin ice ocean model that included the effect of Iloe geometry on melting by considering an ice coven if circular does with the same initial diameter. In such a treatment, the 31 July 1994 ice cover would be equivalent to approximately 137 floes of 422m diameter. the Reference Maykut and McPheeSteele 1992 model predicts for this case that roughly 10% of the solar radiation deposited in leads contributes to lateral melting, giving melt rales of less than a few cm d-1. The difference in predicted mell rates emphasizes the need for field observations of lateral melting and lead—ice interactions.
To provide a context for the 31 July 1994 observations, we analyzed photographs from flights on 13 and 18 August 1994 (Figure 5). The same analysis was performed, though it was for fewer images and consequently a smaller areal coverage. For these two flights, every tenth photograph was processed. Fhr results are summarized in Table 1. Taken in sequence, the three flighis moved northward towards the Pole, and progressed later in the season from summer to the onset of fall freeze-up. This transition is evident in the melt-pond results. The fractional pond coverage was similar between 31 July and 13 August, but by 13. August over hall the pond area had begun to freeze. By 18 August, at 88° N there were no open melt ponds. Also, by 18 August the photographs indicate that the leads were beginning to freeze and there was a significant amount of young ice present. It is interesting to nole that the smallest lead Iiaetion (6%) was on 31 July, even though that High: was the Ianhesl south and the elosesl to the peak of the melt season. This illustrates the spatial variability present in the ice concentration. The melted frozen pond Iiaetion was significantly smaller for the 18 August flight. We believe that this low value was due. at leasl in pari, to new snow covering that obscured frozen ponds and made them difficult to distinguish. This reaffirms the observation that as the surface begins to freeze and snow falls, the sin lace quickly becomes homogeneous.
Relalive areas of ice and partitioning of incident solar radiation for 31 July, 13 August and 18 August 1994. The contribution from different surface conditions to the disposition of the solar radialion is also shown.
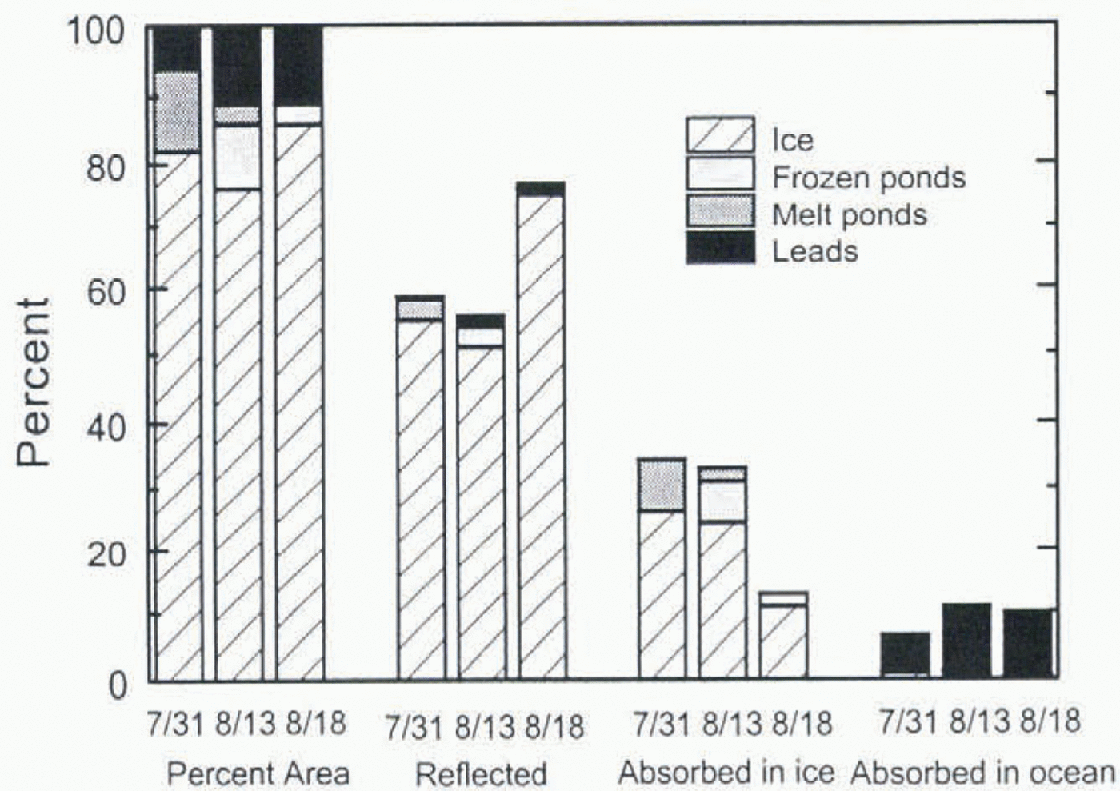
An important application of observations of the surface state of ice cover is determining the partitioning of solar radialion incident on the ice cover from reflection Io the atmosphere, absorption in the ice. and deposition in the ocean. The energy deposited in the ocean includes solar radialion absorbed in leads and what is transmitted through the ice. We were not able to make albedo measurements from the helicopter, and at present there is no effective way to make transmission measurements over a large area. We do however, have surface-based measurements of ice thickness, physical properties and albedo, and aerial observations of the relative areas of ice, ponds and water. This information was combined with a two-stream radiative transfer model Reference PerovichPerovich, (1990) to estimate the partitioning of incident solar radiation for 31 July and 13 and 18 August 1994.
Though the ice cover for these eases was a variegated mixture of many different ice types, as a first step we assumed that it was composed of four components: bare or snow-covered ice. ponded ice. frozen ponds, and leads. This assumption is a simplification, since, as Figure 1 indicates, there is considerable variability in the albedo and optical properties even for different melt ponds. From the surfacebased measurements we decided to assume that bare ice had optical properties similar to while ice Reference Grenfell and MaykutGrenfell and Maykut, 1977 and was 2.5 m thick in all cases: ponded ice comprised 25 cm of melt water over 223 em of ice: and on 18 August there was a light dusting of snow. Iii get an arcally averaged estimate of the distribution of the solar radiation the V tihics lot the individual components were weighted by their relative area and combined. Hcctuise Iettds and melt ponds have small albedos, significandy more energy is input to the ice ocean svsiem by them than by a similar-sized area of bare ice. As Rgure 5 indicates, even though leads are only a small portion of the total area ~10% . the) account for most of the energy deposited in the ocean (Reference Ebert, Schramm and CurryEbert and others. 1995). The presence of a thin, 2 cm layer of new snow on 18 August til 88°N increased the a really averaged albedo to 0.77, and reduced by a factor of three the absorption of solar radiation in the ice. This sharp reduction in absorption, coupled with generally decreasing values of incident solar radiation, brought an abrupt end to the summer melt season.
Summary and Future Work
Aerial photographs were analyzed to determine the relative areas of ice, melt ponds and leads. Results from one flight taken during on 31 July 1994 at 70° N, 172° W showed that bare ice covered 82% of the total area, ponded ice 12%. and open water 6%. There was considerable variabilis in the area fractions of ice ponds and lettds on settles < 1 km2. Selecting sample areas >2-3km2 appeared to give representative values of ice concentration and pond fraction. Melt ponds were ubiquitous, with a number density of 1800 ponds km2. The melt ponds had a mean area of 62 m, a median area of 14m2, and a size distribution that was well fit by a cumulative lognormal distribution. Results from flights on 13 and 18 August showed that the ponds began to freeze further north.
Further work is needed to extend these results to larger spatial and temporal scales. The advantage of analyzing aerial photographs is that the surface suite of the ice cover can be examined in detail and accurately. The main disadvantage is that considerable effort is required to survey a relatively small area. Ideally, photography missions should be flown at Iiiglier altitudes, allowing greater area! coverage. Using the same techniques and equipment, it would be possible to increase the altitude io 3000 m, and consequently the area! coverage of a photograph to 2 km2, and still be able to resolve features such as mell ponds. How ever, the low clouds and log so common in the Arctic during summer Iimil the opportunities for photography missions at heigher altitudes.
Monitoring changes in the suite of the ice cover at a particular locaiion from the onset of melt until fall freeze-up would be very informative (SHEBA Science Working Group 1994). Investigtiting the temporal evolution of mell ponds and letids by combining aerial surveys with surface-based observations could give significant insights into the mell processes of ice cover and the ice-albedo Feedback. Aerial surveys could provide information on changes in the area fraction, and number and size of ponds and letids. while surface-based measurements could monitor pond depth, ablation and morphology, and lead heating and lateral ablation.
Acknowledgements
The work was funded by the National Science Foundation, Office of Polar Programs: Arctic System Science (OPP-9504311). The authors thank J. Mason, B. Elder and H. Bos-worth for their able assistance with the image processing.



