I. INTRODUCTION
Polymer electrolyte membrane (PEM) fuel cells based on perfluorinated membranes have typically been operated in a temperature range of 50–80 °C. Reference Xu, Zhao, Zhu, Li and Chen1,Reference Yang, Srinivasan, Bocarsly, Tulyani and Benzinger2 Increasing the operating temperature of fuel cell improves the electrode kinetics of the oxygen reduction reaction. Reference Shen and Scott3,Reference Lee, Kim and Chang4 The ceiling temperature results from difficulty in maintaining membrane water content at temperatures above 100 °C. Temperature above the glass transition temperature (110 °C) for protonated Nafion® can cause polymer chains rearrangement, which can lead to structural changes in the membrane and lower the membrane stability, performance, and lifetime. Reference Xu, Zhao, Zhu, Li and Chen1–Reference Nuñez, Fenoglio and Resasco6 These are all the hurdles for operating fuel cell at higher temperatures.
However, polymer membranes that can be operated at elevated temperature of about 120 °C could benefit from enhancing carbon monoxide (CO) tolerance. Reference Yamaguchi, Kuroki and Miyata7,Reference Elfring and Struchtrup8 The most significant barrier to operating a PEM fuel cell at that temperature is maintaining the proton conductivity of the membrane. Reference Nuñez, Fenoglio and Resasco6–Reference Souza, Ribeiro and Schmal9 Higher temperatures increase the water vapor pressure required to keep a given amount of water in the membrane, thereby increasing the possibility of water loss and significantly reducing proton conductivity. There are different approaches to improve performance of PEM used in fuel cells. Three strategies are commonly used to tackle these problems. Reference Xu, Zhao, Zhu, Li and Chen1–Reference Berens and Hodge18
-
(i) Replacing Nafion® with alternative polymers, such as sulfonated polyetherketone, sulfonated polyaromatics, and polyheterocyclic.
-
(ii) Using acid-based polymers such as phosphoric acid doped polybenzimidazole (PBI).
-
(iii) Modify ionic conducting polymers by inorganic fillers such as silica, zirconium phosphate, and multilayered silicates.
The addition of an inorganic material into a polymer membrane can alter and improve physical and chemical polymer properties of interest (such as elastic modulus, proton conductivity, permeability, and tensile strength). The main reason for addition of inorganic fillers in fuel cell membranes is to reduce methanol permeability while keeping proton conductivity as high as possible. Many researchers have not been able to achieve a counter balance in those properties. In this study the filler material of interest is carbon nanotubes. This is because of their very interesting properties and capacity of improving the mechanical properties of polymer matrices. Reference Berens and Hodge18–Reference Shah, Kim and Paul20 There are problems associated with carbon nanotubes incorporated into PEM such as risk of short circuiting and its cylindrical shape. These make it difficult for CNTs to be evenly dispersed in a polymer as mentioned in previous studies. Reference Cui and Paul21 In this study such problems can be limited by modifying the surface of carbon nanotubes with carboxylic acid groups and amine functional groups. Reference Wootthikanokkhan and Seeponkai22
II. EXPERIMENTAL PROCEDURE
The Nafion precursor, i.e., a perfluorosulfonyl fluoride copolymer resin (Nafion R-1100 resin) was purchased from Ion Power Inc., Bear, DE. 95+% Pure Multiwalled carbon nanotubes with the outside diameter of 40–60 nm, inside diameter of about 5–10 nm, and a length of about 0.5–500 µm were supplied by Sigma Aldrich.
Pure CNTs were oxidized by refluxing with 5M HNO3 in a ratio of 0.1 g/10 mL for 1 h, followed by filtration (nylon filters 0.45 μm pore size) and washed with deionized water, to remove traces of acid. Oxidized CNTs (oCNTs) were then dried overnight at 110 °C under vacuum. A mixture of oCNTs (200 mg) and 2 g hexadecylamine (HDA) was refluxed for 4 h at 120 °C. After cooling to room temperature, the excess of HDA was removed by washing with ethanol several times. The solid (i.e., amine functionalized CNTs, fCNTs) was collected by Nylon membrane filtration (0.45 μm pore size) and dried at 110 °C for overnight under vacuum.
A. Membrane preparation
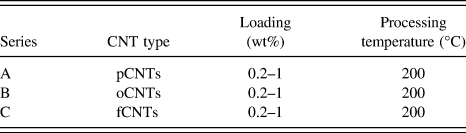
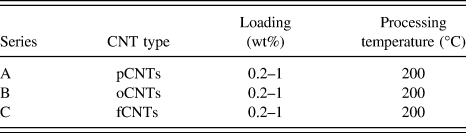
Nafion® nanocomposite membranes were prepared by melt-mixing the Nafion precursor with MWCNTs at 250 °C in a Reomix OS (AAKE) instrument, at a rotor speed of 60 rpm for 10 min. The CNTs were added after two minutes of melting Nafion inside the extruder. For each nanocomposite, the amount of multiwalled carbon nanotubes (CNTs) loaded was varied from 0.2 to 1 wt% to study the effect of CNT loading on the properties of Nafion. Nanocomposites were prepared with pure CNTs (pCNTs), oxidized CNTs (oCNTs), and amine (NH2) functionalized MWCNTs (fCNTs). The nanocomposite samples were then converted into sheets or films with a thickness range of about 0.12–0.2 mm using a Carver laboratory press at 2 MPa and 250 °C. The nanocomposites were then hydrolyzed, to allow cation exchange. These nanocomposites were immersed in a mixture of 15 wt% potassium hydroxide, 50 wt% of deionized water, and 35 wt% of dimethyl-sulfoxide at 80 °C for 2 h, followed by the repeated immersion (three times) in a fresh 5M HNO3 for 1 h to complete protonation. A series of nanocomposite samples were prepared to study the effect of CNT loading on Nafion properties as shown in Table I.
Processing parameters for Nafion nanocomposite preparation.
B. Characterization and property measurements
The FTIR measurements were conducted on a Perkin–Elmer Paragon 1000 (Perkin-Elmer, Shleton, CT) Fourier transform infrared spectrometer at room temperature (25 °C). The specimens were sufficiently thin to be within a range where the Beer–Lambert law is obeyed. A spectrum collected as the average of 64 scans with a resolution of 4 cm−1 was recorded from 4000 to 550 cm−1 for the transmission mode. The pressure was equal in all measurements to avoid difference brought by the pressure and penetrating depth.
The laser Raman spectrometer used in this study was a Dilor XY-multichannel Raman spectrometer, with a 514.5 nm Argon ion excitation laser. To reduce heating effects and degradation of the samples the laser power was set at 100 mW, thereby only probing at about 100 nm depth of the sample surface.
Dry membranes were manually fractured after cooling in liquid nitrogen, to expose their cross section. The morphology of the fractured sample surfaces was analyzed using SEM (LEO 1525), operating at an accelerating voltage of 3–10 kV.
The thermogravimetric analysis (TGA) was conducted on a TGA Q500 (TA Instruments) at a heating rate of 10 °C/min under air, from room temperature to 800 °C. Mechanical properties of pure Nafion® and its CNTs containing composite membranes were studied by a Perkin Elmer DMA 8000 in the dual cantilever bending geometry. The temperature dependence of loss tangent (tan δ, loss modulus/storage modulus) of all samples was measured at a constant frequency of 1 Hz with the strain amplitude of 0.02% from room temperature to 180 °C with a heating rate of 2 °C/min.
The bulk direct current (DC) resistivity of various membranes was measured at room temperature using the four-point collinear probe method. The equidistant tungsten carbide probes have a separation distance (s) and probe radius (r) of 0.127 and 0.005 cm, respectively. The 1 × 1 cm2 samples were prepared with a thickness of about 0.2 cm. The Keithley 4200-SCS Semiconductor Characterisation System (Keithley Instruments Inc., Cleveland, OH), equipped with a four supply-and-measure unit (SMU) and a pre-amplifier, was used to perform the high precision direct-current characterization by supplying currents ranging from 1 fA to 1 mA with a resolution of 0.1 fA. The resistivity changes as a function of probe spacing (0.127 cm) and is given by Eq. (1), where t is the thickness of the sample and s is the probe separation distance, for t >> s.
 $$\eqalign{ & \rho = 2\pi s{V \over I} \cr & \sigma = {1 \over \rho }\quad {\rm{.}} \cr}$$
Impedance measurements were carried out at 100% humidity and 26 °C in a frequency range 1 Hz to 1 MHz. The amplitude of the AC voltage was 5 mV. It is assumed that the resistance of the Nafion membrane is given by the high frequency extrapolation of the Nyquist plot to the real axis (Z′). At the lowest frequency values the impedance changes are dominated by the frequency response of the electrode–membrane interface. Using the membrane resistance values determined from the Nyquist plots and cell constants. The proton conductivity was calculated using the formula:
 $$\sigma ({\rm{S}}/{\rm{cm}}) = {d \over {RA}}\quad {\rm{,}}$$
where σ is the proton conductivity, d is the distance between electrodes (cm), R is the electrolyte resistance of the membrane (Ω), and A is the cross-sectional area of the membrane (cm2). The nanocomposite films were completely dried under vacuum at 90 °C for 24 h weighed (W dry) and then placed in water at 25 °C for 24 h. The nanocomposite films were then wiped quickly with filter paper and weighed (W wet). The water uptake was then calculated as
 $${\rm{Water}}\;{\rm{uptake}}(\% ) = {{{W_{{\rm{wet}}}} - {W_{{\rm{dry}}}}} \over {{W_{{\rm{wet}}}}}}100\quad {\rm{.}}$$
III. RESULTS AND DISCUSSIONS
A. Fourier transform infrared spectroscopy (FTIR)
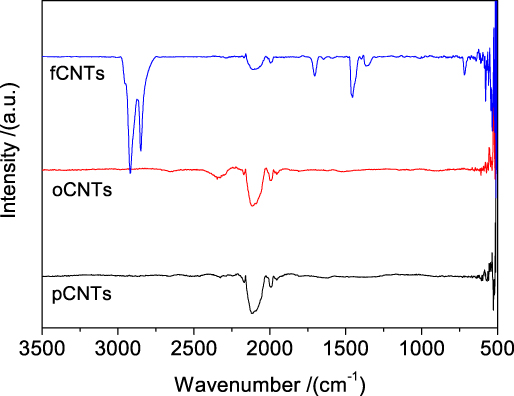
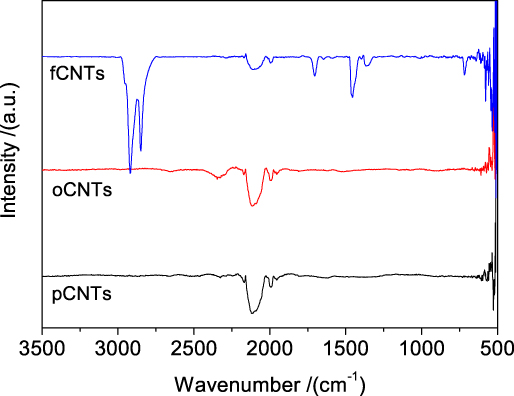
The resultant pCNTs, oCNTs, and fCNTs were characterized with FTIR, which is an effective technique for the investigation of modified CNTs. The FTIR spectra are shown in Fig. 1, pCNTs and oCNTs show similar peaks. The FTIR spectra of fCNTs indicate some peaks due to the grafted amine groups. The peaks centered at about 2900–2600 cm−1 are contributed by the N–H stretching vibrations. Reference Di Noto, Gliubizzi, Negro and Pace23 The broad peaks at around 1650–1590 cm−1 are assigned to the N–H deformation of the amine group. Reference Di Noto, Gliubizzi, Negro and Pace23,Reference Ludvigsson, Lindgren and Tegenfeldt24 This confirms that amino groups have been grafted into CNTs.
FTIR spectra of pure-MWCNTs (pCNTs), oxidized MWCNTs (oCNTs), and amine functionalized MWCNTs (fCNTs).
B. Raman spectra
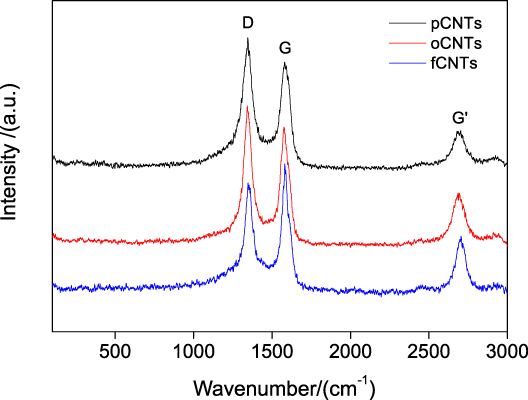
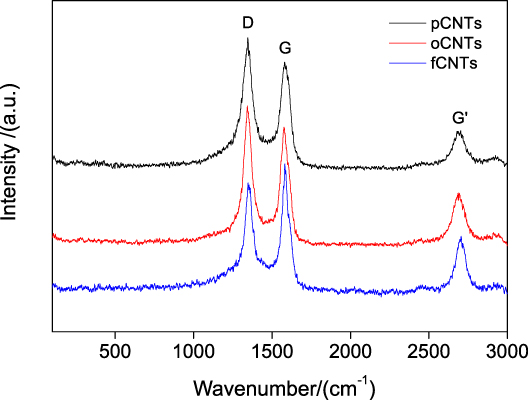
Figure 2 presents Raman spectra of pCNTs, oCNTs, and fCNTs. Three Raman bands of CNTs are strongly resonance enhanced. D, G, and G bands at about 1350, 1580, and 2700 cm−1, respectively. D-bands in the spectra are assigned to A1g modes or intermediate modes, which is attributed to disorder forms of carbon. Peaks appearing around 1580–2800 cm−1, correspond to the characteristic, E1g, and E2g modes or tangential modes of the graphite sheet. Reference Di Noto, Gliubizzi, Negro and Pace23–Reference Rotkin and Subramoney26 The ratio of the intensities of the G and D bands (I G/I D) gives a better understanding of the quality or purity of the tubes. The intensity ratio I G/I D of oCNTs decreased, this is attributable to the extent of the destruction of CNTs by strong oxidation. The C=C bond may be broken to yield a C–C bond, generating defects in the CNTs. For fCNTs the I G/I D ratio increased (this has never been seen before), as we expect the existence of grafted amine chemical groups in the tubes. However it can be due to the amine covering all the CNT impurities. There is no observable frequency shift in the G and D bands. This suggests that amine participated in the functionalization; otherwise, the intertube connection would show a frequency shift on the G band. Reference Rotkin and Subramoney26
Raman spectra of pure-CNTs (pCNTs), oxidized CNTs (oCNTs), and amine functionalized CNTs (fCNTs).
C. Morphology
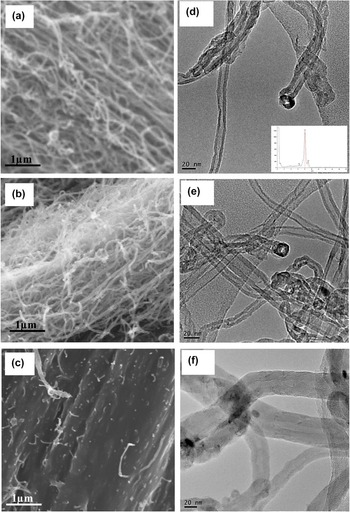
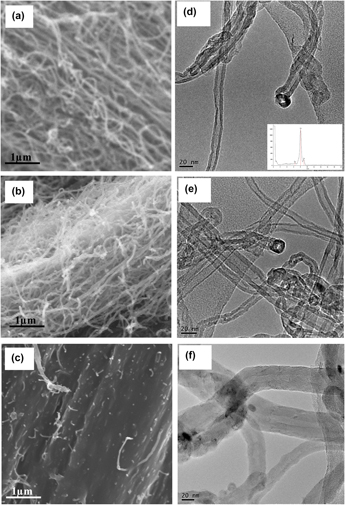
Figures 3(a)–3(c) show SEM images of (a) pCNTs, (b) oCNTs, and (c) fCNTs. All micrographs show bundles of CNTs with different morphologies. pCNTs are loosely bound to one another and aligned in one direction and oCNTs are loosely bound and randomly distributed. This suggests that carboxylic acid groups promote electrostatic repulsion. Whereas fCNTs are densely packed forming aligned bundles, which are covered by the amine. This can be attributed to the electrostatic attraction between the tubes in the presence of amine groups. The effect of oxidation and functionalization was also studied by TEM as shown in Figs. 3(d) and 3(e). TEM imaging of the sample reveals the presence of hollow CNTs with catalyst iron (Fe) on the tips of the tubes, this was verified by EDX analysis (see insertion). This suggest that Fe was not 100% removed from the as-received CNTs (pCNTs). TEM results also suggest that the structure of multiwalled CNTs remains intact after oxidation and functionalization.
The SEM micrographs of (a) pCNTs, (b) oCNTs, (c) fCNTs and TEM images of (d) pCNTs, (e) oCNTs, (f) fCNTs.

Figure 4 shows the cross-sectional surface morphology of the Nafion–pCNT composites with different nanotube weight loadings. In Fig. 4(a), N–0.2 wt% pCNTs, tubes are clearly distinguished in the micrograph as network like-structures within polymer matrix. The N–0.5 wt% pCNT composite membrane shows CNTs concentrated in one area. This is due to the poor dispersion of pCNTs in Nafion polymer. In Fig. 4(c), white dots attributed to CNTs are evenly dispersed in the polymer. This suggests a good dispersion of pCNTs in a polymer matrix. This suggests that 1 wt% of pCNTs is adequate to be evenly dispersed within Nafion® matrix compared to lower weight percentages.
SEM micrographs of the cross-sectional surface morphology of Nafion pCNT nanocomposites with different CNT weight loadings. (a) N–0.2 wt% pCNTs, (b) N–0.5 wt% pCNTs, and (c) N–1.0 wt% pCNTs.

Figure 5 shows SEM images of Nafion–oCNT composites with different weight loadings of the oCNTs. In Fig. 5(a), oCNTs are observed as interconnecting structures within polymer matrix. They are loosely bound and well dispersed within the polymer. As the oCNT loading is increased to 0.5 wt% within polymer, oCNTs form interconnected structure in the polymer matrices. Tubes are evenly dispersed but stacked compared to 0.2 wt% loading. In Fig. 5(c), oCNTs are well dispersed and stacked together in a polymer. This good dispersion observed with N–oCNT composite films is attributed to the compatibility of –COOH functional groups to the –SO2H groups of Nafion. Reference Cui and Paul21–Reference Di Noto, Gliubizzi, Negro and Pace23 This is also due to the Van der Waals forces with CNTs, which cause the CNTs to easily slide or rotate with respect to one another, forming near-ideal linear nanobearings. Reference Di Noto, Gliubizzi, Negro and Pace23 This suggests that –COOH acid groups promote such motion in the CNTs.
SEM micrographs of the cross-sectional surface morphology of Nafion–oCNT nanocomposites with different weight loadings of the oCNTs. (a) N–0.2 wt% oCNTs, (b) N–0.5 wt% oCNTs, and (c) N–1.0% oCNTs.

Figure 6 shows SEM micrographs of Nafion–fCNT nanocomposite membranes. In Fig. 6(a), a bundle of fCNTs is observed in some part of Nafion® membrane. The same is observed with N–0.5 wt% fCNT sample. This poor dispersion is associated with the NH2 functional groups, which promote electrostatic attraction forces between the tubes. This makes it difficult to disperse fCNTs within a polymer via melt-extrusion even though these tubes are soluble in some solvents. When 1 wt% of fCNTs is incorporated with a polymer matrix, tubes are hardly observed, they are imbedded within a polymer. This suggests that NH2 functional groups do not favor dispersion of CNTs within Nafion® due to the poor compatibility with sulfonic acid groups of Nafion® membrane.
SEM micrographs of the cross-sectional surface morphology of Nafion-fCNT nanocomposites with different weight loadings of the fCNTs of Nafion modified with (a) 0.2 wt% fCNTs, (b) 0.5 wt% fCNTs, and (c) 1.0% fCNTs.

The degree of dispersion of CNTs in the Nafion matrix was studied by SEM. Freeze-fractured surface was used for the morphological studies and results are presented in Fig. 7. These images show high-resolution images of nanocomposite samples with higher loading of 1 wt% CNTs, this is the only loading percentage where higher magnification could be reached. A good dispersion is observed when pCNTs [see Fig. 7(a)] were incorporated into the Nafion matrix. Although pCNTs are covered with polymer chains, however, homogeneous dispersion of aggregated CNTs is more discernible at a high magnification. Much higher level of dispersion of CNTs with less aggregation into Nafion matrix is obtained when oCNTs were used for composite preparation [see Fig. 7(b)]. This can be attributed to the high level of compatibility between the sulfonic acid groups of the Nafion and the COOH groups of oCNTs. Another reason may be due to the less Van der Waals interactions among the tubes after oxidation, which actually assist to disperse tubes homogeneously into the Nafion matrix. The poor dispersion of CNTs in the case of fCNTs-containing Nafion composite (Fig. 6) is due to the high degree of covering of CNTs' outer surfaces by HDA group.
SEM micrographs of the cross-sectional surface morphologies of Nafion nanocomposites. (a) N–1.0 wt% pCNTs, (b) N–1.0 wt% oCNTs, and (c) N–1.0 wt% fCNTs.

D. Electrical conductivity and water uptake of the membranes
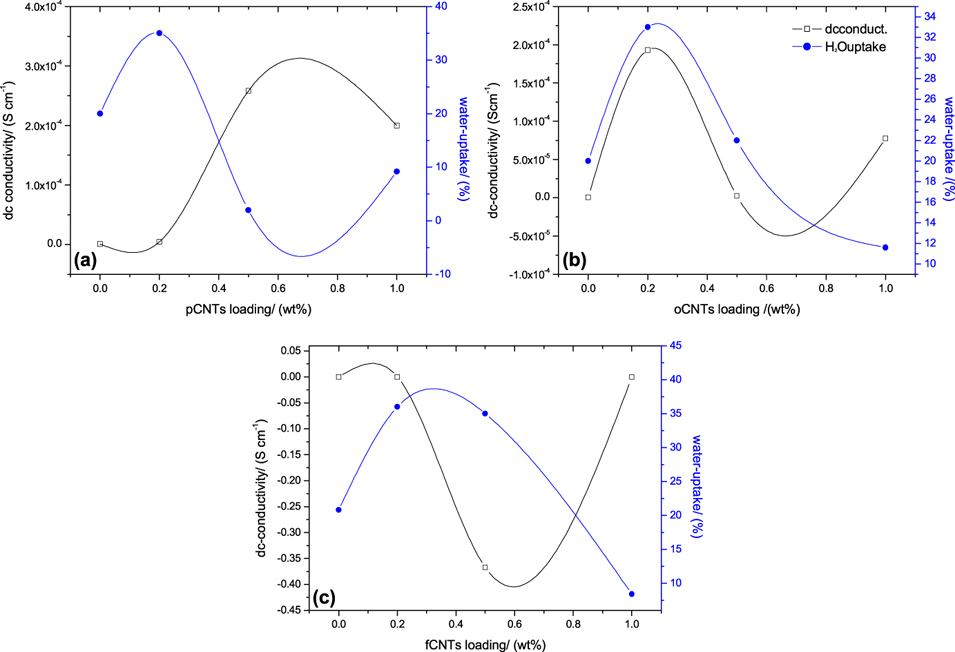
Figures 8(a)–8(c) show the relationship between both water-uptake and electrical conductivity versus the weight fraction of pCNTs in the nanocomposite membranes.
Electrical conductivity and water-uptake measurements of Nafion and nanocomposites with different filler loadings. (a) Nafion–pCNTs, (b) Nafion–oCNTs, and (c) Nafion–fCNTs.
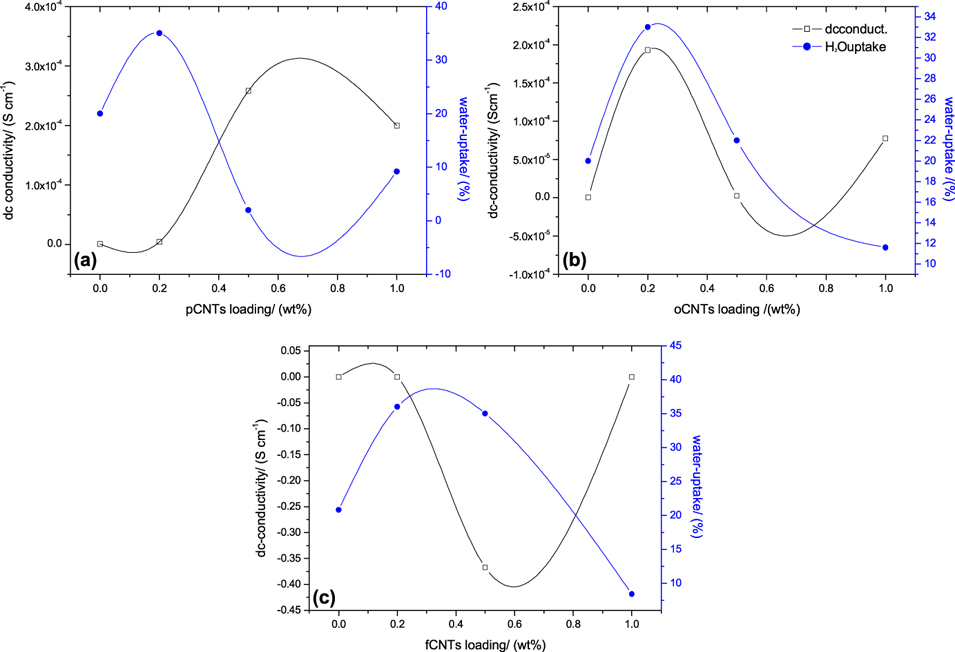
The electrical conductivity was conducted using the samples with thickness ranging from 0.3 to 0.4 cm, to avoid the probes from penetrating through the samples. The samples used from water uptake measurements were about 0.01–0.02 cm (typical membrane thickness). The water-uptake increases with Nafion–0.2 wt% pCNT nanocomposite membrane. This might be due to the surface modification of Nafion with higher surface area CNTs making the surface to be more hydrophilic compared to pure Nafion®. With an increase of pCNTs to 0.5 wt% within polymer matrix, the water-uptake of nanocomposites sharply decreased to about 4%. This is due to the pCNT bundles observed with SEM and OM images, which hinder most of the Nafion® surface to take up water. As the weight fraction of pCNTs within Nafion® increases to 1 wt%, the water-uptake of nanocomposites slightly increases to about 10%. As shown in Fig. 8(a), the bulk electrical conductivity remains at zero after incorporation of 0.2 wt% pCNTs. This suggest that 0.2 wt% of pCNTs does not have an effect on the electrical conductivity of Nafion®. The electrical conductivity increases with N–0.5 wt% pCNT nanocomposites to about 2.5 × 10⁻⁴ S/cm. The electrical conductivity of N–1 wt% pCNTs slightly decreases to about 2 × 10⁻⁴ S/cm compared to that of N–0.5 wt% pCNT nanocomposites. This is attributed to electrical percolation threshold of CNTs. The lower percolation threshold compared to previously reported values of about 4 wt% Reference McNallya, Potschke, Halley, Murphy, Martin, Bell, Brennan, Bein, Lemoine and Quinn25 is due to the dispersion of the tubes in polymer matrix. Nanocomposite preparation methods play a huge role in the morphology.
In Fig. 8(b), the water-uptake and electrical conductivity of Nafion increase with an incorporation of 0.2 wt% oCNTs. This electrical conductivity improvement is associated with the interconnected structures of the tubes observed in SEM micrographs. The water uptake increase is associated with the hydrophilic nature of COOH functional groups attached to the tubes. As the oCNT content increases to 0.5 wt% within polymer, both electrical conductivity and water-uptake decrease comparable to pure Nafion®. However, for N–1 wt% oCNTs water uptake further decreases and electrical conductivity slightly increases. A decrease in water-uptake with an increase in oCNT loading associated with water-uptake threshold of Nafion and barrier effect of CNTs. More CNTs in nanocomposites hinder absorbance of water molecules within polymer. The higher electrical conductivity is also due to higher content of the tubes in a polymer composite.
Nafion–fCNT composites show an increase in water-uptake to about 35% with N–0.2 wt% and N–0.5 wt% fCNTs as shown in Fig. 8(c). This is due to the hydrophilic nature of amine functional groups present in the composite membranes. However, water-uptake tends to decrease as the fCNT content increases to 1 wt%. This is due to the water-uptake percolation of the composite membranes. The electrical conductivity remains zero with N–0.2 wt% fCNTs and decreases below zero with N–0.5 wt% fCNT nanocomposites. This decrease in electrical conductivity suggests that this nanocomposite does not obey the ohmic behavior. Its resistance is negative, meaning the voltage increases with a decrease in current. This might be due to the amine which covers the tubes and polymer surface. Due to this behavior, these nanocomposites can be used to amplify an electric signal. This property of the N–fCNTs will be studied further in future. However, N–1 wt% fCNTs have electrical conductivity of zero, which is the same as that of Nafion and N–0.2 wt% fCNT nanocomposites. This suggest that fCNTs have no effect on the electrical conductivity of Nafion.
E. Thermal properties
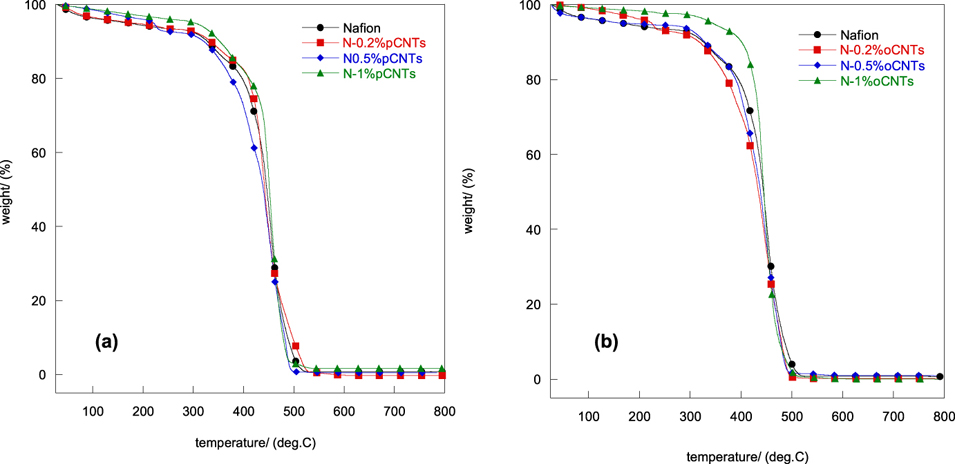
Thermal analysis was used to determine the degradation temperature of the nanocomposite membranes. Figure 9 shows TGA results of Nafion and CNT-based Nafion composite membranes with various CNT content. All membranes decompose in three degradation stages. Figure 9(a) shows samples, Nafion, N–0.2 wt% pCNTs, N–0.5 wt% pCNTs, and N–1.0 wt% pCNTs have the initial weight loss (1st stage) of 7.5, 6.2, 7.8, and 5.0% at (30–300 °C) respectively. This is attributed to loss of residual water within the membranes. The second degradation stage (300–430 °C) is associated with the desulfonation of sulfonic acid groups of Nafion®. Reference Wootthikanokkhan and Seeponkai22–Reference Ludvigsson, Lindgren and Tegenfeldt24 The third stage (430–550 °C) is related to polytetrafluoroethylene (PTFE) backbone decomposition. Reference Wootthikanokkhan and Seeponkai22–Reference Rotkin and Subramoney26 The degradation profiles for all samples are similar. However the onset degradation temperature is different. Nafion, N–0.2 wt% pCNTs, N–0.5 wt% pCNTs, and N–1 wt% pCNTs have degradation temperatures of 400, 410, 380, and 410 °C, respectively. The difference in the onset temperature is associated with sample's thermal stability. Poor thermal stability of N–0.5 wt% pCNT nanocomposites is attributed to the poor dispersion of CNTs within a polymer observed with SEM. This might also be due to the poor compatibility leading to weaker interaction between filler and polymer chains. These aggregates absorb heat and act as secondary heat source, therefore decomposing nanocomposites much quicker. A slight increase in thermal stability is observed with 0.2 and 1 wt% polymer nanocomposites. This is attributed to the good dispersion of pCNTs within a polymer observed with SEM results.
TGA spectra of Nafion and CNT-based Nafion nanocomposite membranes with different filler loading. (a) N–pCNTs, (b) N–oCNTs.
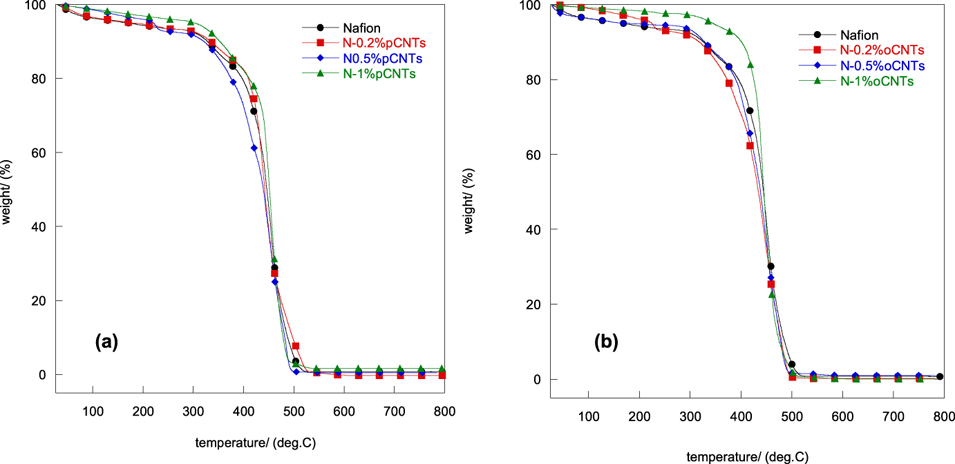
Figure 9(b) shows TGA profiles of N–oCNT composite membranes. In this case, the temperatures corresponding to the onset thermal degradation (Td) for Nafion, N–0.2 wt% oCNTs, N–0.5 wt% oCNTs, and N–1 wt% oCNTs are 400, 375, 390, and 410 °C, respectively. This shows an increase in thermal stability of Nafion with an increase in oCNT content. This is associated with ion exchange that occurs when COOH groups of CNTs interact with protons and sulfonate groups of Nafion and the intermolecular interaction between polymer and oCNTs. From the comparison of the curves, it is noted that the thermal decomposition of nanocomposites is dependent on the weight percentage of CNTs.
F. Dynamic mechanical measurements
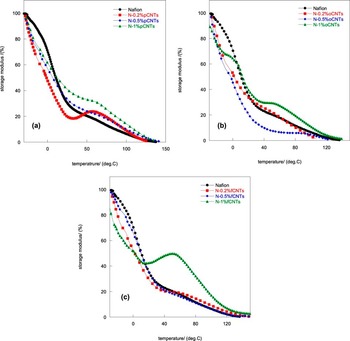
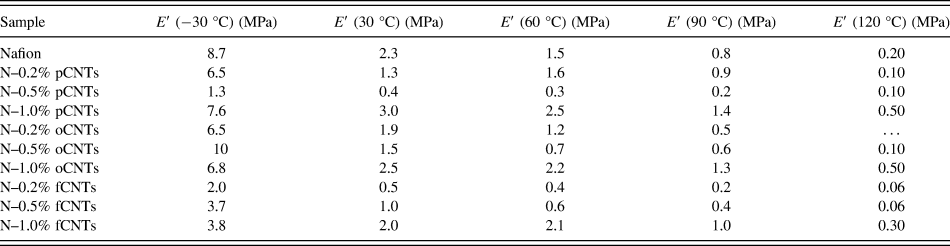
Operating the fuel cell at temperatures closer to the α-transition would be beneficial to its performance. This is because the ionic domains of the membranes will be more mobile and with reduced resistance. It is therefore important to understand the mechanical behavior of these membranes in such temperatures. Figure 10 shows the normalized plots of storage modulus as a function of temperature for Nafion® and (a) Nafion-pCNT, (b) Nafion-oCNT, and (c) Nafion-fCNT composite membranes. The actual values of storage modulus for all the membranes are listed in Table II. The moduli for all the samples decrease with an increase in temperature. The glass transition temperature is observed where the storage modulus curve is the minimum. This suggests that the higher storage modulus above 120 °C represents higher glass transition temperature and more stability of the materials.
DMA spectra of Nafion and its CNT-based nanocomposites with different CNT loading. (a) N–pCNTs, (b) N–oCNTs, and (c) N–fCNTs.

Average storage modulus (E′) values of membranes at different temperatures.
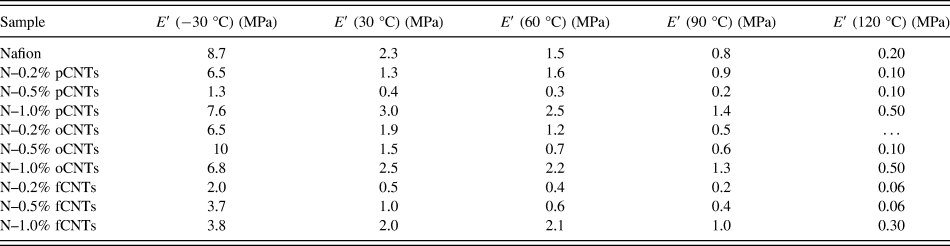
In Fig. 10(a), pure Nafion showed the highest storage modulus at lower temperatures compared to N–pCNT composites and N-fCNTs. N–0.5 wt% pCNTs have the lowest E′ at low temperature but the E′ decreases slowly as the temperature increases. At higher temperatures >50 °C, the percentage of E′ increases with an increase in pCNT content. This increase in resistance to deformation or stiffness is associated with immobilization of side chains in nanocomposites as the content of pCNTs is imbedded in polymer increase. This property is related to the thermal stability of these nanocomposites represented in the thermal stability section. Interestingly unmodified Nafion® has the highest storage modulus at lower temperatures. This suggests that all nanocomposites are softer than Nafion® at the lowest temperatures, while possessing superior resistance to deformation at higher temperatures. The E′ plots of N–0.2 wt% pCNTs show a peak at about 60 °C. This is due to the thermal condensation reaction between clustered tubes and Nafion. Reference Bikiaris, Vassiliou, Chrissafis, Paraskevopoulos, Jannakoudakis and Docoslis27 This feature is also observed with N–1 wt% pCNTs but not prominent.
Figure 10(b) shows E′ plot of N–oCNT nanocomposite membranes. N–0.5 wt% shows the highest E′ at lower temperature and the highest decrease in modulus. N–1 wt% shows the lowest decrease in storage modulus and remains stable at temperatures above 120 °C. This suggests that oCNTs enhance the rigidity of Nafion and there is greater interaction between the tubes and polymer. Nafion–fCNT nanocomposite membranes show a decrease in E′ compared to pure Nafion. However, N–1 wt% fCNTs show a higher E′ at higher temperatures. This is related to the deformation resistance of the side chains. All the samples show a continuous loss of storage modulus as temperature increases. Some transitions are happening between 40–80 °C. This transition might represent the change in elastic behavior of these composite membranes. Crum et al. reported this transition peak as the glass transition temperature of the membranes. Reference Crum, Buckley and Bucknall28–Reference Scharfer, Schabel and Kind30 This is a major transition for polymers as physical properties change dramatically from a glassy state to a rubbery state. The nanocomposites of 1 wt% fillers show a higher mechanical stability regardless of the type of CNT treatment.
G. Electrochemical impedance spectroscopy measurements
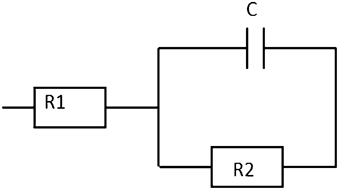
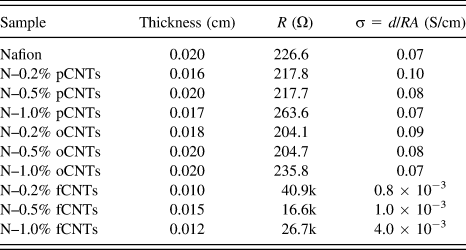
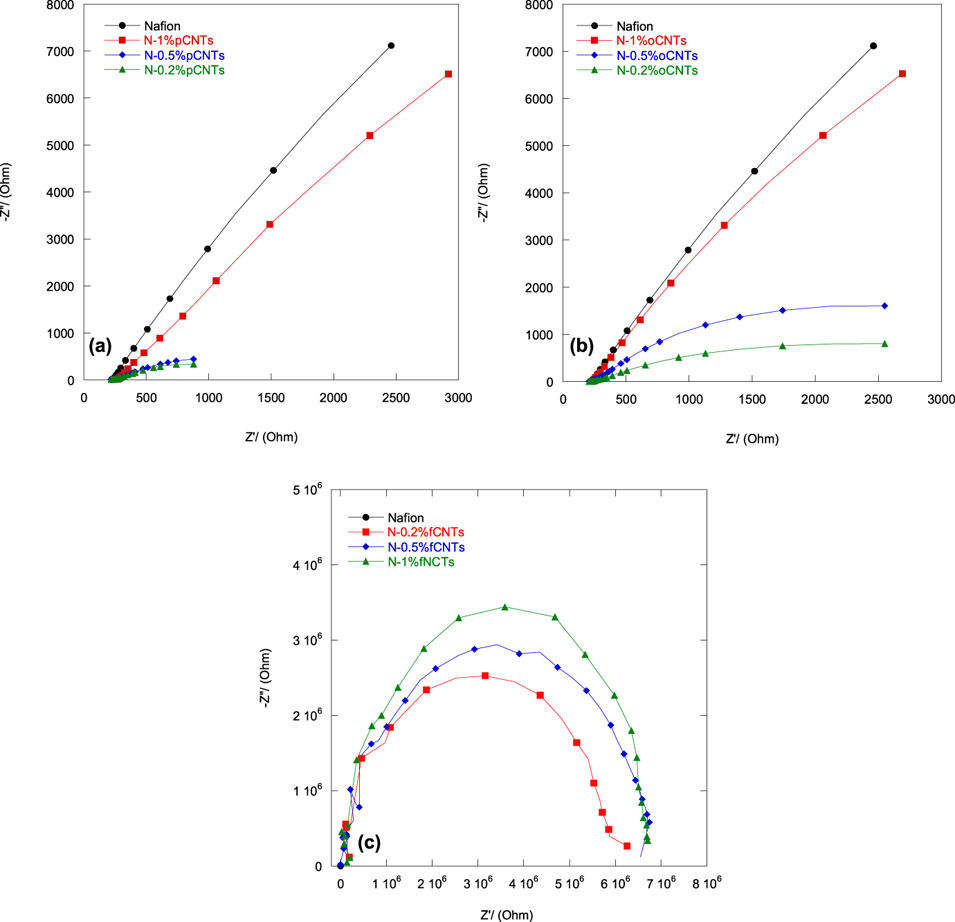
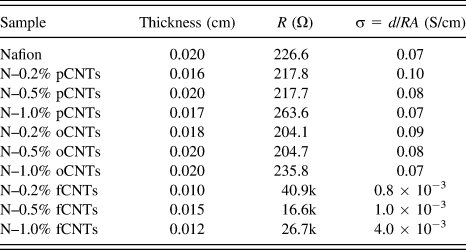
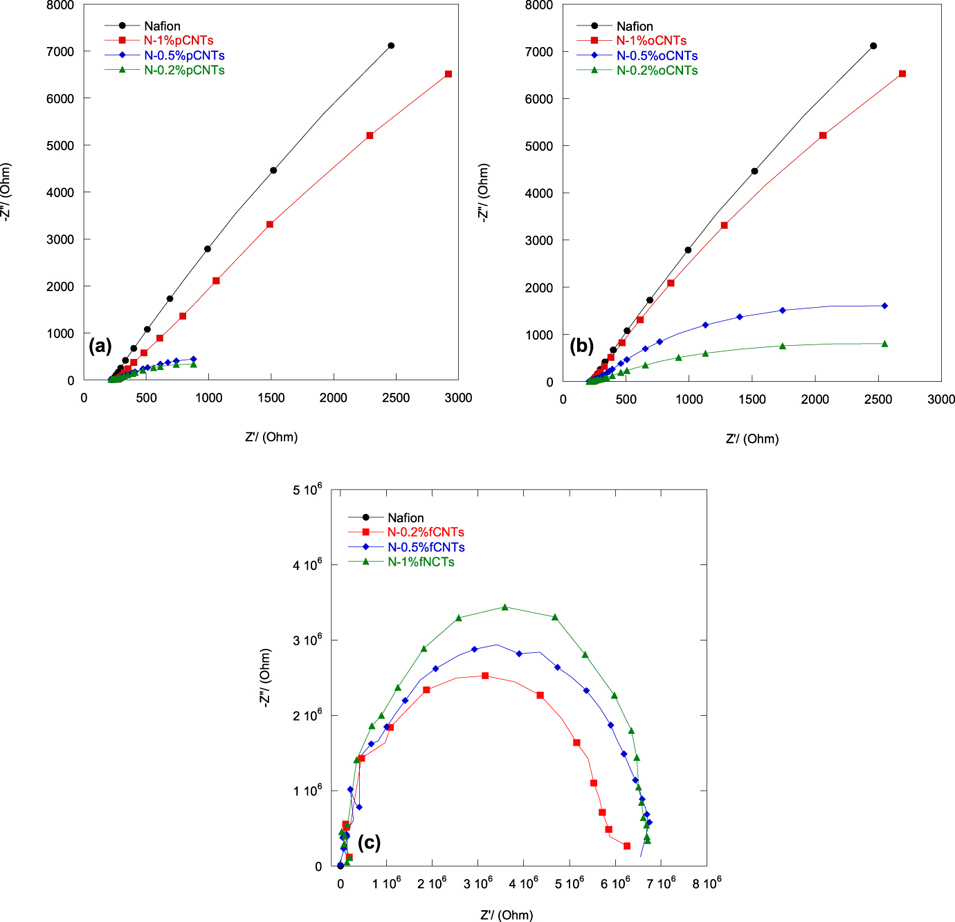
The equivalent circuit for all the membranes is shown in Fig. 11 and the fitting parameters and conductivity values are tabulated in Table III. Figure 12 shows the Nyquist plots for Nafion and its nanocomposite membranes. It can be observed that the position of the high frequency portion of the Nyquist plots keeps nearly unaltered for all samples. Correspondingly, the membrane conductivity values range from 0.07 S cm−1 to a final value of 0.10 S cm−1 for Nafion, N–pCNT and N–oCNT composite membranes. This suggests that the carbon nanotube content does not have much effect on the ionic conductivity of Nafion membrane. For N–fCNT composite membranes, the proton conductivity sharply decreases to about 0.8 × 10⁻³ S cm−1. The higher ionic resistance is associated with the amine treated CNTs within a polymer hindering the flow of protons. However, as the content of fCNTs within Nafion increases the proton conductivity increases to about 4 × 10⁻³ S cm−1.
The equivalent circuits for all the membranes, where R1 is the electrolyte resistance, R2 is the charge transfer resistance, and C is the capacitance.

Proton conductivity of Nafion® and its multiwalled nanocomposite membranes.
Nyquist plots of Nafion and Nafion–CNT composite membranes with different filler loadings. (a) N–pCNTs, (b) N–oCNTs, and (c) N–fCNTs.
IV. CONCLUSION
The results indicate that nitric acid functionalized tubes can be uniformly dispersed in a polymer by melt-extrusion method. The nanocomposites exhibit a very low electrical percolation threshold of about 0.5 wt% CNT loading. This very low percolation threshold is an indicative of good dispersion and the nanotube–nanotube distance required for electrical conductivity. The mechanical properties of nanocomposites show dependence on the loading of the tubes. At 120 °C, higher mechanical stability of nanocomposites was observed with 1 wt% CNT loading for all different types of the tubes. The proton conductivity does not depend heavily on the carbon nanotube loading, rather the chemical modification of the tubes. The average proton conductivity of about 0.09 S/cm was measured for N–pCNT and N–oCNT composite membranes. While N–fCNTs show very poor proton conductivity. N–pCNTs and N–oCNTs show better dispersion and good proton conductivity compared to N–fCNT nanocomposite membranes. N–1 wt% pCNTs and N–1 wt% oCNTs show balance in water uptake and proton conductivity, good thermal stability, and excellent mechanical properties. The DC electrical conductivity of the Nafion-based composites was improved when pCNTs were used as filler. The proton conductivity decreases with the incorporation of CNTs. Such observations suggest that filler amount must be reduced to maintain a higher resistivity and increase proton conductivity. On the basis of thermal and thermomechanical stability and proton conductivity, the oCNTs-containing Nafion composite membrane will be the best membrane for fuel cell applications. Further investigation to optimize the oCNT concentration in the Nafion matrix and to get a membrane with a balance of all properties is in progress in our laboratory.