Implications
Results from the present study highlight the importance of measuring body condition score (BCS) concurrently with ewe live-weight when attempting to characterise ewes, thereby enabling differences in BCS to be accounted for in any evaluation of ewe or flock credentials. Moreover, results from the present study highlight that live-weight adjustment for BCS should be undertaken by breed, parity and period of the inter-lambing interval. The impact is more informative metrics for benchmarking ewes or flocks but also more pertinent genetic evaluations.
Introduction
The necessity for more efficient and environmentally benign ruminant production systems has intensified interest in the monitoring and inter-flock benchmarking of efficiency-related key performance indicators. Because of the known large contribution of mature animals to the overall feed expenditure of the respective animal sector (Ferrell and Jenkins, Reference Ferrell and Jenkins1985; Montaño-Bermudez et al., Reference Montaño-Bermudez, Nielsen and Deutscher1990), the credentials of the mature flock are coming under ever-increasing scrutiny. Moreover, the often cited association between animal (metabolic) live-weight and maintenance requirements (National Research Council, 2001) has resulted in mature animal live-weight becoming a trait that is receiving special attention as a key performance indicator. The outcome is that mature ewe live-weight is being used as a proxy to compare not only individual animals but also flocks on expected feed requirements.
The contribution of BCS to differences in live-weight has already been documented in both dairy (Berry et al., Reference Berry and Evans2006 and Reference Berry, Macdonald, Penno and Roche2011) and beef cows (Drennan and Berry, Reference Drennan and Berry2006), with BCS being positively correlated with live-weight and explaining between 6% and 41% of its variability. Studies in mature ewes suggest stronger correlations than in cattle between BCS and live-weight (0.77 to 0.89; Sanson et al., Reference Sanson, West, Tatman, Riley, Judkins and Moss1993; Treacher and Filo, Reference Treacher and Filo1995; Sezenler et al., Reference Sezenler, Ozder, Yildirir, Ceyhan and Yuksel2011; Morel et al., Reference Morel, Schreurs, Corner-Thomas, Greer, Jenkinson, Ridler and Kenyon2016) with BCS explaining between 60% and 79% of its variability. Thus, when comparing animals or flocks on live-weight, some adjustment should be made for differences in BCS; by not doing so, thinner ewes may, on average, be perceived to be more efficient and thus favoured. The implications on health and fertility of poor BCS in mature females is well established in sheep (Corner-Thomas et al., Reference Corner-Thomas, Hickson, Morris, Back, Ridler, Stafford and Kenyon2015) and cattle (Berry et al., Reference Berry, Lee, Macdonald and Roche2007a and Reference Berry, Lee, Macdonald, Stafford, Matthews and Roche2007b; Roche et al., Reference Roche, MacDonald, Burke, Lee and Berry2007).
Although the mean live-weight associated with each BCS unit, for subsequent use as adjustment factors, is known in dairy cattle (Berry et al., Reference Berry and Evans2006 and Reference Berry, Macdonald, Penno and Roche2011), such adjustment factors are not well known in sheep. The BCS adjustment factors that do exist in sheep have originated either from small experimental studies (14 ewes – Sanson et al., Reference Sanson, West, Tatman, Riley, Judkins and Moss1993; 84 ewes – Treacher and Filo, Reference Treacher and Filo1995; 35 ewes – Frutos et al., Reference Frutos, Mantecón and Giráldez1997; 156 ewes – Sezenler et al., Reference Sezenler, Ozder, Yildirir, Ceyhan and Yuksel2011; 28 ewes – Morel et al., Reference Morel, Schreurs, Corner-Thomas, Greer, Jenkinson, Ridler and Kenyon2016) or from breeds less common in temperate regions (Treacher and Filo, Reference Treacher and Filo1995; Frutos et al., Reference Frutos, Mantecón and Giráldez1997; Sezenler et al., Reference Sezenler, Ozder, Yildirir, Ceyhan and Yuksel2011). Furthermore, differences exist among sheep studies in the BCS scale used; Sanson et al. (Reference Sanson, West, Tatman, Riley, Judkins and Moss1993) used a scale of 1 to 9, Sezenler et al. (Reference Sezenler, Ozder, Yildirir, Ceyhan and Yuksel2011) used a scale of 0 to 5, whereas both Treacher and Filo (Reference Treacher and Filo1995) and Morel et al. (Reference Morel, Schreurs, Corner-Thomas, Greer, Jenkinson, Ridler and Kenyon2016) used a scale of 1 to 5. The objective of the present study was to quantify the mean live-weight associated with each incremental change in BCS (scale 1 to 5) and determine if the extent of this association differed by parity, by a period of the inter-lambing interval and by breed. The breeds included in the present study were: purebred Belclare, Charollais, Suffolk, Texel and Vendeen as well as crossbreds.
Material and methods
Data
A total of 36 424 live-weight and BCS records from 25 246 ewes collected from 18 flocks between the years 2013 and 2017 (inclusive) were available. The data originated from two main sources: 16 commercial flocks that participate in the national sheep breeding programme operated by Sheep Ireland (http://www.sheep.ie) and two research flocks. Ewe BCS was evaluated by trained assessors on a 1 (emaciated)- to 5 (over fat)-point scale (Jefferies, Reference Jefferies1961) in increments of one. Ewe live-weight was recorded using electronic scales. Ewe live-weight was defined as the weight of a female who had at least one recorded lambing event. Only recorded ewe live-weights between 45 and 120 kg were retained. Only records where ewe live-weight and BCS were recorded on the same day were retained for analysis.
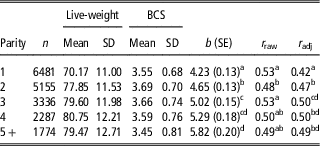
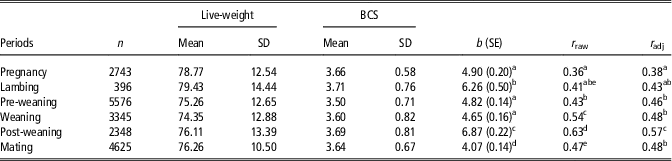
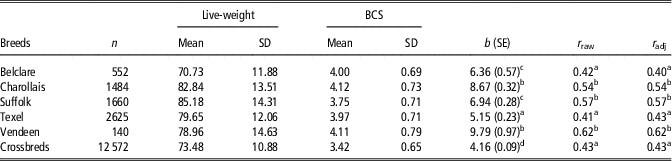
Data were also available on ewe parity and breed composition. The breed was categorised as: purebred Belclare, Charollais, Suffolk, Texel and Vendeen; all other ewes were crossbred ewes. Ewe parity was categorised as 1, 2, 3, 4 or ⩾5. Inter-lambing interval was defined based on six key production stages: pregnancy (i.e. 100 to 30 days pre-lambing), lambing (i.e. 20 days pre-lambing to 20 days post-lambing), pre-weaning (i.e. 201 to 80 days post-lambing), weaning (i.e. 81 to 130 days post-lambing), post-weaning (i.e. 131 to 180 days post-lambing) and mating (i.e. 181 to 280 days post-lambing). Ewe live-weight during pregnancy was adjusted for the weight of the foetus using the formulas of Wheeler et al. (Reference Wheeler, Reardon, Hedges and Rocks1971); gestation length was assumed to be 147 days. The adjusted live-weight was used in all subsequent analyses. Contemporary group was defined as flock-by-date of weighing, and only contemporary groups with at least 10 records were considered further. The final data set used in the analysis consisted of 19 033 records for BCS and live-weight from 7556 ewes. The number of records per parity, per inter-lambing period and per breed is in Tables 1–3, respectively.
Number of records (n), mean and standard deviation for live-weight and body condition score (BCS) in sheep as well as both the regression (b) of live-weight on BCS for each period of the inter-lambing interval and the raw correlation (r raw) between BCS and live-weight and the correlation following adjustment for fixed effects in the model (r adj)

a,b,c,dDifferent superscripts within column signify differences at P<0.05.
Number of records (n), mean and standard deviation for live-weight and body condition score (BCS) in sheep as well as both the regression (b) of live-weight on BCS for each period of the inter-lambing interval and the raw correlation (r raw) between BCS and live-weight and the correlation following adjustment for fixed effects in the model (r adj)

a,b,c,d,eDifferent superscripts within column signify differences at P<0.05.
Number of records (n), mean and standard deviation for live-weight and body condition score (BCS) in sheep as well as both the regression (b) of live-weight on BCS for each period of the inter-lambing interval and the raw correlation (r raw) between BCS and live-weight and the correlation following adjustment for fixed effects in the model (r adj)

a,b,c,dDifferent superscripts within column signify differences at P<0.05.
Statistical analyses
The Pearson correlation between BCS and live-weight was estimated across all data and also within each stratum of parity, inter-lambing interval and breed. The correlation between BCS and live-weight across all data was also estimated following adjustment for the class effects of contemporary group, parity, inter-lambing interval and breed. Correlations within each stratum of parity, inter-lambing interval and breed were also estimated following adjustment for the previously mentioned terms except the term representing the stratum under investigation. Whether the estimated correlations differed from each other were based on Fisher’s r-to-z transformation. All regression analyses were undertaken using a mixed model in ASreml (Gilmour et al., Reference Gilmour, Gogel, Cullis and Thompson2009) with live-weight included as the dependent variable and ewe parity considered as random. Initially, the association between BCS (treated as a continuous variable) and live-weight was estimated across all data at once; fixed effects included in this model were the contemporary group of flock-date of recording, parity, inter-lambing interval and breed. In subsequent analyses, a two-way interaction between BCS with parity, inter-lambing interval or breed was included to determine if the association between BCS and live-weight differed by stratum. Higher order regressions on BCS were also investigated to determine if non-linear associations between live-weight and BCS existed.
Results and discussion
Mean (standard deviation in parenthesis) BCS and live-weight of all ewes in the data set was 3.6 (0.72) units and 76.0 (12.40) kg, respectively. Parity, inter-lambing interval and breed were all associated (P<0.001) with live-weight. The correlation between BCS and live-weight in the entire data set was 0.48, implying that 23% of the variability in live-weight was explained by differences in BCS; when adjusted for contemporary group, parity, inter-lambing interval and breed, the correlation was 0.47. Treacher and Filo (Reference Treacher and Filo1995) reported a stronger correlation of 0.77 between live-weight and BCS in 84 Awassi ewes, whereas Sanson et al. (Reference Sanson, West, Tatman, Riley, Judkins and Moss1993) also reported a stronger correlation of 0.89 in 14 mature western-range ewes at slaughter. Across all ages and breeds, Sezenler et al. (Reference Sezenler, Ozder, Yildirir, Ceyhan and Yuksel2011) reported strong correlations of 0.73 to 0.82 between BCS and live-weight in 156 sheep of three indigenous sheep breeds in Turkey. In a population of 28 mixed-aged Romney-cross ewes, Morel et al. (Reference Morel, Schreurs, Corner-Thomas, Greer, Jenkinson, Ridler and Kenyon2016) reported a correlation of 0.81 between BCS and live-weight. Hence, the raw correlation of 0.48 between BCS and live-weight observed in the present study across all data is considerably weaker than observed in other sheep populations, although it is similar to the correlation of 0.49 and 0.55 between BCS and live-weight reported in dairy cows (Berry et al., Reference Berry and Evans2006 and Reference Berry, Macdonald, Penno and Roche2011). One possible reason for the weaker correlation between BCS and live-weight in the present study may have been due to several (trained) personnel being used to assess BCS in the present study; although details on the number of assessors used in other studies are not always provided, their relatively small population size over a short period of time suggests one or just a few assessors.
The regression coefficient of live-weight on BCS for the entire data set in the present study was 4.82 (SE=0.081), implying that a one-unit difference in BCS was associated with, on average, 4.82 kg live-weight. Although a quadratic regression coefficient of live-weight on BCS was statistically significant, the trajectory of the mean live-weight per unit change in BCS was almost identical when BCS was included as a linear or a quadratic term; hence only the solutions from a model with BCS included as a linear term are discussed further. Treacher and Filo (Reference Treacher and Filo1995) using a population of 84 Awassi ewes reported a regression coefficient of 11.8 kg live-weight per unit BCS on a scale of 1 to 5, which is more than twice that observed in the present study. However, if the covariance structure among records within ewe was not accounted for in the present study, and instead only a fixed effects model was used, the regression coefficient of live-weight on BCS was 7.25 (SE=0.10).
Parity
The association between BCS and live-weight differed (P<0.001) by parity; no such investigation appears to exist in sheep, although Sezenler et al. (Reference Sezenler, Ozder, Yildirir, Ceyhan and Yuksel2011) did investigate if the association differed by age of the ewe. However, the association between BCS and live-weight has been reported to differ by parity in dairy cattle (Berry et al., Reference Berry and Evans2006 and Reference Berry, Macdonald, Penno and Roche2011). The raw mean live-weight and BCS for each parity as well as the correlation between BCS and live-weight by parity and the regression coefficient of live-weight on BCS by parity are provided in Table 1. Mean BCS and live-weight both increased with parity up to parity 3 or 4, respectively, after which they declined. The raw correlation between BCS and live-weight varied little among parities ranging from 0.48 (parity 2) to 0.53 (parity 1 and 3); although some of these correlations differed (P<0.05) from each other, the biological significance of this difference is small. The correlation between BCS and live-weight, following adjustment for the contemporary group, inter-lambing interval and breed, varied from 0.42 (parity 1) to 0.50 (parity 3 and 4). The regression coefficient of live-weight on BCS for each parity varied from 4.23 (parity 1) to 5.82 (parity 5). The correlations reported between live-weight and BCS at breeding in three indigenous breeds of sheep in Turkey varied from 0.66 to 0.84 with age of ewe (Sezenler et al., Reference Sezenler, Ozder, Yildirir, Ceyhan and Yuksel2011); the correlations between live-weight and BCS at breeding from ages 2 to 4 years varied from just 0.83 to 0.84 implying little difference by age of ewe (Sezenler et al., Reference Sezenler, Ozder, Yildirir, Ceyhan and Yuksel2011) similar to that observed in the present study. Moreover, while Sezenler et al. (Reference Sezenler, Ozder, Yildirir, Ceyhan and Yuksel2011) did not undertake any formal statistical test of whether these correlations actually differed from each other, our calculations reveal that in fact their correlations did not differ (P>0.05) from each other, although (lack of) statistical power may have contributed to type II errors. The regression of live-weight on BCS at breeding in the same three breeds of indigenous Turkish sheep varied from 5.4 to 6.8 (BCS scale of 0 to 5; Sezenler et al., Reference Sezenler, Ozder, Yildirir, Ceyhan and Yuksel2011) with no consistent trend of regression coefficients by ewe age in years; no standard errors of the regression coefficients were provided to facilitate calculation as to whether the coefficients truly differed from each other. The correlation between live-weight and BCS in Irish and New Zealand dairy cows by parity varied from 0.51 to 0.59 (Berry et al., Reference Berry, Macdonald, Penno and Roche2011) and from 0.49 to 0.63 (Berry et al., Reference Berry and Evans2006), respectively, with many of them being different (P<0.05) from each other.
Period of inter-lambing interval
The association between live-weight and BCS differed (P<0.001) by a period of the inter-lambing interval and both the correlations and regression coefficients are summarised in Table 2. The correlation between BCS and live-weight varied from 0.36 (during pregnancy) to 0.63 (post-weaning); the correlation between BCS and live-weight, following adjustment for the contemporary group, parity and breed, varied from 0.38 (during pregnancy) to 0.57 (post-weaning). The regression of live-weight on BCS by period of the inter-lambing interval varied from 4.07 at mating to 6.87 post-weaning (Table 2). Across all data, Sezenler et al. (Reference Sezenler, Ozder, Yildirir, Ceyhan and Yuksel2011) reported correlations between BCS and live-weight in sheep at breeding, at lambing and weaning of 0.82 (n=156), 0.73 (n=152) and 0.75 (n=135), respectively; analysis of the provided data revealed that none were actually different (P>0.05) from each other. The regression coefficients of live-weight on BCS (scale 0 to 5) by stage of the inter-lambing interval evaluated by Sezenler et al. (Reference Sezenler, Ozder, Yildirir, Ceyhan and Yuksel2011) varied from 6.77 to 7.07, but no standard errors were provided.
In their analysis of 925 records from 299 beef cows, Drennan and Berry (Reference Drennan and Berry2006) reported a range in correlations between BCS and live-weight of between 0.24 to 0.51 by period of the year; given the seasonal calving system operated in Irish beef herds (Berry and Evans, Reference Berry, Buckley and Dillon2014), period of the year is synonymous with inter-calving interval. In their analysis of Irish Holstein-Friesian dairy cows, Berry et al. (Reference Berry, Macdonald, Penno and Roche2011) reported a range of correlations between BCS and live-weight of between 0.50 and 0.59 by stage of inter-calving interval; a range of 0.36 to 0.48 was reported by Berry et al. (Reference Berry and Evans2006) in New Zealand Holstein-Friesian dairy cows across stages of the inter-calving interval.
Breed
Breed in the present study was used as a proxy for frame size; the Suffolk is known to be a relatively large framed animal, whereas the Belclare and Vendeen would be regarded as smaller-framed breeds. Because BCS is a measure of subcutaneous fat, each unit increase in BCS is therefore expected to represent a greater mass of fat in larger-framed animals. This hypothesis was somewhat substantiated with the regression of live-weight on BCS varying from 5.15 and 6.36 in the smaller-framed Texel and Belclare, respectively, up to 6.94 and 8.67 in the larger-framed Suffolks and Charollais, respectively. Furthermore, the correlation between BCS and live-weight per breed varied from 0.41 (Texel) to 0.62 (Vendeen); the correlation between BCS and live-weight, following adjustment for the contemporary group, parity and inter-lambing interval, varied from 0.40 (Belclare) to 0.62 (Vendeen). Sezenler et al. (Reference Sezenler, Ozder, Yildirir, Ceyhan and Yuksel2011) also estimated the correlations between live-weight and BCS in three breeds of sheep, but calculations based on the information provided in that study revealed no significant difference in the correlation among breeds. Nonetheless, considerable inter-breed differences in the regression coefficients of live-weight on BCS were evident in the present study and should be considered especially in multi-breed genetic evaluations where one of the goal traits may be mature ewe live-weight.
Conclusions
The expected difference in live-weight between a BCS of 2 units and a BCS of 4 units (scale 1 to 5) was 9.64 kg in the present study when estimated across the entire data set; this represents 13% of the mean live-weight of the entire population. Moreover, the standard deviation in BCS across the entire data set was 0.72 units. Hence, large variability exists in BCS, and the impact on live-weight is substantial. Therefore any strategy, genetic or otherwise, that advocates lighter ewes should consider differences in BCS to avoid simply promoting thinner animals. The results from the present study indicate that BCS should ideally be measured concurrent with any weighing of animals and account should be taken of differences in BCS in any evaluation of ewe or flock characteristics. Moreover, the adjustment factors, either in the statistical model of analysis or through pre-adjustment factors, should be undertaken by breed, by parity and by a period of the inter-lambing interval as appropriate.
Acknowledgements
Funding from the Irish Department of Agriculture, Food and Marine Research Stimulus Fund GENCOST (11/S/133) and OVIGEN (14/S/849) is gratefully acknowledged.
Declaration of interest
The authors declare no conflict of interest.
Ethics statement
The data used in the present study originated from an already existing database.
Software and data repository resources
The data sets and programmes used in the current study are available from the corresponding author on reasonable request.