Identification of the species of origin of the milk used in cheese has a particular importance because of the possibility of detecting fraudulent procedures. These facts are of concern particularly in relation to authenticity and labelling regulations which require accurate declaration of product compounds, adulterations, and adverse reactions (allergies) towards some milk proteins.
Until now, various analytical approaches have been used for this purpose: isoelectric focusing (Addeo et al. Reference Addeo, Moio, Chianese, Stingo, Resini, Berner, Krause, Di Luccia and Bocca1990; Moio et al. Reference Moio, Sasso, Chianese and Addeo1990), HPLC (Mayer et al. Reference Mayer, Heidler and Rockenbauer1997; Moatsou et al. Reference Moatsou, Hatzinaki, Psathas and Anifantakis2004), ELISA (Beer et al. Reference Beer, Krause, Stapf, Schwarzer and Klostermeyer1996; Hurley et al. Reference Hurley, Coleman, Ireland and Williams2004) and capillary electrophoresis (Recio et al. Reference Recio, García-Risco, Amigo, Molina, Ramos and Martín-Álvarez2004). Serological tests are specific and sensitive, but cross-reaction of closely related species cannot be ruled out. Additionally, protein-based methods may fail because of the excessive proteolysis induced by high temperature treatments. More recently, DNA-based techniques have received particular attention. Lipkin et al. (Reference Lipkin, Shalom, Khatib, Soller and Friedmann1993) have demonstrated that it is possible to use milk as a source of DNA and a substrate for polymerase chain reaction (PCR). Milk from health mammary glands contains a large number of somatic cells (leukocytes and epithelial mammary cells) which persist during cheese manufacturing and ripening. Thus, residual DNA from nucleated somatic cells of milk or milk-derived products is exploited to identify unequivocally the nature of the product. Early approaches to identify components within mixed sample involve the detection of species-specific DNA sequences via PCR. At the present, most of the DNA-based studies for species identification in milk-derived products are based on specific PCR amplification of mitochondrial DNA (Bania et al. Reference Bania, Ugorski, Polanowski and Adamczyk2001; Maudet et al. Reference Maudet and Taberlet2001; Rea et al. Reference Rea, Chikuni, Branciari, Sangamaya, Ranucci and Avellini2001; Bottero et al. Reference Bottero, Civera, Anastasio, Turi and Rosati2002, Reference Bottero, Civera, Nucera, Rosati, Sacchi and Turi2003; Mafra et al. Reference Mafra, Ferreira, Faria and Oliveira2004). To date, the DNA-based tests for species identification do not rely on a single assay. The tendency is to use multiplex amplifications to perform simultaneous identification of different species as proposed by Matsunaga et al. (Reference Matsunaga, Chikuni, Tanabe, Muroya, Shibata, Yamada and Shinmura1999), Rea et al. (Reference Rea, Chikuni, Branciari, Sangamaya, Ranucci and Avellini2001) and Bottero et al. (Reference Bottero, Civera, Nucera, Rosati, Sacchi and Turi2003). However, the more fragments involved in the multiplexes, the greater the number of problems likely to occur not only in terms of amplification competition and false positives, but the band interpretation and reading of gel-based assays is also more difficult. Furthermore, selective amplification assays are not easily automated, and, since they are based on mt-DNA, further developments of DNA quantification tests are not reliable, since the number of mitochondrion for each cell is variable.
The objective of the present study was to solve the aforesaid problems by developing a reliable, fast and sensitive single test based on nuclear DNA, to be used for species discrimination in all the main species (cow, water buffalo, sheep and goat) involved in milk and milk-derived products.
Materials and Methods
Samples
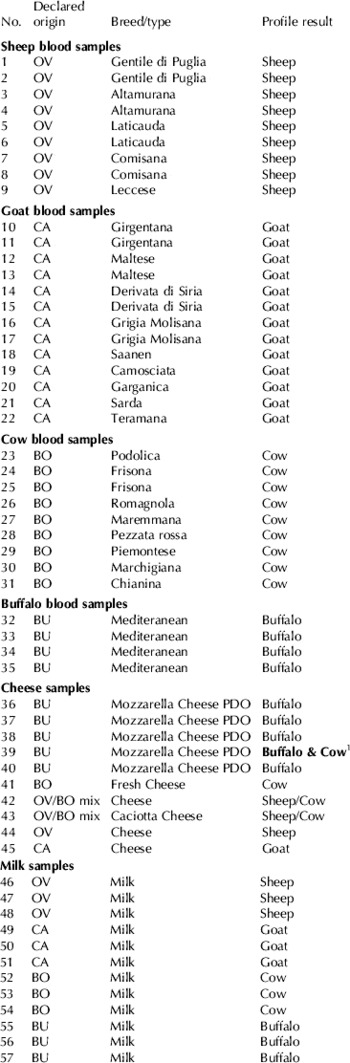
DNA used as the authentic standard was isolated from blood samples of different breeds from the following animal species: cow, buffalo, goat and sheep. DNA was also isolated from fresh bulk milk obtained from local farmers. Five mozzarella cheeses labelled PDO (Protected Designation of Origin) ‘Mozzarella di bufala campana DOP’ and cheese samples made from cows', ewes', goats' and buffalos' milk were analysed. All samples used in the study are listed in Table 1.
List of 57 samples analysed in the study and profiles obtained. The code in the column labelled ‘Declared origin’ is OV=Ovis aries, CA=Capra hircus, BO=Bos taurus, BU=Bubalus bubalis. Breed/type refers to breed of animal or the type of dairy product tested. Blood samples were used to test the method, cheese and milk samples to verify the quantitative applicability of the test

1 Sample 39 was declared as buffalo Mozzarella cheese but was found to contain a mixture of buffalo and cow milk. The profiles of all other samples were as expected
In order to evaluate the LOD (Limit of Detection) of the method, a progression of dilutions were prepared using a mixture of DNA belonging to the different individual species. First, genomic DNA from a cow was mixed with water buffalo DNA to obtain the following proportions: 50–50%, 75–25%, 82·5–17·5%, 93·75–6·25%, 96·87–3·13%, 98·43–1·57%, 99·21–0·79% and vice versa. Furthermore, DNA from different quantities of raw milk from cows and buffalos with a known number of cells per ml, were mixed and analysed in order to obtain a: 0·1, 0·3, 0·5, 1, 2 and 3% ratio of cells of one species to the other. For each sample, before mixing, the Somatic Cell Count (SCC) was determined using the optofluorimetric detection method with a Fossomatic 5000 (Foss, Denmark). Each mixture from which DNA has been isolated, was prepared to a final volume of 20 ml and 200,000 cells/ml.
DNA extraction
DNA for reference standard was extracted from 250 μl blood samples of different breeds of the four species considered in the study according to the Sambrook (1989) Protocol.
DNA was isolated from milk and cheese using the DNeasyTM Tissue Kit (Quiagen) with some modifications.
MILK: 20 ml Phosphate Buffered Saline (PBS) were added to 20 ml fresh milk and centrifuged at 1000 g, at 4°C for 10 min. In order to eliminate fat residues, additional washing was performed by adding 10 ml PBS to the resulting cell pellet and centrifuging. The obtained pellet was re-suspended in 220 μl PBS and purified based on the manufacturer's instructions until clean DNA was obtained.
CHEESE: 4 g cheese cut in small strips were added to 10 ml extraction buffer (50 mm-Tris-HCl, 20 mm-HCl, 1 mm-EDTA, 10 g SDS/l and 400 μg Proteinase K) and incubated in a water bath at 55°C for 1 h and at 70°C for 10 min. The subsequent purification steps were performed as described in the manufacturer's instruction manual.
The DNA concentration in all the samples was evaluated by gel electrophoresis.
Primer Design
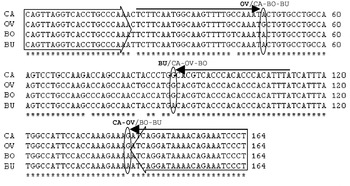
After a search in the NCBI database (www.ncbi.nlm.nih.gov) for gene sequences with a high level of homology among species, the κ-casein gene was selected. Amplification primers were designed in exon 4 regions with 100% homology among the most important species in milk production considered in the study (cow, water buffalo, sheep and goat), obtaining a 164 bp fragment, which is easy to amplify even from DNA isolated from heat-treated and processed food that can be degraded. Three conserved interspecific SNPs (single nucleotide polymorphism), whose allele combination generates haplotype that provides the unambiguous determination of each species, were located in the amplified fragment at position 48, 90 and 141. Extension primers were designed in region with a high percentage of homology among the different species. Different length polyA tail were added to the 5' ends to enable them to be used for minisequencing multiplex testing. Two out of three extension primers were designed in 100% homology regions, for the third the homology is not complete. Primer sequences and the overview of experimental design are shown in Table 2 and Figure 1.
Primers used in the study. Amplification primers were used to amplify the target fragment for all the four species under study, extension primers were used to perform the minisequence of the three SNPs which allow the species discrimination. SNP position indicates the position of the SNP in the fragment

Multiple sequence alignment of exon 4 k casein fragment amplified from each species. Large (large or bold type) empty arrows indicates amplification primers, narrow black arrows show extension primers, whereas the three polymorphisms analysed are indicated by oval circles.

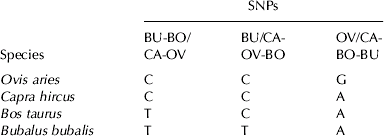
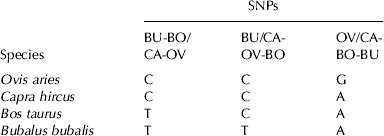
In Table 3 SNPs expected halotype pattern for each species is shown.
PCR
PCR reactions were performed in a total volume of 10 μl containing 20 ng DNA, 0·5 U AmpliTaq Gold® DNA Polymerase (Applied Biosystems, Foster City, CA) and 200 μM dNTPs, 1X PCR buffer, 2 mm-MgCl2, 0·3 μm of each primer (Table 2) synthesised by Sigma Genosys (Haverhill, UK) in a Mastercycler gradient (Eppendorf AG, Hamburg, Germany) under the following conditions: initial denaturation at 94°C for 5 min, touch down of 6 cycles at 94°C for 20 s, 60°C for 30 s (−1°C for each cycle), 72°C for 1 min, followed by 30 cycles at 94°C for 20 s, 55°C for 30 s and 72°C for 1 min, and a final extension at 72°C for 5 min. PCR products were visualised by 2% agarose gel electrophoresis in 0·5X TBE buffer and with a BioPhotometer (Eppendorf AG, Hamburg, Germany).
Single nucleotide primer extension
Amplification products were purified from primers and dNTPs residues through Exo-SAP treatment. A total volume of 10 μl containing 5 μl PCR product, 5 U Exonuclease I which degrades single-stranded DNA in a 3′=>5′ direction (New England BioLabs, Hertfordshire, UK), 1X Buffer Exo and 1 U SAP (Shrimp Alkaline Phosphatase, Promega, Madison, WI) were incubated for 1 h at 37°C and for 15 min at 75°C to inactivate the enzyme. The extension primers (Table 2) were designed in regions with 100% homology within the four species considered with the 3' terminal end, one base before polymorphism. For the primer extension reaction the following mix was used: 1 μl purified PCR product, 1·2 μm of each extension primer and 1·25 μl ABI Prism® SNaPshotTM Multiplex System SNaPshot premix (Applied Biosystem) in a total volume of 5 μl. The reaction contains ddNTPs only, which ensures that the DNA polymerase adds no more than a single nucleotide to a primer. The following conditions were applied: 25 cycles at 96°C for 10 s, 50°C for 5 s and 60°C for 10 s and 4°C for 10 s, according to the manufacturers instructions.
Three SNPs haplotype pattern for each species. This scheme is useful for species attribution to each profile obtained
Reaction products were purified by adding 0·5 μl 0·1 U/μl SAP and 0·5 μl Buffer SAP. The cycling conditions were: 37°C for 1 h and 75°C for 15 min. Purified products (1–2 μl) were added to 0·5 μl LIZ 120 internal standard (Applied Biosystems) and 7·5–8·5 μl Hi-Dye formamide (Applied Biosystems). The mixtures were denatured at 95°C for 5 min prior to loading on a capillary electrophoresis automatic sequencer ABI Prism 310 (Applied Biosystems) to detect the kind of nucleotide added to each primer, thus the type of mutation revealed, using POP-4 separation polymer at standard running conditions. GeneMapper Software Version 4.0 was used to analyse raw data and determine peak sizes.
Results and Discussion
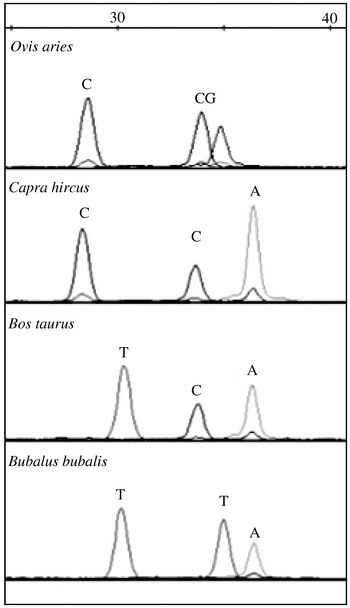
Two out of three extension primers are designed in 100% homology regions, for the third, the homology is not complete, but this does not affect its activity efficiency (Figs 1 & 2). Tests were carried out on 35 genomic DNA isolated from blood samples of cow, water buffalo, sheep and goat (Table 1) drawn from different breeds, in order to verify the specificity of primer pair amplification and the polymorphism conservativity among breeds of each species. All samples produced specific PCR fragments of the expected size and the minisequence analysis revealed the expected haplotype for each species.
Example of the three discriminating SNPs “SNaPshot peaks” obtained for each species.

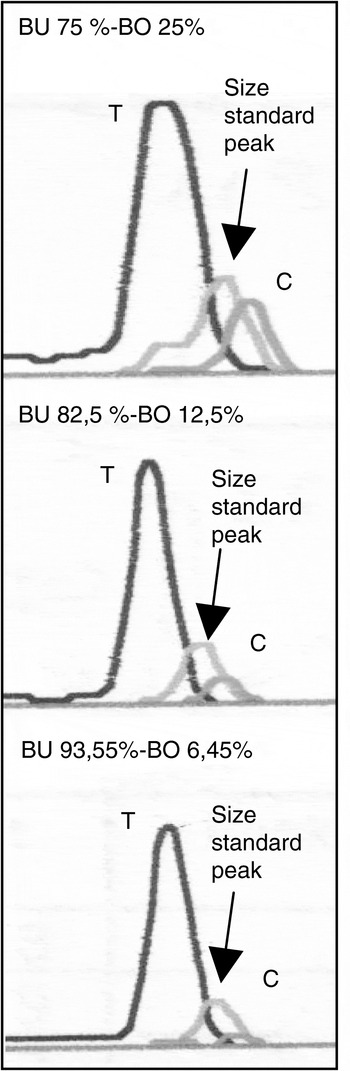
Example of haplotype for DNA quantitation. As a result of minisequencing with primer BUB-R1, two peaks were obtained (except the size standard one) one belonging to cow, the other one to bubalus. The ratio between the height of one peak and the sum of the height of both peaks, allows to estimate the percentage of one species in the sample analysed.

Amplicon length was restricted to 164 bp in order to enhance chances of amplification of DNA isolated from heat-treated and processed food that can be degraded. So far, mt-DNA has been the nucleic acid of choice in species identification assays because the greater number of mt-DNA copies per cell compared with nuclear DNA improves the success and the yield of DNA extraction. In fact, there can be more than one mitochondrion per cell and several copies of mt-DNA per mitochondrion. But only considering mononuclear genomic DNA the proportion of alleles reflects the amount of DNA present in the sample, hence it can be used in quantitative tests. In order to make progress in quantitative assays, genomic DNA has been chosen for our method, and drawbacks regarding low yield in DNA extraction have been overcome with the efficient extraction method and the small amplicon to amplify.
The sensitivity of the method estimating LOD, defined as the smallest concentration of somatic cells detectable as their concentration approaches zero, was determined. Particularly, in our study the LOD describes the smallest concentration of somatic cells of one species detectable in a mixture. An analysis was performed using dilutions of genomic DNA from cow and buffalo, the lowest percentage of cow in buffalo DNA obtained was 0·79%, thus encouraging us to perform further experiment using milk. Only two out of four species were considered in this experiment since DNA extraction protocol from milk has already been tested successfully on all the species and species provenience does not affect cell quality. DNA was then isolated from the milk of the two species mixed as a function of the number of somatic cells in order to obtain the desired ratio of each species. The method demonstrated detection sensitivity as low as 0·1% bovine milk mixed with buffalo milk, but it was not able to detect 0·1% buffalo milk mixed with 99·9% cows' milk. Other species combination were not tested, assuming that the method is transposable to other DNAs. SCC via optofluorimetric method may not have been completely accurate, thus leading to an alteration of the desired proportions. In both cases, however, it was possible to detect minor alleles in ‘0·3% cells’ samples. This data provides the order of magnitude of the LOD, which indicates that this method may be described as very sensitive considering that the official methods being used in the EU (Commission Regulation No. 213/01 of 9 January, 2001) and in Italy (Decree of the Italian Minister of Agricultural, Food and Forestry Resources, 1996), based respectively on isoelectrofocusing of γ-casein after plasminolysis (Addeo et al. Reference Addeo, Moio, Chianese, Stingo, Resini, Berner, Krause, Di Luccia and Bocca1989) and on HPLC (Pellegrino et al. Reference Pellegrino, De Noni, Tirelli and Resmini1991), have a detection limit of 1% and so it is the limit of toleration for involuntary cross-contamination during the cheese-making process (Commission Regulation No. 213/01 of 9 January, 2001). Previously, Plath et al. (Reference Plath, Krause and Einspanier1997) detected 0·5% cow's milk in cheese made from ewe's and goat's milk, the methods of Feligini (2005) and Mafra et al. (Reference Mafra, Ferreira, Faria and Oliveira2004) based on mitochondrial DNA have a detection limits of 0·1% and 0·5%, respectively.
The method has been tested with both processed and unprocessed food. Twelve samples of raw milk from local farmers, three from each of the four species considered, were analysed: all results obtained were coherent with haplotype expectations. Cheese samples labelled ‘pure’ or ‘mixed’, purchased from Italian supermarkets, were analysed to evaluate the applicability of the test to dairy products from the retail trade.
In all PDO-labelled Mozzarella di bufala campana DOP samples analysed (Fig. 3), a buffalo profile was found, but one (sample CH5) revealed both cow and buffalo profiles. The calculation was made on the basis of the relative fluorescences obtained from minisequencing from the cow and buffalo alleles, computing the cow's peak height on the sum of the heights of the two peaks, allowed an estimate the ratio of samples in CH5 to be 10% of cows' milk in buffalos' milk. In this case, the presence of 10% of cow's milk suggests a fraud. But lower quantity which give no economic advantage are unlikely to be adulteration (less than 1%, the limit of toleration for involuntary cross-contamination, as mentioned above) and may be a consequence of using, in sequence, the same production lines for different products, which occurs frequently in cheese plants in southern Italy (Bottero et al. Reference Bottero, Civera, Anastasio, Turi and Rosati2002).
Thus, the minisequencing method which shows a correlation between allelic frequency and relative fluorescence (Lee et al. personal communication), would be suitable for a quantitative detection of the proportion of two alleles within a sample. However, the calculation has to be made with the assumption that cow and buffalo milks mixed, were similar in number of cells/ml. The technique employed, can be used more reliably for the measurement of alleles when the DNA source is meat or meat-derived products rather than milk or cheese. Meat, in fact, is made up of cells which generally contain a single copy of the whole nuclear genome representative of the individual, and therefore of the species to which it belongs. The proportion of alleles found by using this test reflects the amount of meat present in the sample. Thus, the assay can also be applied to species detection in animal feed.
In conclusion, in this study we propose a new, fast and sensitive method able to detect the species composition of raw or processed milk and cheese from a variety of breeds of cow, buffalo, goat and sheep. To our knowledge, this is the first time that a method allowing simultaneous identification of the main species involved in milk production has been utilized. A test as sensitive as the one described here, better helps to label milks as single or double species and would guarantee species purity to consumers wishing to avoid certain milks, perhaps because of allergic reaction. In addition, the employment of nuclear DNA and SNPs, which may be used on an industrial scale in cost effective and high throughput assays, constitutes another step forward in the quantitative approach. The methods can be useful for anti-fraud institutions monitoring as well as for the food industry to control their productive standards.