Introduction
The advent of communication systems has profoundly impacted the way we communicate. These systems are now ubiquitous, embedded in a multitude of applications, including mobile telephony, television, and satellite communications. The exponential growth in the volume of data transmitted by these systems has necessitated the development of increasingly sophisticated modulation techniques, resulting in signals with greater amplitude variations and higher transmitter energy consumption.
Transistors are indispensable devices of radio-frequency (RF) power amplifiers, accounting for a large portion of the consumed energy. It is therefore imperative to optimize their efficiency/linearity performances at a given operating point. Given the increasing complexity of the applied signal, standard characterization tests-such as those using continuous wave (CW) or two-tone test signals-are insufficient for a thorough analysis of the device’s non-linear behavior [Reference Camarchia, Teppati, Corbellini and Pirola1–Reference Farsi, Draxler, Gheidi, Nauwelaers, Asbeck and Schreurs3]. These conventional tests do not adequately permit a substantial examination of the device’s response to complex modulation signals, which more accurately represent real-world operational conditions. The phenomenon can be explained in two ways. Firstly, signals with a single carrier do not provide sufficient data to characterize transistors with regard to features such as error vector magnitude (EVM) and noise power ratio (NPR), which creates a challenge in evaluating a model for wireless applications [Reference Teppati, Ferrero, Camarchia, Neri and Pirola2]. Secondly, these signals do not possess an envelope shape similar to that of modulated digital signals [Reference Su, Cai, Zheng and Sun4].
EVM measurements are of significant importance because this metric aggregates the impact of all potential impairments in a system, such as thermal noise, phase noise, IQ imbalance, and nonlinearities, into a single value. This value is directly linked to constellation distortion and system error performance. Furthermore, it is a standardized demodulation-based metric that is required by 3GPP New Radio (NR) Base Station (BS) specifications. This metric is employed for the purpose of design compliance and optimization [Reference Manurkar, Silva, Horansky, Williams and Remley5–Reference Acar7].
In this context, the NPR is a relevant metric because it emulates realistic multicarrier signals and quantifies the tendency of nonlinear and broadband components to create distortion and intermodulation products that fill a notched channel. Furthermore, under certain conditions (e.g., when the excitation is dense or noise-like, as with multicarrier or OFDM signals), it is possible to estimate the EVM value using the NPR without needing symbol timing or synchronization [Reference Kester8–Reference Freiberger, Enzinger and Vogel10].
Given the conditions for equivalence between EVM and NPR metrics, [Reference Sombrin11], an innovative measurement bench based on the PNA-X was developed [Reference Silva dos Santos, Reveyrand, Gaillard, Medrel, Nebus, Prigent, Nallatamby and Chang12–Reference Gillet, Teyssier, Hajjar, Gasmi, Kacou, Prigent and Quéré14].
A simplified multi-frequency signal, designated as unequally spaced multi-tones (USMT) [Reference Farsi, Draxler, Gheidi, Nauwelaers, Asbeck and Schreurs3, Reference Gillet, Bouslama, Teyssier, Prigent, Nallatamby and Quéré13, Reference Laurent, Teyssier, Quere, Sombrin and Prigent15], was employed for the purpose of characterizing the linearity of the device under test (DUT). The USMT signal is designed to closely match the statistical properties-such as probability density function (PDF) and peak-to-average power ratio (PAPR)-of complex applicative signals, ensuring it accurately represents real-world operating conditions. The key point in this test signal lies in the fact that no intermodulation tones will overlap with injected carriers, such that C/I metric is not affected by the choice of the phases of the tones. As already reported, one of the major benefit is that it considerably smaller number of carriers is necessary, simplifying the study of harmonics and intermodulation products. A notable benefit of this signal is its PAPR insensitivity to the phase of each carrier [Reference Gillet, Bouslama, Teyssier, Prigent, Nallatamby and Quéré13].
The number of carriers in the signal (N) is directly related to the PAPR of the signal by the relationship  $\mathrm{PAPR (dB)} \approx 10 \log (N)$ [Reference Gillet, Bouslama, Teyssier, Prigent, Nallatamby and Quéré13, Reference Gibiino, Angelotti, Santarelli, Filicori and Traverso16]. Therefore, the number of carriers in the USMT signal should be set based on the complex modulation selected for comparison purposes in order to make the PAPR and, subsequently, the CCDF as close as possible to those present in the desired complex modulation [Reference Gibiino, Angelotti, Santarelli, Filicori and Traverso16].
The use of the PNA-X to characterize the non-linearity of electronic devices is attracting increasing interest. Some of the research carried out includes using the Spectrum Analyzer option to measure the USMT signals described above, which allows the measurement of carriers and intermodulation products separately [Reference Gillet, Teyssier, Reveyrand, Laurent, Prigent and Quéré17]. Alternatively, the PNA-X can be employed as a receiver. Employing a frequency domain analysis and executing frequency-swept narrowband relative measurements enables the assessment of linearity figures of merit such as ACPR and EVM when complex modulated signals like LTE (long-term evolution)/OFDM (orthogonal frequency-division multiplexing) are applied to the device [Reference Verspecht, Stav, Nielsen and Kusano18–Reference Gibiino, Angelotti, Santarelli and Traverso20]. It is also possible to characterize devices with multiple ports [Reference Schulze, Mengozzi, Gibiino, Angelotti, Florian, Santarelli, Heinrich and Bengtsson21, Reference Niubó-Alemán, Liang, Hahn, Reynoso-Hernández, Teyssier and Roblin22].
The PNA-X can be integrated with a VSG to form a Vector Component Analyzer (VCA), which facilitates enhanced synchronization between the input signal and the output signal analyzed by the PNA-X [Reference Verspecht, Stav, Nielsen and Kusano18].
The purpose of this study is to compare the linearity measurements of the transistors in non-linear region performed with the USMT signals on the PNA-X-based measurement bench with those made with the quadrature amplitude modulation (QAM) signals using an alternative configuration, which uses a vector signal analyzer (VSA). Measurements were made on a  $50\,\omega$ pre-matched transistor. The center frequency is 29 GHz.
Description of measurement benches based on PNA-X and VSA
PNA-X-based measurement bench
A measurement setup using a PNA-X has been developed to characterize the linearity of a device under test (DUT) with a USMT signal, which is well suited for high-power signal measurements and nonlinear device characterization [Reference Barataud, Arnaud, Thibaud, Campovecchio, Nebus and Villotte23, Reference Blockley, Gunyan and Scott24]. The specific model used is a four-port Keysight PNA-X 5245B [Reference Technologies25], which includes the Spectrum Analyzer option that allows for the measurement of all signal frequencies and intermodulation products separately.
Couplers are used to extract both incident and reflected waves at the DUT’s input and output. A Short-Open-Load-Reciprocal (SOLR) on-probes VNA calibration with an additional power calibration is applied to determine the power of each wave in the device reference plane.
The USMT signal is generated using a vector signal generator (VSG) (Rohde & Schwarz SMW200A [Reference Rohde and Schwarz26, Reference Rohde and Schwarz27]). This signal is amplified using a driver amplifier [28]. This versatile device offers the capability to generate a range of waveforms, including QAMs modulation schemes and user-defined signals such as the USMT. Fig. 1 illustrates the PNA-X-based measurement bench developed to characterize the DUT using the USMT signal.
PNA-X-based measurement bench for characterizing devices using USMT (unequally spaced multi-tones) signals.

VSA-based measurement bench
A measurement bench was employed to characterize the DUT for various types of QAM. It is based on a VSG and a VSA. Fig. 2 illustrates the measurement bench developed to characterize the DUT using modulated signals.
VSA-based measurement bench for characterizing devices using QAM modulated signals.

The bench consists of three main components: a vector signal generator (VSG), a driver amplifier, and a VSA. Note that there are two 20 dB attenuators, one at the output of the VSG and one at the input of the VSA. These attenuators ensure that the VSG, the driver amplifier and the VSA operate in the linear region over the entire power range and optimize their dynamic range.
As illustrated in Fig. 2, the VSA is configured with a single receiver, making it suitable for characterizing  $50\,\omega$ matched DUTs. This differs from the on-probe measurement bench, for which a distinct power calibration methodology has been outlined [Reference Silva dos Santos, Reveyrand, Gaillard, Medrel, Nebus, Prigent, Nallatamby and Chang12, Reference Reveyrand29, Reference Reveyrand, Hernandez, Mons and Ngoya30].
It is crucial to highlight that the automatic level control (ALC) circuitry of both the vector signal generator and the analyzer remains unaltered between the power calibration and the measurements of the DUT input and output.
In order to achieve a distortion-free 18 dBm input power with a noise level greater than 50 dBc, it is necessary to employ a broadband Solid-state Power Amplifier (SSPA), which provides 55 dB gain, operating in the 26-40 GHz frequency range.
The Rohde & Schwarz FSW50 VSA [Reference Rohde and Schwarz31, Reference Rohde and Schwarz32] is employed for the demodulation and measurement of output signals. Moreover, the spectrum analyzer option facilitates the measurement of frequencies and the analysis of intermodulation products associated with the USMT signal.
In order to quantify the signal power, a Rohde & Schwarz NRP-Z85 power sensor is used [Reference Rohde and Schwarz33, Reference Schwarz34].
Description of the signals
Unequally spaced multitone (USMT) and quadrature amplitude modulation (QAM) signals
In order to characterize the devices in the measurement bench depicted in Fig. 1, the USMT signals with four, six and eight frequencies, shown in Table 1, were applied to the devices.
The USMT signal frequencies utilized in the PNA-X-based measurement bench.

The USMT signals were generated with a local oscillator at 28.993 GHz. The initial tone is then shifted 10 MHz to the right of the local oscillator frequency. Third-order intermodulation products are observed within the frequency range of 29.000800–29.007300 GHz. Measurements were conducted with a resolution bandwidth of 250 Hz.
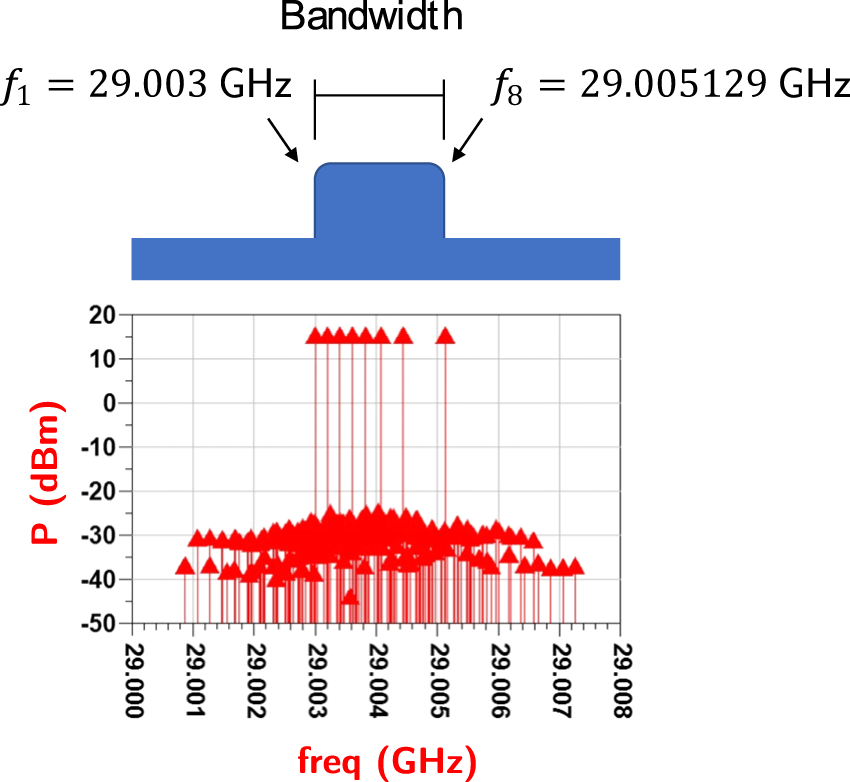
For the VSA-based measurement bench, QAM-modulated signals were applied to the devices. These signals are confined within the same bandwidth as the USMT-8 signal. A raised cosine root filter with a roll-off of 0.35 is employed due to its capacity to mitigate inter-symbol interference. In a homodyne configuration, the local oscillator frequency is 29.004064 GHz, which corresponds to the mid-band frequency. It is important to note that, as Fig. 3 shows, these complex-modulated signals have the same bandwidth as the USMT-8 signal, 2.129 MHz.
Bandwidth of modulated signals compared to USMT-8 signal spectrum.

Statistical properties of the signals
In order to examine the statistical properties of complex modulated signals, it is necessary to consider a number of factors, including the baseband excursion of the signal, the probability density functions (PDF) of the I(t), Q(t), and envelope signals, and the complementary cumulative distribution function (CCDF). This latter factor allows the relationship between the maximum instantaneous power and the average power to be determined PAPR).
Fig. 4 illustrates the baseband signal excursion in IQ plane for the USMT-8 and 1024-QAM signal [Reference Cubukcu35]. For the 1024-QAM signal, the constellation symbols are represented by the red crosses.
Baseband signal excursion in the IQ plane: (a) USMT-8 signal, (b) 1024-QAM signal. The constellation of the 1024-QAM is depicted in red.

As illustrated in Fig. 5(a), the probability density function (PDF) of the I(t) signals with various modulated signals. The signals chosen are 1024-QAM, USMT-4, USMT-6 and USMT-8. A comparison of the PDFs of the USMT signals reveals a high degree of similarity. The signals with six and eight carriers exhibit a Gaussian shape, while the signal with four carriers displays slight variations. As for the signal with 1024-QAM modulation, the PDF exhibits lower values for amplitude exceeding 1.5 above the mean value and less than 1.5 below the mean value.
Statistical properties of the 1024-QAM, USMT-4, USMT-6, and USMT-8 signals: (a) PDF of I and Q signals, (b) CCDF of the I and Q signals.

A thorough examination of the CCDF of the 1024-QAM, USMT-4, USMT-6, and USMT-8 signals reveals a PAPR of approximately 6 dB for the 1024-QAM signal, 6.5 dB for the USMT-4 signal, 7.7 dB for the USMT-6 signal, and 8.5 dB for the USMT-8 signal as shown in Fig. 5(b). The PAPR for other QAM modulations, such as 64-QAM and 256-QAM, are nearly equivalent to that of the 1024-QAM signal. The USMT-8 signal, therefore, among those presented, is the one with the highest PAPR, indicating a higher level of non-linear distortion of the output signal.
A comparison of the properties of each signal allows for an evaluation of whether the signals place the devices in analogous conditions of non-linearity, that is, whether they exhibit a similar shape.
Experimental results
As illustrated in Section “Description of measurement benches based on PNA-X and VSA,” the VSA-based measurement bench is dedicated to  $50\,\omega$ matched device. Consequently, it is not feasible to obtain separate measurements of incident and reflected power. This limitation also extends to spectrum and EVM measurements. Considering these factors, it is essential to ensure that all characterized devices are matched to the system impedance, typically
 $50\,\omega$.
The selected device is a UMS GH-15 pre-matched transistor at  $50\,\omega$ at both the input and output. The total gate width is
 $8 \times 50\,\mu\mathrm{m}$. The transistor is matched to a bias point of 150 mA/mm drain current and a drain voltage of 20 V. The photograph of the transistor is depicted in Fig. 6.
Detail of the UMS GH-15 pre-matched transistor.

The measurements conducted on the PNA-X-based measurement bench (Fig. 1) are presented in Figs. 7(a), 8(a), 7(b), 8(b), and 12. These measurements are indicated by the orange, blue and green lines (USMT-4, USMT-6 and USMT-8).
(a) Power-added efficiency (PAE) and (b) DC drain current ID as a function of the average input power Pin for different digital modulations.

(a) Output power Pout and (b) gain in dB as a function of the average input power Pin for different digital modulations.

The aforementioned measurements are then compared with those carried out on the VSA-based measurement bench, which was presented in detail in Section “Description of measurement benches based on PNA-X and VSA.” In this measurement bench, certain types of modulation have been applied, as the 64-QAM, and 1024-QAM modulations, with a bandwidth equivalent to that of the USMT-8 signal (2.129 MHz) (Fig. 3).
Power performances comparison
Fig. 7(a) illustrates the power added efficiency (PAE) as a function of input power. It can be observed that the difference in PAE value is not particularly pronounced when the various types of digital modulation are applied to the device. The PAEs measured using the QAM modulated signals show a discrepancy of almost two percentage points when compared to the measurements made using USMT signals at  $P_{in} = 15~\mathrm{dBm}$.
The desired drain bias current for characterizing the device under test on the PNA-X-based measurement bench and the VSA-based bench is approximately 150 mA/mm, which corresponds to 60 mA in the device under consideration. Fig. 7(b) depicts the drain current as a function of output power.
It is noteworthy that an increase in output power results in a local decrease in drain current for the output power below  $P_{out} = 18~\mathrm{dBm}$. This phenomenon can be attributed to trap effects observed in the AlGaN/GaN device. The observed decrease in current with increasing power is a significant consequence of the asymmetric nature of the trap capture and emission processes. [Reference Bouslama, Gillet, Chang, Nallatamby, Sommet, Prigent, Queré and Lambert36]. Thereafter, it increases rapidly.
With regard to the average value of output power Fig. 8(a), the discrepancy between the values obtained for the various types of modulation is not particularly noteworthy.
Fig. 8(b) illustrates the comparison of the gain of the transistor characterized with the USMT signals on a PNA-X-based bench with that of the transistors characterized on the VSA-based bench with different QAM-modulated signals. The measurements demonstrate a maximum discrepancy of approximately 0.5 dB, which is negligible.
Noise power ratio (NPR)
The Vector Network Analyzer is employed to measure the spectrum of the USMT signals, whereby the power of each tone and each intermodulation product is assessed separately. This is due to the fact that the latter do not overlap with each other or with the tones. Given the fact that intermodulation tones and signal tones do not share the same frequency grid, the measured C/I metric and EVM obey the same definition of non-correlation between signal and noise [Reference Sombrin11]. One can derive the EVM from this C/I measurement, provided that IM 5 are negligible. The measurements were conducted over a frequency range of 29.0008–29.0073 GHz with a resolution of 250 Hz.
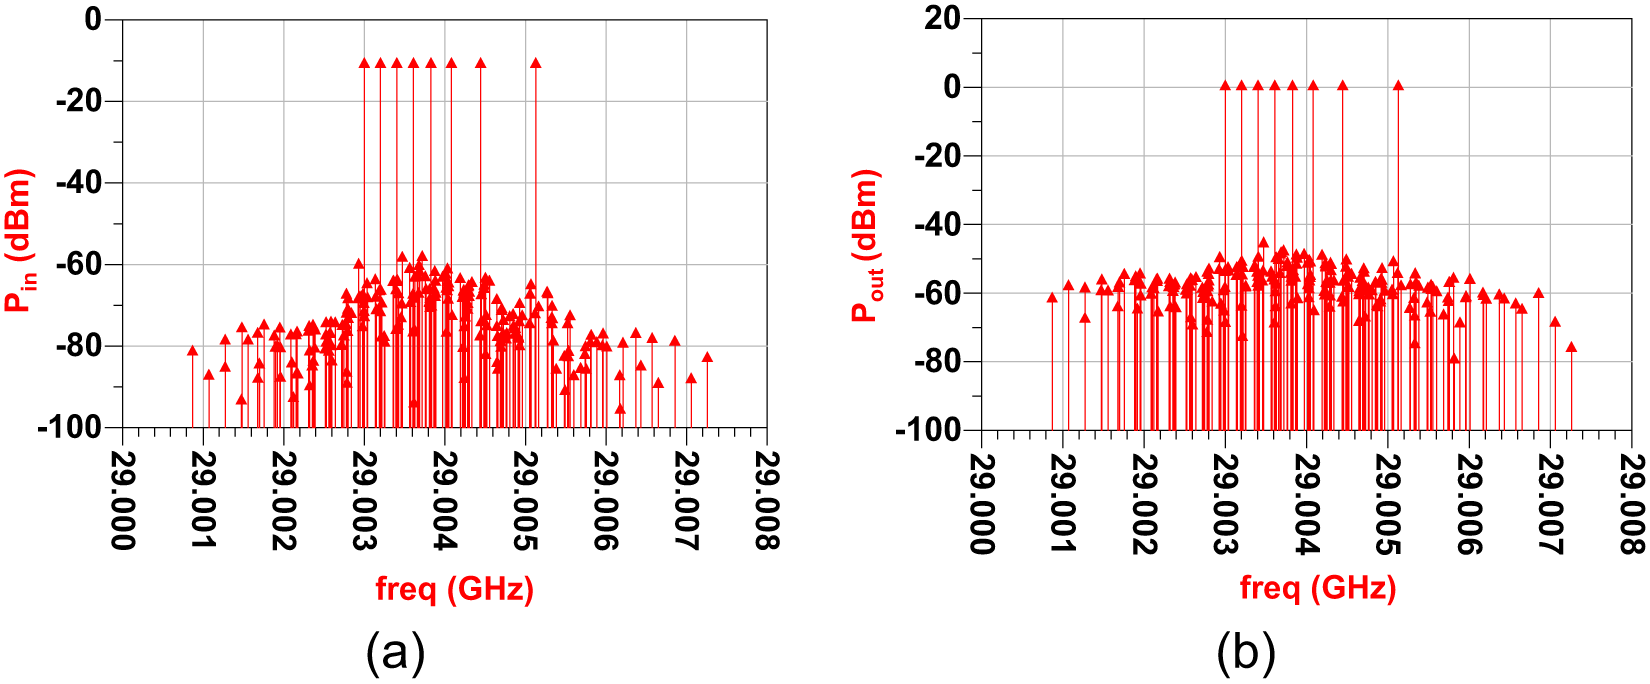
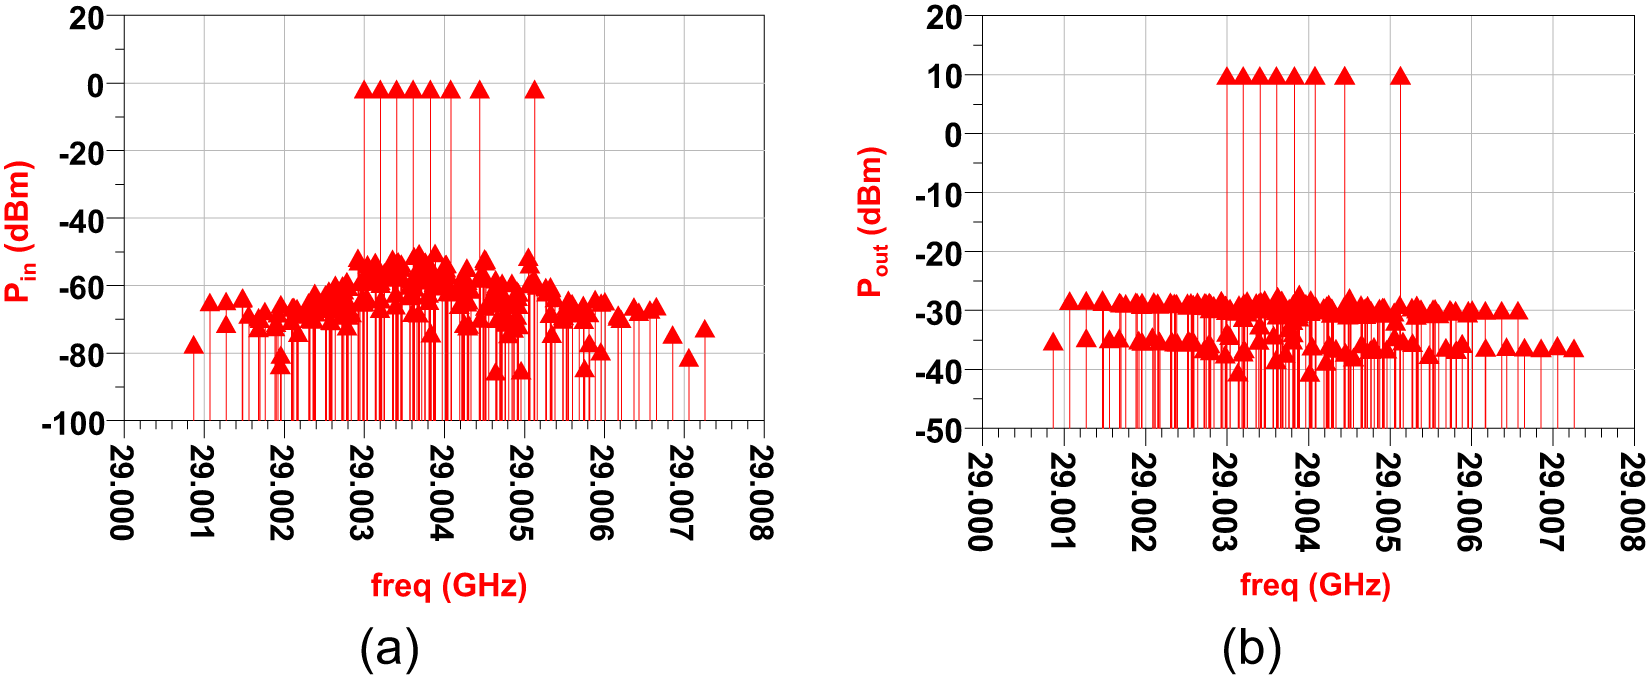
Figs. 9 and 10 illustrate the spectrum of input and output USMT-8 signals for an input power of  $P_{in}=-1~\mathrm{dBm}$ and
 $P_{in}~=~9~\mathrm{dBm}$, respectively.
Spectrum of USMT-8 input and output signals for  $P_{in} = -1~\mathrm{dBm}$ and RBW resolution of 250 Hz: (a) input signal spectrum, (b) output signal spectrum.

Spectrum of USMT-8 input and output signals for  $P_{in} = 9~\mathrm{dBm}$ and RBW resolution of 250 Hz: (a) input signal spectrum, (b) output signal spectrum.

It can be observed that the intermodulation products in the output signal spectrum for  $P_{in} = -1~\mathrm{dBm}$ exhibit a relatively low power compared to the tones, which suggests that the transistor is operating within the linear region. For
 $P_{in} = 9~\mathrm{dBm}$, the intermodulation products of the output signal have a power of approximately −28 dBm in comparison to the power of approximately 11 dBm of the tones, which suggests that the transistor is operating in the non-linear region. The presence of intermodulation products in the input signal can be observed for
 $P_{in} = 9~\mathrm{dBm}$ due to the non-linearity of the VSG generator and driver amplifier. The C/I ratio for the input signal is approximately 60 dB, indicating that the intermodulation products generated by the VSG generator do not impact the behavior of the transistor.
It should be noted that for a resolution of 250 Hz for RBW, the effect of spectral dispersion is negligible, thereby allowing for the measurement of power at each frequency individually. This enables the calculation of the NPR of the output signal, thus determining the ratio between the power of the tones and the power of the intermodulation products. The NPR of the USMT-4, USMT-6 and USMT-8 signals are illustrated in Fig. 11, which also depicts the NPR of the 64-QAM and 1024-QAM signals calculated from the EVM measurements performed in the VSA-based measurement bench, as depicted in Fig. 12.
NPR (noise power ratio) as a function of the average input power Pin for a transistor characterized in a PNA-X-based measurement bench and a VSA-based measurement bench (RBW = 250 Hz).

EVM (Error Vector Magnitude) as a function of the average input power Pin for different digital modulations.

The NPR can be related with the EVM measured using the Equation 1 presented in [Reference Medrel, Reveyrand, Martin, Bouysse, Nébus and Sombrin37], where V is the voltage peak-to-main ratio of the ideal constellation. This value depends on the modulation, as shown in Table 2.
 \begin{equation}
NPR = 40 - 20 \times \log (EVM \times V).
\end{equation}
Peak-to-mean ratios for different QAM modulations

Error vector magnitude (EVM)
At last, EVM was measured using the VSA for 64-QAM and 1024-QAM signals. To accomplish this, the output signal measured by the VSA was decoded, and the symbols received were compared with the ideal symbols for each modulation.
Fig. 12 illustrates the EVM for the various digital modulations and provides a comparative analysis with the EVM of the transistor, as measured on the PNA-X-based measurement bench.
The EVM of the transistors measured on the PNA-X-based bench was calculated from the NPR using the Equation 2 presented in [Reference Sombrin11].
 \begin{equation}
NPR = 40 - 20 \times \log (EVM).
\end{equation}
A comparison between the EVM values of the USMT-8 signals calculated from the NPR measured on the PNA-X using equation 2 and the EVM values obtained through VSA measurements for QAM-modulated signals indicates that the EVM of transistor measured with the USMT-8 is greater than those measured with the QAM-modulated signals.
This discrepancy can be attributed to the greater complexity of the USMT-8 signals in comparison to signals that employ QAM modulation. The PAPR of the USMT-8 signal is higher than that of QAM modulations, which suggests that the output signal is more susceptible to saturation. The EVM measured with the USMT-4 and 1024-QAM signals are quite similar, which is understandable due to the similar PAPR.
The EVM and, consequently, the NPR exhibit significant discrepancies for the USMT and QAM modulation signals when  $P_{out} \lt 14~\mathrm{dBm}$. This discrepancy can be attributed to the precision of the EVM measurement conducted on the VSA-based bench. As the receiver does not measure the input signal, the effects of the generator and bench are included in the measured EVM result [Reference Verspecht, Stav, Nielsen and Kusano18]
Fig. 12 reveals another noteworthy detail: the EVM values for the QAM modulations up to approximately  $P_{out}~=~16~\mathrm{dBm}$ are remarkably similar. This phenomenon can be attributed to the analogous dynamics exhibited by these modulations.
Conclusion
The power measurements for the pre-matched devices yielded satisfactory results, with consistent outcomes observed across tests. Transistor measurements using USMT signals on PNA-X-based benches also demonstrated satisfactory results for EVM measurements.
A comprehensive examination of the PDF and CCDF revealed that, while the USMT-8 signal displays Gaussian characteristics, the QAM modulations do not. Furthermore, the PAPR and CCDF of signals using QAM modulation differ significantly from those obtained when applying a USMT-8 signal having a greater PAPR than the 1024-QAM signal. It has been demonstrated that the PAPR for USMT signals is directly proportional to the logarithm of the number of tones. Therefore, the use of a USMT-4 signal results in a PAPR and CCDF that are more comparable to those observed with a 1024-QAM signal. Indeed, the EVM measured with a 1024-QAM signal is nearly equivalent to the EVM obtained with a USMT-4 signal, yet it differs from that obtained with a USMT-8 signal. Despite this, the measured NPR is different between the USMT-4 and 1024-QAM signals due to the form factor.
One potential approach involves the utilization of OFDM-type signals, which possess a Gaussian PDF and a higher PAPR in comparison to QAM modulation signals. The figures of merit measured using this signal can then be compared with measurements made using a USMT signal with eight or more carriers.
The USMT signals enable the assessment of device nonlinearity without the necessity of demodulation. The non-uniform frequency spacing allows for the evaluation of nonlinear figures of merit through the measurement of the signal spectrum, as there is no overlap between intermodulation products and between the IMs and the frequencies of the signal [Reference Teyssier, Sombrin, Quéré, Laurent and Gizard38]. Its statistical properties make it a viable alternative to the use of a complex modulated signal.
Another perspective is the characterization of non-linearity through the use of mismatched transistors in conjunction with the load-pull method. To this end, the PNA-X would be used as a VSA, with the complex modulated signals and the USMT signals [Reference Gibiino, Angelotti, Santarelli and Traverso20].
Acknowledgements
The authors greatly appreciate and acknowledge the Direction Générale de l’Armement and the CNRS for funding under GREAT Project.
Competing interests
The authors report no conflict of interest.

José Anderson Silva dos Santos received his Engineer Degree in Electrical Engineering in 2020 from the Federal Institute of Education, Science and Technology of Paraiba in João Pessoa, Brazil. He is currently pursuing a PhD in Engineering and Information Sciences at XLIM Laboratory—University of Limoges, France. His research interests encompass RF microelectronics, instrumentation, data processing, digital communications, and microwaves. The thesis aims to characterize and model HEMT transistors using an innovative method for measuring linearity.

Julien Alleman received his Engineer Degree in Electrical Engineering from ENSEEIHT, Toulouse, France in 2022. He is currently pursuing a Ph.D. degree in microwave characterization and artificial intelligence at XLim Laboratory, University of Limoges, France. His current research focuses on developing neural architectures for quickly identifying optimal performance of GaN HEMT transistors.

Tibault Reveyrand received the Ph.D. degree from the University of Limoges, Limoges, France, in 2002. From 2002 to 2004, he was a Post-Doctoral Scientist with CNES (French Space Agency), Toulouse, France. Since 2005, he has been a CNRS Engineer with the XLIM Institute, University of Limoges. From 2013 to 2016, he was a Visiting Researcher with the University of Colorado, Boulder, CO, USA. His current research interests include the characterization and modeling of RF and microwave nonlinear components and devices. Dr. Reveyrand was a Technical Program Review Committee (TPRC) member and has been a Reviewer for many IEEE journals. He was a recipient of the 2002 European GaAs Best Paper Award.

Pierre Medrel received the Ph.D. degree in electronics from the University of Limoges, France, in 2014. From 2014 to 2015, he was a postdoctoral Scientist at the IMS laboratory, Bordeaux, France. He is now an associate professor with the XLIM institute, Limoges. His main field of interest is high-efficiency microwave PA architectures and non-linear devices characterization.

Christophe Chang received the Ph.D. degree, under the Joint Doctoral Degree Program, from the XLIM Laboratory, University of Limoges, Limoges, France, and Thales Airborne Systems, Trappes, France. In 2004, he joined the XLIM Laboratory, University of Limoges, as a Post-Doctoral Researcher. He was involved in the characterization and the nonlinear modeling of the UMS GaInP/GaAs bipolar transistor. In 2005, he joined UMS SAS, where he is currently a Senior Modeling Engineer supporting the development of AsGa-based pHEMT power technologies such as PPH25X and PPH15X (technology support, characterization, and modeling). Since 2007, he has been involved in the support of the development of UMS GaN based technologies (characterization and nonlinear model building). He has participated in the development and the qualification of the 0.25- $\mu \text{m}$ GH25 technology. Since 2014, he has been involved in the 0.15-
 $\mu \text{m}$ GH15 technology development.

Raphaël Sommet received the French aggregation degree in applied physics and the Ph.D. degree from the University of Limoges, Limoges, France, in 1991 and 1996, respectively. Since 1997, he has been a Permanent Researcher at XLIM, Institut de Recherche, Unités Mixtes de Recherche Centre National de la Recherche Scientifique 6172, Faculté des Sciences et Techniques, Université de Limoges, in the C2S2 team “Nonlinear Microwave Circuits and Subsystems.” His research interests concern heterojunction-bipolar-transistor device simulation, 3-D thermal finite element simulation, model order reduction, microwave circuit simulation, and generally the coupling of all physics-based simulation with circuit simulation.

Jean-Michel Nébus received the Ph.D. degree in electronics from the University of Limoges, Limoges, France, in 1988. He is currently a professor with the XLIM Laboratory, CNRS—University of Limoges. His main research interest is nonlinear microwave device characterization and design.

Michel Prigent is currently an emeritus a Professor with the University of Limoges, Limoges, France. He is also involved in characterization and modeling of nonlinear active components (FET, PHEMT, HBT, etc.) with a particular emphasis on low-frequency noise measurement and modeling for use in monolithic microwave integrated circuit (MMIC) CAD. He is also involved in the development of a test bench for linearity characterization of nonlinear components and devices. His current research interests include the design of microwave and millimeter-wave oscillator circuits.

Jean-Christophe Nallatamby received the Ph.D. degree in electronics from the University of Limoges, Limoges, France, in 1992. He is currently a Professor with the University of Limoges. His current research interests include the microwave, low-frequency noise characterization and modeling of high-speed semiconductor devices, characterization of charge-trapping effects in GaN HEMTs, and understanding its physical behavior using TCAD based device simulation.