INTRODUCTION
The search for self-sustaining, low input, diversified and energy efficient agricultural systems is currently of major concern to researchers, farmers and policy makers worldwide (Foley et al. Reference Foley, DeFries, Asner, Barford, Bonan, Carpenter, Chapin, Coe, Daily, Gibbs, Helkowski, Holloway, Howard, Kucharik, Monfreda, Patz, Prentice, Ramankutty and Snyder2005). Maintaining biodiversity is one of the key targets of sustainable agriculture because of its increasingly recognized positive effects on nutrient cycling, pest population regulation and plant growth (Matson et al. Reference Matson, Parton, Power and Swift1997; Mäder et al. Reference Mäder, Fließbach, Dubois, Guntz, Fried and Niggli2002). Biodiversity also offers potentially important sources of food and medicine, and even plays a valuable part in myth and folklore (Altieri Reference Altieri1995).
In north-eastern Thailand, 35% of the landscape is occupied by paddy fields (Tomita et al. Reference Tomita, Nawata, Kono, Inamura, Nagata, Noichana and Sributta2003), which are very constraining environments for the development of soil macrofauna. Soil macrofauna activity is limited during the rainy season by the anoxic conditions caused by flooding and then in the dry season by the very dry weather. Paddy fields are heterogeneous ecosystems owing to the presence of many small plots separated by small elevated embankments made of soil, called ‘dykes’ (with an average height of 40cm), which are generally covered by many types of grasses. Another striking feature of these ecosystems is the presence of mounds created by termites, on which various kinds of trees, shrubs and sometimes grasses grow all year round. These two sources of heterogeneity may be important for soil biodiversity preservation, providing refuges for soil macrofauna during the rainy season while paddy fields are flooded, and offering the shade and humidity necessary for their development and survival during the dry season.
As ecosystem engineers (sensu Jones et al. Reference Jones, Lawton and Shachak1994, Reference Jones, Lawton and Shachak1997; Lavelle Reference Lavelle1997; Jouquet et al. Reference Jouquet, Dauber, Lagerlof, Lavelle and Lepage2006, Reference Jouquet, Mathieu, Choosai, Barot and Munoz2007), termites play a prominent role in maintaining biodiversity. These soil-dwelling organisms modify soil properties by displacing soil organic and mineral compounds from one site to another and by producing biogenic structures, namely organo-mineral aggregates (faeces, mounds, aggregates and gallery walls) and macropores (galleries, chambers), with specific physical, chemical and biological properties (de Bruyn & Conacher Reference de Bruyn and Conacher1990; Black & Okwakol Reference Black and Okwakol1997; Holt & Lepage Reference Holt, Lepage, Abe, Bignell and Higashi2000; Jouquet et al. Reference Jouquet, Dauber, Lagerlof, Lavelle and Lepage2006). Soil ecologists usually consider these structures as activity hotspots and high resource patches, sometimes referred to as fertility ‘islands’ (Smith & Yeaton Reference Smith and Yeaton1998; Konaté et al. Reference Konaté, Le Roux, Tessier and Lepage1999; Jouquet et al. Reference Jouquet, Dauber, Lagerlof, Lavelle and Lepage2006, Reference Jouquet, Mathieu, Choosai, Barot and Munoz2007), which create spatial variability in soil properties at the ecosystem scale (Schuurman Reference Schuurman2006; Obi & Ogunkunle Reference Obi and Ogunkunle2009).
In this study, we assessed the role of dykes and termite mounds in sheltering soil macrofauna biodiversity in paddy fields. We compared biodiversity in rice plots to that in dykes and termite mounds in fields managed following the two most common management practices used for rice cropping in this region: direct seeding and transplanting. We also examined whether patterns of biodiversity distribution were similar during the dry and rainy seasons.
METHODS
Study sites
The study was conducted in paddy fields (rice crops) in north-eastern Thailand (Khon Kaen province, Ban Fang amphur, Baan Daeng village, 102.62°E and 16.38°N). This area is largely dominated by steep hills with slopes of up to 200 m altitude. In the past, the area was forested and rice growing started 25–35 years ago. The soils are typical Natraqualf (Soil Survey Division Staff 1998) from the Kula Ronghai Thailand soil series. These paddy soils are very compact with a bulk density of 1.78 and 2.01 mg cm−3, in the Ap and Bt horizon, respectively. The pH is slightly acidic (≈ 6) in the topsoil and neutral in the subsoil. The clay fraction is mostly kaolinitic with some smectites (Saejiew et al. Reference Saejiew, Grunberger, Arunin, Favre, Tessier and Boivin2004).
The area has a humid tropical climate with distinct rainy and dry seasons. Annual rainfall is c. 1000 mm, with 90% of rainfall occurring between May and October. In our sample year (2007), the annual rainfall was c. 1300 mm. During the rainy season (June–November) the temperature is 25–33 °C, with 82% mean humidity. During the dry season temperature is 16–30 °C (mean humidity 70%).
In this region, rice plots are managed using two dominant practices: direct seeding (hereafter called ‘DS plots’) and transplanting (hereafter called ‘TP plots’). In TP plots, seedlings are transplanted from a nursery to the field, whereas in DS plots, rice seeds are sown manually in the field. In both cases, plots are small (0.1–0.2 ha) and are separated by approximately 40 cm high and 40 cm wide soil embankments, called ‘dykes’. During the rainy season, many kinds of shrubs and grasses grow naturally on these dykes and also in the plots. Almost all the paddy fields are flooded (for a duration of 1–4 months), and the water is retained by the dykes. At the beginning of the season, the water is usually 30 cm deep and then evaporates, becoming shallower towards the end of the rainy season. After rice harvesting, the field is left fallow during the dry season, and soils become very dry, except in mounds and dykes that are still covered by vegetation.
Termite mounds are widespread in the study region, with approximately 2 mounds ha−1, and occur only at the junction of dykes, at the corner of plots. They can reach 2 m in height and 4 m wide and are always covered by many types of trees, such as Siamese rough bushes Streblue asper and the neem tree Azadirachta indica Adrien de Jussieu var. siamensis.
Sampling design
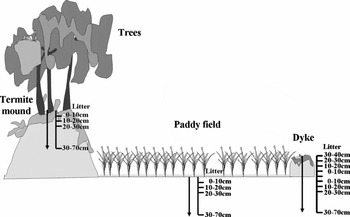
The soil macrofauna was sampled in five types of locations (Fig. 1): (1) termite mounds; (2) inside the rice TP plots; (3) inside the rice DS plots; (4) in the dykes between two TP plots (hereafter called ‘TP dykes’); and (5) in the dykes between two DS plots (hereafter called ‘DS dykes’). We sampled soils in both the rainy and dry seasons (August 2007 and February 2008) with n = 6 replicates for each location. Replicates were randomly selected from the landscape and were at least 150 m apart. During the rainy season, sampling was done when water reached 5 cm depth in average. Each replicate consisted of the addition of five modified tropical soil biology and fertility (TSBF) samples (Anderson & Ingram Reference Anderson and Ingram1993) randomly located within each location type (composite samples).
Soil macrofauna was sampled to a depth of 70 cm in dykes, paddy fields and termite mounds, and to a height of 40 cm in dykes (n = 6 replicates of five modified tropical soil biology and fertility samples at each location in each season).

Soil macrofauna sampling
Following the standard TSBF method (Anderson & Ingram Reference Anderson and Ingram1993), we manually removed soil sample blocks 25 cm wide × 25 cm wide × 10 cm depth. We modified this method by increasing the depth of the blocks to 70 cm, which gave us five successive strata: litter, 0–10 cm, 10–20 cm, 20–30 cm and 30–70 cm below ground. We included an extra four layers when sampling the dykes: 0–10 cm, 10–20 cm, 20–30 cm and 30–40 cm above ground (Fig. 1). Soil macro-invertebrates (>2 mm in size) were removed from each layer of soil by hand-sorting. Individuals were preserved in 70% alcohol, except for earthworms, which were preserved in 4% formalin solution for two days and then transferred back to 70% alcohol. Soil macro-invertebrates were counted and classified into taxonomic groups and identified at the morpho-species level (Oliver & Beattie Reference Oliver and Beattie1993; Oliver & Beattie Reference Oliver and Beattie1996). Those species which play a significant role as rice pest predators or which are occasionally eaten by farmers were also identified at the species level.
Data analysis
The macrofauna data were log(x + 1) transformed when necessary and analyses of variance (ANOVA) were performed. Means were compared by Tukey tests. Differences in species compositions and community structure were assessed by principal component analysis (PCA) on the abundance of each group and by comparing the species or broad taxonomic groups in common between the locations. Species richness was defined as the total number of morpho-species. The diversity was described by species richness (R), the Shannon (H’) index and Shannon evenness (H’/ln(R)). Abundance was defined as the number of individuals per m2. Species specific to particular locations were identified using the indicator value (Indval) method (Dufrene & Legendre Reference Dufrene and Legendre1997), which combines the frequency and abundance of the species. To use this method, locations were classified according to the PCA outcomes. All statistical analyses were performed with R (R Development Core Team 2008), in particular using the Coan package for community analyses (URL http://www.jerome.mathieu.freesurf.fr/coan_engl.htm).
RESULTS
Biodiversity
A total of 118 macrofauna morpho-species was found, distributed among 41 families and 14 orders. Eight taxonomic groups were commonly found: earthworms, termites, ants, spiders, coleopterans, orthopterans, chilopods and diplopods.
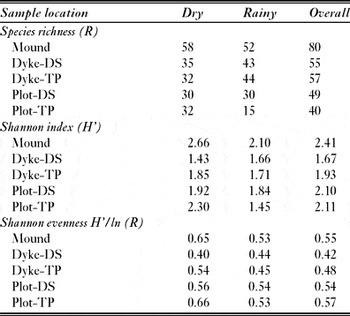
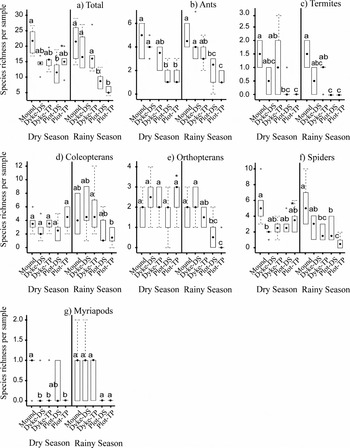
Biodiversity was highest in termite mounds regardless of the parameter considered, whereas it was always lowest in plots. The total species richness was nearly twice as high in termite mounds (80 species) than in the plots (40 and 49 in TP and DS, respectively) (Table 1). Total species richness was intermediate in the dykes (57 and 55 in TP and DS, respectively). Average species richness followed the same trend, with 22 species in termite mounds in the dry and rainy seasons compared with 15 in other locations during the dry season, and then 15 in dykes and six in plots in the rainy season (Fig. 2). This trend was observed for most groups, but especially for ants, termites and spiders. However, orthopteran distribution differed, with equal species richness in each location in the dry season and highest species richness in DS dykes. Myriapod species richness did not vary between location and season. In summary, during the rainy season, species richness increased in dykes while it decreased inside plots. Conversely, species richness remained the same in termite mounds in both seasons.
Diversity indices (species richness R, Shannon index H' and Shannon evenness H'/ln (R)) of the soil macrofauna for each location and season (DS = direct seeding, TP = transplanting).

Box and whisker plots of average species richness of the different soil macrofauna groups per location and season. (a) Total soil macrofauna, (b) ants, (c) termites, (d) coleopterans, (e) orthopterans, (f) spiders and (g) myrapods. DS = direct seeding technique, TP = transplanting technique. Histograms with the same letters are not significantly different at p = 0.05, n = 6.

The diversity, as measured by the Shannon index, varied with location and season (Table 1). It was maximal in the mounds in both seasons (2.66 and 2.10 for dry and rainy seasons, respectively) and minimum in DS dykes (1.43) in the dry season and in TP plots (1.45) in the rainy season. Overall, diversity was lower during the rainy season than during the dry season, except in DS dykes, where conversely diversity was higher during the rainy season.
The diversity, as measured by the Shannon evenness, varied with location and season (Table 1). It was maximal in TP plots (0.66) in the dry season and in DS plots (0.54) in the rainy season, while it was minimal in DS dykes in both seasons (0.40 and 0.44 for dry and rainy seasons, respectively). Overall, diversity was lower during the rainy season than during the dry season, except in DS dykes.
Density
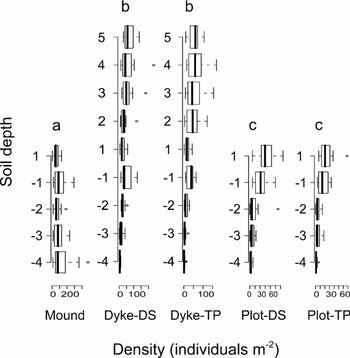
The overall soil faunal density showed the same pattern as species richness. It was higher in termite mounds than in other locations, especially during the rainy season (Fig. 3). The total density increased in dykes during the rainy season but it did not change inside the plots. The density of termites, coleopterans, spiders and myriapods followed the same pattern as total density, with higher density in the rainy season and in termite mounds. Conversely, ants, earthworms and orthopterans were found at a higher density in dykes than in mounds, especially during the rainy season. Overall, the density of soil macrofauna decreased with increasing soil depth, except in termite mounds where density increased with depth (Fig. 4).
Box and whisker plots of mean density of the different soil macrofauna groups per location and season. (a) Total soil macrofauna, (b) ants, (c) termites, (d) earthworms, (e) coleopterans, (f) orthopterans, (g) spiders and (h) myrapods. DS = direct seeding technique, TP = transplanting technique. Histograms with the same letters are not significantly different at p = 0.05, n = 6.

Box and whisker plots of mean density of the soil macrofauna per location and depth. DS = direct seeding technique, TP = transplanting technique, L = litter, −1 to −4 = 0–10 cm, 10–20 cm, 20–30 cm and 30–70 cm below ground, 1 to 4 = 0–10 cm, 10–20 cm, 20–30 cm and 30–40 cm above ground. Histograms with the same letters are not significantly different at p = 0.05, n = 6.

Community structure
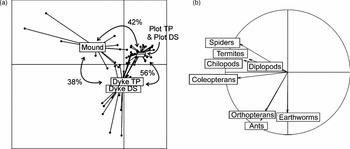
The PCA clearly isolated three clusters: termite mounds, dykes and plots (Fig. 5). Samples were not grouped according to land use (DS or TP) suggesting that it did not have a significant effect on community structure. The correlation circle indicated that a high density of termites, spiders, chilopods and diplopods characterized the termite mound cluster, whereas orthopterans, earthworms and ants were the main characteristic features of dykes (Fig. 5b). Our previous results concerning species density also identified these groups of fauna due to their similar habitat preferences. Paddy plots were characterized by a low density of all groups.
Principal component analysis performed on the density of macrofauna groups. (a) Projection of the samples on axes 1 and 2 of the PCA. Arrows indicate the percentage of species in common between the three clusters. (b) Correlation circle between the variables. DS = direct seeding, TP = transplanting technique.

The three clusters determined by the PCA showed little resemblance in species composition. Dykes and plots were the most similar, with 56% species in common, mounds and dykes were the most different, with only 38% of species in common. Forty-two per cent of the species were found both in mounds and plots (Fig. 5a).
Indicator species
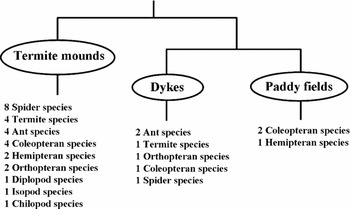
Among the 118 morpho-species observed in the different locations, 36 (30.5%) were significant indicators of a PCA cluster (Fig. 6) according to their Indval values: 27 mound specialist species were found including four species of soil and litter feeder termites (Odontotermes formosanus, Hospitalitermes ataramensis, Angulitermes sp. and Microcerotermes sp.), four species of ants (omnivores and predators), eight species of spiders (predators), four coleopteran species (two omnivorous and two predators), two species of hemipterans (omnivorous), two orthopterans (Blattellidae: detritivore and Phasmatidae: omnivorous), and one species of chilopod (predator). Mounds were the only habitat of specialist detritivores such as millipedes (one species) and isopod (one species). Six specialist species inhabited dykes: two ant species (omnivorous and predators), one species of spider (predator), one soil feeder termite species (Pericapritermes sp.), one orthopteran species (Gryllotalpidae, grass feeder) and one species of coleopteran (Scarabaeidae, omnivorous). Rice plots provided a habitat for only three specialist species: two coleopterans (Carabidae, predators) and one species of hemipteran (omnivorous).
The number of specialist species (according to Indval scores) in the clusters identified by principal component analysis (see Fig. 5).

DISCUSSION
Land management practices and biodiversity in paddy fields
Both direct seeding and transplanting practices are used in north-eastern Thailand. These practices differ in several aspects which generate different habitat conditions that might affect the soil macrofauna. Firstly, transplanting practices require flooding while direct seeding can be done without it (Miyagawa et al. Reference Miyagawa, Konchan and Kono1998). The shorter flooding period in direct seeding fields (almost a month less) can be assumed, at first glance, to be more favourable for soil macrofauna. Secondly, although these two systems do not show significant differences in soil properties such as soil organic matter content and pH (Clermont-Dauphin et al. Reference Clermont-Dauphin, Hartmann, Maeght, Beriaux and Sagnansupyakorn2005) and weed abundance (Tomita et al. Reference Tomita, Nawata, Kono, Inamura, Nagata, Noichana and Sributta2003), weed species-richness is higher in direct seeding fields than in transplanted ones. Hence, food diversity is higher in direct seeding plots. Therefore direct seeding may provide a more favourable environment for soil macrofauna because of reduced flooding time and higher food diversity. However, we found no significant difference in soil macrofauna density and species richness between the two systems. Because of the low density and diversity in rice fields regardless of planting regimes, it appears that soil macrofauna has difficulty surviving in these environments. This scarcity and low level of diversity may be explained by the harshness of rice crops, which are flooded for 1–4 months of the year and severely dry for 5–7 months, as well as having low levels of food resources (low litter and soil organic matter contents). Ploughing before rice planting and after rice harvesting, which was reported to severely affect soil macrofauna (Lavelle & Pashanasi Reference Lavelle and Pashanasi1989; Wardle et al. Reference Wardle, Yeates and Watson1993), may have also contributed to lowering biodiversity levels in paddy fields.
The soil macrofauna was sampled in August, after flooding the paddy fields in June and July and before soil was expected to become totally dry in appearance. Surprisingly, spiders and ants were found on rice leaves and soil surfaces in areas that were partially covered by water, demonstrating that some soil macrofauna groups can easily colonize surrounding areas from the dykes. In addition, sampling showed that soil macrofauna can survive when the soil is flooded. Even when the paddy field was flooded on the surface and the soil moisture content was high, it was not saturated at depths of 0–30 cm. We therefore believe that the soil surface is acting as a crust, lowering water diffusion deep into the soil and impeding oxygen outflow, thus allowing soil macrofauna to survive.
Termite mounds and dykes are biodiversity hotspots
Soil macrofauna communities were strongly influenced by the season and the local environmental and habitat conditions in paddy fields. The density and species richness of soil macrofauna were higher in the rainy than in the dry season (except in the case of the plots). Since biodiversity was higher in termite mounds (greater species-richness and specificity), intermediate in dykes and the lowest in the rice plots, this ecosystem can be considered as a mosaic with two discrete hotspots: mounds and dykes surrounded by a matrix of rice plots with low soil macrofauna species-richness.
Five different termite species were found in the termite mounds (Odontotermes formosanus, Hospitalitermes ataramensis, Macrotermes gilvus, Angulitermes sp. and Microcerotermes sp.). M. gilvus was originally suspected to have constructed the termite mounds (Sawaeng Ruaysoongnern, personal observation 1988). However, M. gilvus was only found in two mounds, whereas O. formosanus was found in all mounds and was the most dominant termite species in every case. We therefore hypothesize that the termite mounds were generated by the activities of different termite species, and that O. formosanus became the main species involved in mound edification and dynamics after Macrotermes sp. colonies died. A similar mechanism of termite mound dynamics was observed in African savannah ecosystems (Konaté 1998).
Termite mounds create islands of fertility for grasses, trees and animals (Holt & Lepage Reference Holt, Lepage, Abe, Bignell and Higashi2000; Fleming & Loveridge Reference Fleming and Loveridge2003; Jouquet et al. Reference Jouquet, Boulain, Gignoux and Lepage2004, Reference Jouquet, Dauber, Lagerlof, Lavelle and Lepage2006; Diehl et al. Reference Diehl, Junqueira and Berti-Filho2005; Mwabvu Reference Mwabvu2005; Scott et al. Reference Scott, Brown, Mahood, Denton, Silburn and Rakotondraparany2006). Hence, increased biodiversity within termite mounds might be explained by the better living-environment for soil and litter-inhabiting macrofauna, namely higher substrate levels (litter and soil organic matter), better protection from direct sunshine and more favourable soil moisture conditions. Shadow and litter from trees may be especially important for litter-inhabiting macrofauna (such as spiders and orthopterans) which are prone to desiccation (Hofer et al. Reference Hofer, Hanagarth, Garcia, Martius, Franklin, Rombke and Beck2001) and which could not survive in the surrounding dry environment. During the rainy season, soil macrofauna that need to live in flood-free systems can survive in the mounds and dykes. Concurrently, during the dry season mounds provide an environment with sufficient moisture content for soil macrofauna to survive. Although we found that density increased with depth in termite mounds, our samples were only taken down to a depth of 70 cm, which means that the actual biodiversity within mounds could be significantly higher than that found in our study. Therefore our sampling procedure probably underestimated the positive effect of termite mounds on soil macrofauna biodiversity.
Biodiversity and ecosystem services in paddy fields
This study stresses the importance of ecosystem engineering activity (such as human activity due to dyke construction and natural activity by termites building the mounds) in the maintenance of spatial heterogeneity in paddy fields and with implication for soil macrofauna biodiversity conservation. Few studies have examined the impact of soil macrofauna in the functioning of partially flooded ecosystems such as paddy fields, although ecosystem functions and services may be influenced by its biodiversity. Jouquet et al. (Reference Jouquet, Hartmann, Choosai, Hanboonsong, Brunet and Montoroi2008) previously reported the possible effect of ants and earthworms on soil particle size and soil organic matter dynamics in paddy fields in the same study area. In Indonesia, Widyastuti (Reference Widyastuti, Vlek, Denich, Martius and de Giesen2002) also demonstrated that soil macrofauna plays an important role in promoting litter decomposition and mineral nitrogen dynamics. Soil biodiversity might also be important regarding the role of soil macrofauna as pests or predators of rice pests. Ant and spider densities were found to be higher on/in mounds and dykes. These two patches therefore constitute refuges where they can survive and from which they could colonize paddy fields. Ants and spiders are efficient predators and can act as agents in the control of rice pests (Settle et al. Reference Settle, Ariawan, Astuti, Cahyana, Hakim, Hindayana and Lestari1996). Although we did not find any soil macrofauna pests in our study, termite mounds and dykes provide a haven for soil macrofauna predators to shelter and could thus constitute a sustainable resource for controlling rice pests. Finally, insects are consumed as food by people in many parts of the world, including north-east Thailand (Borror et al. Reference Borror, Triplehorn and Johnson1992), and a survey revealed that some of the soil macrofauna species found in our study were eaten by local inhabitants (Chutinan Choosai, unpublished data 2008). Amongst the sampled soil macrofauna species, two species are occasionally consumed: one ant species (Formicidae: Oecophylla smaragdina), which was only found in the mounds, and one orthopteran species (Gryllotalpa africana), mainly found in the dykes during the rainy season (19.7 individuals m−2 in the dykes, 2.1 individuals m−2 in the paddy field plots). Conserving dykes and termite mounds could therefore constitute a significant dietary supplement for local farmers.
In conclusion, paddy fields in north-eastern Thailand are adverse environments for soil macrofauna. In these agricultural landscapes, mounds and dykes can be considered to be local biodiversity hotspots, providing shelter for many soil macrofauna species. Since these species are involved in ecosystem functions and services, their conservation should be integrated into sustainable rice management systems.
ACKNOWLEDGEMENTS
We would like to thank Dr Tasanee Jamjanya for constructive discussions and Samnuan Kaewkongpan and Prapun Muangsong for their help in the field. This research was supported by a grant from the governments of Thailand and France under the Thai-Franco Cooperation Program and Khon Kaen University, Thailand, and by the French Institute IRD (unit research UMR137-BIOSOL).