Introduction
Citizens often use their participatory rights to influence governments and private subjects’ decisions without necessarily passing through institutional channels. So-called ‘protest politics’, or ‘unconventional’ forms of political participation, are slowly replacing more ‘conventional’ forms (Norris, Reference Norris2002). In fact, it is argued that contemporary democracies are ‘social movement societies’ in which protest activities are common and participants are not easily identifiable as they are ordinary citizens (Meyer and Tarrow, Reference Meyer and Tarrow1998). But how do we measure political protest? In this article, we conceptualize political protest, build an index to measure it, and test its cross-national equivalence.
In the social sciences, it is well known that concepts have to ‘travel’ in order to compare phenomena (Sartori, Reference Sartori1970). Gerring (Reference Gerring1999: 366) argues that ‘concept formation is a highly contextual process’, as is measurement, given that the two are intimately connected (Adcock and Collier, Reference Adcock and Collier2001). The aim of this article is to answer another question: is the measure of political protest equivalent across countries? It is argued that the issue of measurement equivalence remains unaddressed in political science (Jackman, Reference Jackman2008; Ariely and Davidov, Reference Ariely and Davidov2012; Stegmuller, Reference Stegmuller2011),Footnote 1 in contrast with other social science disciplines, such as psychology (Van de Vijver and Tanzer, Reference Van de Vijver and Tanzer2004). The test of measurement equivalence represents one of the most important phases of the research process because it guarantees that the analysis of a phenomenon is reliable (Jacoby, Reference Jacoby1999). If we want to compare levels of political protest across different contexts, assessing measurement equivalence is a necessary step to provide unbiased estimates.
It is argued that the concept of political protest has one underlying dimension. A measurement model is tested to build a scale to determine individual and country scores of political protest. The ‘political protest’ scale from the European Values Study (EVS, 2011), first employed in the ‘political action’ study (Barnes and Kaase, Reference Barnes and Kaase1979) and showing that the concept of political protest can be measured using five indicators (signing a petition, joining a boycott, attending lawful/peaceful demonstrations, joining unofficial strikes, occupying buildings or factories), is used for this purpose. This conceptualization thus follows the work of Barnes and Kaase (Reference Barnes and Kaase1979), who create a distinction between ‘conventional’ and ‘unconventional’ participation, later known as ‘protest politics’ or ‘non-violent protest behavior’, and that has been followed by, among others (Inglehart, Reference Inglehart1990, Reference Inglehart1997; Parry et al., Reference Parry, Moyser and Day1992; Norris, Reference Norris2002; Benson and Rochon, Reference Benson and Rochon2004; Inglehart and Welzel, Reference Inglehart and Welzel2005; Dalton, Reference Dalton2008; Dalton et al., Reference Dalton, Van Sickle and Weldon2010; Welzel and Deutsch, Reference Welzel and Deutsch2012).
Mokken Scale Analysis (MSA) is used to assess the cross-country equivalence of the political protest scale (Mokken, Reference Mokken1971; Sijtsma et al., Reference Sijtsma, Debets and Molenaar1990, Reference Sijtsma, Meijer and Van der Ark2011; Sijtsma, Reference Sijtsma1998; Sijtsma and Molenaar, Reference Sijtsma and Molenaar2002; Van Schuur, Reference Van Schuur2003), a nonparametric scaling method within the family of Item Response Theory models. It has been proven to work better than Confirmatory Factor Analysis (CFA; Bollen, Reference Bollen1989) when dealing with dichotomous and polytomous items forming ordinal scales. To ensure the maximum degree of comparability, a set of Western European countries is used, as they are all established democracies with similar pasts and economic development levels.
The article develops as follows. First, I define the concept of political protest. Second, an outline of the problem of measurement equivalence in comparative research is offered. Third, the methodological strategy and data used are illustrated, and then the measurement equivalence analysis is presented. The last section concludes.
The concept and the measure of political protest
Until the late 1970s, political protest was excluded from the broader concept of political participation. In fact, intense forms of political behavior were considered irrational and disruptive (Rucht, Reference Rucht2007). No form of active political involvement that failed to focus on political personnel selection was considered political participation (Milbrath, Reference Milbrath1965; Verba and Nie, Reference Verba and Nie1972). The concept of political participation was based on the idea that one of its necessary components was the authoritative allocation of values (Teorell et al., Reference Teorell, Torcal and Montero2007). Despite its limits, this conceptualization had been very influential, especially in moments of great social change.
It is undoubtedly true that the concept of political participation is usually linked to the act of voting, but it should not be limited to just this. Consequently, the conceptualization of political participation was enlarged to capture innovative forms of political action. The ground-breaking ‘political action’ study (Barnes and Kaase, Reference Barnes and Kaase1979) introduced a very important distinction in the field since ‘empirical research [had] not kept in pace the growing theoretical emphasis upon non institutionalized, non electoral political action, an emphasis that reflects the prominence of protest in the mass politics of Western democracies during the 1960s’ (Kaase and Marsh, Reference Kaase and Marsh1979a: 27). On one hand is ‘conventional’ political participation, concerning all acts that form part of the constitutional process of interest aggregation and representation, mediated by political institutions, and which define the relationship between political authorities and citizens within the political arena. On the other is ‘unconventional’ political participation, or ‘political protest’, which is non-institutionalized direct political action, not necessarily aimed at disrupting or threatening the stability of liberal democracies. In fact, ‘direct political action generally, and political protest in particular, do not necessarily assume anti-regime protests but may form one element of an expanded repertory of political action’ (Kaase and Marsh, Reference Kaase and Marsh1979a: 27). Nor are they seen as having an ‘anti-system-directed orientation’ (Kaase and Marsh, Reference Kaase and Marsh1979b: 157). As a consequence, political protest is considered ‘a means of political redress, namely […] the use of tactics as petitions, demonstrations, boycotts, rent or tax strikes, unofficial industrial strikes, occupations of buildings, blocking of traffic, damage to property, and personal violence’ (Marsh and Kaase, Reference Marsh and Kaase1979: 59).
All relevant studies following Barnes and Kaase's seminal book (see Dalton, Reference Dalton1988, Reference Dalton2008; Jennings et al., Reference Jennings, Van Deth, Barnes, Fuchs, Heunks, Inglehart, Kaase, Klingemann and Thomassen1989; Parry et al., Reference Parry, Moyser and Day1992; Inglehart, Reference Inglehart1997; Norris, Reference Norris2002; Inglehart and Welzel, Reference Inglehart and Welzel2005; Van Deth et al., Reference Van Deth, Montero and Westholm2007; Dalton et al., Reference Dalton, Van Sickle and Weldon2010; Welzel and Deutsch, Reference Welzel and Deutsch2012) incorporated these forms in the repertoire of political participation, grasping changes that otherwise would not have been perceived: ‘[t]he analysis of protest politics shows that many of these forms of activity, such as petitions, demonstrations, and consumer boycotts, are fairly pervasive and have become increasingly popular during recent decades. Protest politics is on the rise as a channel of political expression and mobilization’ (Norris, Reference Norris2002: 221).
The distinction between conventional and unconventional political participation introduced a key element: the object of political action. Conventional participation aims at the political arena, public institutions, while political protest can also target other objects that are not necessarily part of the political system. As Teorell et al. (Reference Teorell, Torcal and Montero2007: 336) argue that in Western democracies ‘the authoritative allocations of values is not the sole responsible of state actors of the public sector. As a result, […] non-governmental institutions may be targeted by citizen attempts to influence political outcomes’. Unconventional actions are extra-representational and can be undertaken to influence both the public and private sectors. Demonstrations are a clear example. Very often, they are a means of opposition to governmental decisions, such as cuts to the welfare state sector, but they are also oriented to influence public opinion or private firms. We may note in this vein the ‘anti-globalization movement’ or ‘global justice movement’ (Della Porta et al., Reference Della Porta, Andretta, Mosca and Reiter2006; Della Porta, Reference Della Porta2007), critical of the neoliberal economic turn, that often concluded their gatherings with large demonstrations. In fact, as Della Porta and Diani (Reference Della Porta and Diani2006: 165) argue: ‘heterogeneous and initially loosely connected groups had mobilized together, mainly against international organizations, using different strategies: from lobbying to marches, from boycotts to petitions, from strikes to netstrikes […] demonstrators from many countries challenged the legitimacy of the decisions of some international governmental organizations and sought to hinder their plans. They did not do so through normal diplomatic channels or through elections. Rather, they sought to influence public opinion in various ways’.
Finally, the actions forming its repertoire can be considered hierarchically ordered (Van Deth, Reference Van Deth1986; Kaase, Reference Kaase1989): ‘[t]he first threshold indicates the transition from conventional to unconventional politics. Signing petitions and participating in lawful demonstrations are unorthodox political activities but still within the bounds of accepted democratic norms. The second threshold represents the shift to direct action techniques, such as boycotts. A third level of political activities involves illegal, but nonviolent, acts. Unofficial strikes or a peaceful occupation of a building typify this step. Finally, a fourth threshold includes violent activities such as personal injury or physical damage’ (Dalton, Reference Dalton1988: 65).
For the purposes of this work, ‘political protest’ or ‘unconventional participation’ is considered a direct form of political participation taking place without the intermediation of institutional actors. Protest may arise from social organizations that vary in terms of their structure, membership, scope, resources, and capacity for mobilization (Della Porta and Diani, Reference Della Porta and Diani2006). Political actions must be free and organized by civil society, not by governmental institutions looking for popular support. As a form of direct participation, protest requires an extended effort and a certain degree of conflict. Potentially, it produces high pressure on the contested actors, although it may not produce the expected outcome. Protest may also presuppose collective action (Tilly and Tarrow, Reference Tilly and Tarrow2006), although it is not necessary. Unconventional political actions are not professional activities and must be voluntary. In order to be defined ‘political’, an unconventional action must have a target. The action must aim to influence something, either governmental institutions or actors belonging to the private sector (Teorell et al., Reference Teorell, Torcal and Montero2007).
A scale that has been used in the literature to measure the concept of political protest is that proposed by Barnes and Kaase (Reference Barnes and Kaase1979), but it has never been proven to be valid across a large number of countries. In fact, several comparative studies using this scale apply it to very different contexts that not only have different cultures, but also different historical legacies, paths of democratization, and, consequently, modes of political engagement.
These studies provide some evidence of the scale's internal reliability but may be insufficient to ensure measurement equivalence. For instance, in ‘Democratic Phoenix’ Norris (Reference Norris2002: 195–196) elaborates a scale of ‘protest activism’ using the five items included in the World Value Survey, arguing that these form a distinct dimension of engagement, different from other forms of political and social involvement, such as voting.
A principal component factor analysis supports this argument. The results are clear but the analysis is run on the pooled sample without testing cross-country equivalence. Benson and Rochon (Reference Benson and Rochon2004: 441–442) use Guttman scaling to assess the reliability of the political protest scale, but no evidence of cross-country equivalence is given. Dalton (Reference Dalton2004: 177), analyzing the correlation between political trust and the political protest scale, says the latter is a count of five political activities. Similarly, Dalton et al. (Reference Dalton, Van Sickle and Weldon2010: 61) use the same scale, providing a principal component analysis and emphasizing the fact that just one factor with an eigenvalue greater than one emerges. The following sections illustrate potential problems arising from the lack of measurement equivalence in comparative research, and delineate an empirical strategy to assess it.
The problem of cross-country measurement equivalence
In comparative studies, researchers use numerous cases to draw inferences and test theories. Among others, two elements constitute fundamental aspects of the comparative research process: concepts and measures. On one hand, concepts define the phenomena under study. Sartori (Reference Sartori1970) warns that a potential risk for the reliability of a study, particularly relevant in comparative politics, is the problem of ‘conceptual stretching’. Comparative research is often weakened by the incorrect use of concepts that are not applicable to different contexts. On the other hand, comparative researchers build measures that should be comparable across the contexts they study. Concept formation and measurement are two strictly intertwined processes (Adcock and Collier, Reference Adcock and Collier2001).
The careful definition of concepts to be used in a comparative design is a necessary stage to construct empirical measures and operationalize them. Once the first step has been taken, the comparative researcher faces a great challenge: assessing measurement equivalence. As with concepts, measures should also be valid across the different contexts to which they are applied. Cross-national research has grown dramatically over the last two decades because of international survey projects (Norris, Reference Norris2009), but apparently the level of attention devoted to the assessment of the cross-national equivalence of measurement instruments has been insufficient, especially in the field of political science (King et al., Reference King, Keohane and Verba1994, Reference King, Murray, Salomon and Tandon2004; Jacoby, Reference Jacoby1999; Adcock and Collier, Reference Adcock and Collier2001; Jackman, Reference Jackman2008; Ariely and Davidov, Reference Ariely and Davidov2012). As Adcock and Collier (Reference Adcock and Collier2001: 534) maintain: ‘this concern with context can arise when scholars are making comparisons across different world regions or distinct historical periods […] the potential difficulty that context poses for valid measurement […] deserves more attention in political science’. Further, the process of measure validation in comparative research is linked to theory testing (King et al., Reference King, Keohane and Verba1994; Jacoby, Reference Jacoby1999), often the final aim of scientific research, as without reliable instruments it is not possible to provide reliable results, nor draw inferences from the cases under investigation.
When we deal with several contexts, we need to be sure that the measurement instrument is able to ‘capture’ the underlying latent construct we want to measure (Jackman, Reference Jackman2008). The operationalization process in comparative research requires the recognition that concepts have a ‘contextual specificity’ (Adcock and Collier, Reference Adcock and Collier2001: 529–530). Unfortunately, this is not sufficient to construct valid measures. Dismissing the importance of measurement equivalence may have very important consequences on the comparative study's validity. First, the conclusions drawn from a study using a non-tested measurement instrument representing a latent concept cannot be accepted as valid (Steenkamp and Baumgartner, Reference Steenkamp and Baumgartner1998). Second, if the measurement instrument is not validated comparatively, we cannot be sure that the relationships between it and other variables are reliable.
In brief, scholars need to assess whether or not a measurement instrument works in a similar manner across countries (Steenkamp and Baumgartner, Reference Steenkamp and Baumgartner1998; Vandenberg and Lance, Reference Vandenberg and Lance2000). The latent construct structure must be the same in all the contexts to which the measurement instrument will be applied (Byrne, Reference Byrne2008). This part of the research process is necessary for both descriptive and causal inference (Adcock and Collier, Reference Adcock and Collier2001). Thus, cross-country equivalence assessment should be a central concern for researchers testing hypotheses and theories in different contexts (Hui and Triandis, Reference Hui and Triandis1985). If researchers want to meaningfully compare the same concept in different contexts, they must be sure that the measure representing its underlying latent trait is comparable in all those contexts in order to avoid any potential bias.
Assessing measurement equivalence
What is measurement equivalence and how do we assess it? It implies the concepts of validity and reliability. Bollen (Reference Bollen1989: 184) conceptualizes validity as an issue ‘concerned with whether a variable measures what it is supposed to measure’. With regard to reliability, Adcock and Collier (Reference Adcock and Collier2001: 531) argue that ‘random error, which occurs when repeated applications of a given measurement procedure yield inconsistent results, is conventionally labeled a problem of reliability’. Measurement equivalence can be defined as ‘whether or not, under different conditions of observing and studying phenomena, measurement operations yield measures of the same attribute’ (Horn and McArdle, Reference Horn and McArdle1992: 117), meaning that what we observe through measurement is reliable and valid.
In Classical Test Theory (CTT), measurement equivalence has three different levels (Horn and McArdle, Reference Horn and McArdle1992; Steenkamp and Baumgartner, Reference Steenkamp and Baumgartner1998; Vandenberg and Lance, Reference Vandenberg and Lance2000; Byrne, Reference Byrne2008).Footnote 2 The first level of equivalence is ‘configural invariance’. This mainly refers to the factor loadings structure, meaning that in all countries the latent construct shows the same configuration of factor loadings. The second level of measurement equivalence is ‘metric invariance’. This type of equivalence requires that all factor loadings, measuring the strength of the relationship between items and the construct, be equal across countries. The last level of measurement equivalence is ‘scalar invariance’, which implies that the differences in the group means are due to the means of the underlying constructs, which ensures that the mean estimates are not biased.
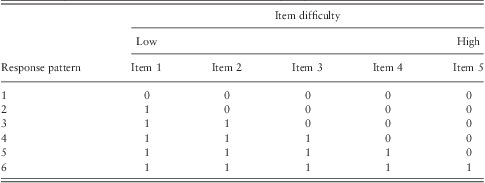
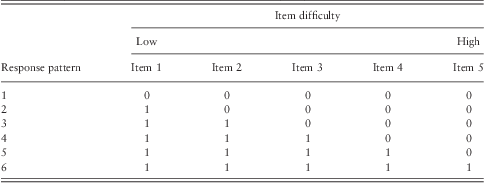
However, CTT has been criticized for some assumptions that cannot in most cases be met. In particular, it assumes that the items measuring a latent trait are parallel, meaning that they have similar means and standard deviations. Further, it does not take into account how respondents answer to items and, therefore, does not consider their ‘easiness’ or ‘difficulty’. Table 1 illustrates an example of hypothetical items, which are ordered to form a perfect scale along which respondents answering positively to more difficult items have also answered positively to easier items.Footnote 3 According to its critics, CTT is not able to capture this feature, especially when dealing with dichotomous or ordinal items (Sijtsma and Molenaar, Reference Sijtsma and Molenaar2002; Van Schuur, Reference Van Schuur2003). The ordinal nature of a scale has relevant theoretical implications, as each category represents cumulative ‘steps’ formed by items that do not have the same probability of being chosen by respondents.
Since CTT presents these problems, I use MSAFootnote 4 here within the framework of Item Response Theory (Mokken, Reference Mokken1971; Sijtsma et al., Reference Sijtsma, Debets and Molenaar1990, Reference Sijtsma, Meijer and Van der Ark2011; Sijtsma, Reference Sijtsma1998; Sijtsma and Molenaar, Reference Sijtsma and Molenaar2002; Van Schuur, Reference Van Schuur2003) – a development of the Guttman scale (Guttman, Reference Guttman1945). MSA has three assumptions. The first concerns the unidimensionality of the latent trait. The second concerns the monotonicity of the Item Response Function, meaning that as the probability of a positive answer to an item increases, for example participation in lawful demonstrations, the latent score, for example the index of political protest, also increases. The third is that respondents are locally independent. This means that the responses to some items by an individual depend on ability, defined by the latent trait, and not by other individual and item characteristics (Van Schuur, Reference Van Schuur2003: 145). This last assumption is often referred to as Invariant Items Ordering (Sijtsma et al., Reference Sijtsma, Meijer and Van der Ark2011). It follows that when a set of items form a Mokken scale the simple sum score can be used as the latent trait score (Mokken, Reference Mokken1971).
MSA has several advantages over covariance-based measurement models. First, it allows the researcher to determine the probability that a respondent has answered positively to an item conditional on other items. For instance, the probability that a respondent has attended a demonstration should be higher if he or she has signed a petition. Second, MSA is a probabilistic technique and not a deterministic one. This means it takes measurement errors into account. Guttman scaling assumes that a respondent has to follow a precise pattern of answers: a respondent answering positively to a difficult item also answers positively to a less difficult item. MSA, instead, accounts for the possibility that a respondent will not follow the hypothetical hierarchy of items. Third, MSA detects the items that do not conform to a cumulative scale and drops them through an iterative pairwise process. In fact, MSA uses a hierarchical clustering procedure made up of the following steps: (1) it finds the pair of items with the highest scalability coefficient; (2) it finds the next best item in the scale and repeats step one for all the items. Fourth, it requires items forming the scale to be sufficiently homogeneous among themselves. This makes the measurement instrument more reliable. Fifth, MSA works well when applied to a small number of items, unlike CFA. It can, eventually, be used as a confirmatory test that a set of items form a unidimensional and cumulative scale across different populations.
Since the aim here is to test the presence of an ordinal scale, a Double Monotonicity Model is used according to the following strategy. First, the homogeneity of the scale is tested – does the scale measure one latent trait and can it be cumulated using two coefficients? H is the scalability coefficient for the overall scale and must be ⩾0.30. If the coefficient is between 0.30 and 0.40, the scale is ‘weak’, if the coefficient is between 0.40 and 0.50 it is ‘moderate’, and if the coefficient is higher than 0.50 the scale is considered ‘strong’. When the coefficient is equal to one, we have a perfect Guttman scale, meaning that all respondents follow a hierarchical pattern in answering items. Hi, which measures the scalability of the single items, must be ⩾0.30 (Mokken, Reference Mokken1971; Van Schuur, Reference Van Schuur2003). Eventually, another coefficient, ρ, provides a measure of the reliability of the scale (Sijtsma and Molenaar, Reference Sijtsma and Molenaar1987).Footnote 5 Second, item ordering is evaluated so as to assess whether or not respondents follow, on average, the same response pattern in the analyzed countries.Footnote 6
Data
As mentioned, the ‘political protest’ scale can be constructed using five items in the EVS (2011). Western European countries only are selected and a cross-sectional design adopted.Footnote 7 Previous studies suggest a most similar systems design when studying political participation, since in recently democratized countries the patterns and the extent to which several modes of participation are used are very different compared with consolidated democracies (Teorell et al., Reference Teorell, Torcal and Montero2007; Morales, Reference Morales2009). Other publications (Norris, Reference Norris2002; Dalton et al., Reference Dalton, Van Sickle and Weldon2010) study different contexts. Yet it may be argued that the chances of bias in such analytical settings are very high since fully consolidated democracies and still-developing democracies present different modes of civic and political engagement. Further, the levels of development and democratization have a significant effect on levels of political protest (Dalton and Van Sickle, Reference Dalton and Van Sickle2005; Dalton et al., Reference Dalton, Van Sickle and Weldon2010). The countries included in the analysis are: Austria, Belgium, Cyprus, Denmark, Finland, France, Germany, Great Britain, Greece, Ireland, Iceland, Italy, Luxembourg, Malta, the Netherlands, Norway, Portugal, Spain, Sweden, and Switzerland.Footnote 8
The question wording for the political participation scale items in the EVS questionnaire is as follows:Footnote 9
Now I'd like you to look at this card. I'm going to read out some different forms of political action that people can take, and I'd like you to tell me, for each one, whether you have actually done any of these things, whether you would/might do it or would not/never, under any circumstances, do it/any of them:
• Signing a petition
• Joining in boycotts
• Attending lawful/peaceful demonstrations
• Joining unofficial strikes
• Occupying buildings or factories.
The original coding scheme assigns a score of ‘three’ to those who would never carry out the political action, two to those who might, and one to those who have carried out the political action. The items have been recoded reversing the scale and assigning a zero to those who would never carry out and might carry out the actions, and one to those who have carried out the political actions.Footnote 10 The index aims to measure only actual political protest, not potential protest (Marsh and Kaase, Reference Marsh and Kaase1979: 59).
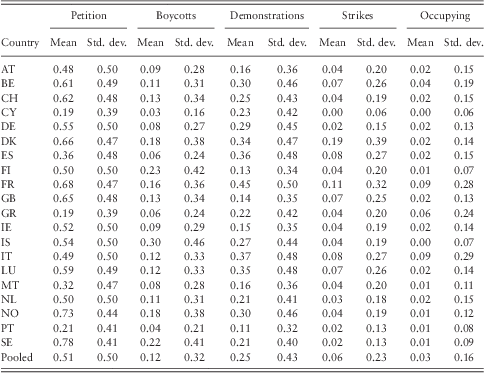
Table 2 presents the mean scores and standard deviations for each country for the forms of political action included in the analysis.Footnote 11 The table illustrates that means and standard deviations are not similar between the items both in the pooled sample and in the separate country samples. Further, it should be noted that ‘signing a petition’ is a form of action used frequently in Northern and Continental European countries. The highest mean score is present in Sweden, where almost 80% of the sample has signed a petition. In addition, Norway and Denmark present high levels of petitioning. In Continental Europe, France and Germany score quite high.
Item means and standard deviations for each country and for the pooled sample

AT = Austria; BE = Belgium; CH = Switzerland; CY = Cyprus; DE = Germany; DK = Denmark; ES = Spain; FI = Finland; FR = France; GB = Great Britain; GR = Greece; IE = Ireland; IS = Iceland; IT = Italy; LU = Luxembourg; MT = Malta, NL = the Netherlands; NO = Norway; PT = Portugal; SE = Sweden.
In Southern European countries, this mode of action is less popular compared with other contexts – the lowest scores are in Malta, Portugal, Cyprus, and Greece. As far as ‘joining in boycotts’ is concerned, the same pattern is present in the selected countries. Iceland and Finland have the highest scores, while in Southern Europe this form of action is less present. ‘Attending a lawful demonstration’ is, instead, a more common form of political action – highest in France, Italy, and the Nordic countries. It is lower in Portugal, Great Britain, and Ireland. With regard to ‘joining unofficial strikes’, the highest percentages of respondents taking part in such actions are observed in France and Denmark. Conversely, in Cyprus, Portugal, Germany, and Sweden, we find the lowest levels of participation in this form. The last form of political action, ‘occupying buildings or factories’, is most frequent in France and Italy, while in Finland and Iceland it is marginal among the five forms of action.
Analysis
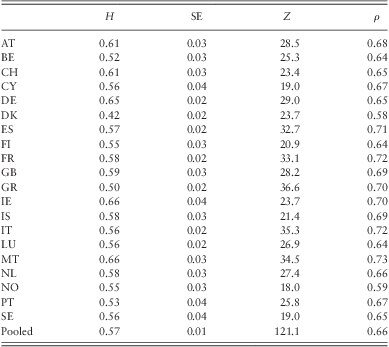
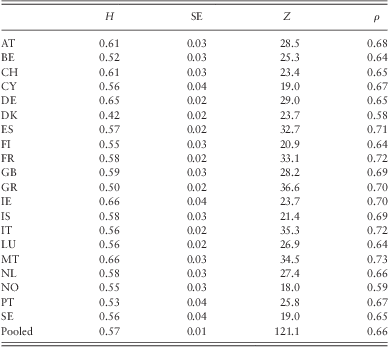
This section presents the results of the MSA.Footnote 12Table 3 shows the H coefficients for each country and the pooled sample. The coefficient for the pooled sample is about 0.56, which tells that if we do not take countries’ heterogeneity into account the items can be summed up in a scale.
H coefficients with standard errors, Z statistics, and ρ for each country and for the pooled sample
AT = Austria; BE = Belgium; CH = Switzerland; CY = Cyprus; DE = Germany; DK = Denmark; ES = Spain; FI = Finland; FR = France; GB = Great Britain; GR = Greece; IE = Ireland; IS = Iceland; IT = Italy; LU = Luxembourg; MT = Malta, NL = the Netherlands; NO = Norway; PT = Portugal; SE = Sweden.
The same analysis can be carried out for the coefficients estimated on the separate country samples. In almost all cases, the coefficient is higher than 0.5, which represents the threshold for a strong scale. The coefficients are highest in Malta, Ireland, and Germany and lowest in Denmark.
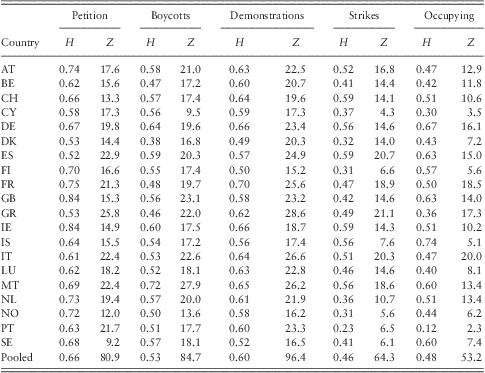
Looking at the standard errors and Z statistics,Footnote 13 it is noteworthy that the coefficients are highly statistically significant. Further, ρ coefficients confirm that the scale is a reliable one. If the cross-national equivalence analysis of the political protest scale were to be stopped here, it would be accepted, as the H coefficients are high in all the countries. However, the H coefficient only measures the homogeneity of the scale and the distance from a perfect Guttman model. Therefore, in order to further assess the cross-national equivalence of the scale, it is important to take into account the H coefficients for the items (Table 4).
H coefficients and Z statistics of the five items for each country and for the pooled sample
AT = Austria; BE = Belgium; CH = Switzerland; CY = Cyprus; DE = Germany; DK = Denmark; ES = Spain; FI = Finland; FR = France; GB = Great Britain; GR = Greece; IE = Ireland; IS = Iceland; IT = Italy; LU = Luxembourg; MT = Malta, NL = the Netherlands; NO = Norway; PT = Portugal; SE = Sweden.
In almost all cases, the H coefficients of the items are ⩾0.30 and highly statistically significant. Only one case presents H coefficients below the suggested threshold: Portugal for the items ‘strikes’ and ‘occupying’. Therefore, the Mokken scale should not be accepted for this case. According to the analysis of the scale's H coefficients and the items’ H coefficients, if we are to meaningfully compare the sum scores of the political protest scale we should eliminate Portugal. The monotonicity assumption is not violated in the separate country samples. Having confirmed the presence of a unidimensional construct measuring the underlying concept of political protest and its cross-national equivalence for a specific number of cases, an additive scaling procedure is used to construct the scale. The individual scores on each item are summed to obtain the overall political protest index.
The index ranges from zero to five, where zero represents an individual who has never engaged nor thought of engaging in any of the five forms of unconventional political participation and five represents an individual who has engaged in all of the forms. This scale may be used similarly across countries if its ordering is not taken into account.Footnote 14Figure 1 shows the mean point estimates with 95% confidence intervals for the comparable countries and the pooled sample.Footnote 15 Within the set of countries where the items form a homogeneous scale, there is a substantial amount of variation. The index mean for the pooled sample is about one and countries can be classified in three distinctive groups. There is a low unconventional participation group of countries composed by Cyprus, Greece, Malta, Austria, Ireland, and the Netherlands. Then, the group of average countries with mean scores that match the pooled sample average: Spain, Finland, Germany, Great Britain, Switzerland, Belgium, Iceland, Luxembourg, and Italy. Eventually, four countries, Norway, Sweden Denmark, and France, show a mean score above the average.
‘Political protest’ index means with 95% confidence intervals for each country and for the pooled sample
Although the scale is comparable across these countries, it is not yet clear whether, for example, respondents scoring three in each country have engaged in the same actions. This can be assessed by looking at the Invariant Item Ordering violations in the single samples. Significant violations were found for Spain and Sweden. This means that in these two countries we do not have an ordinal scale when using five items.
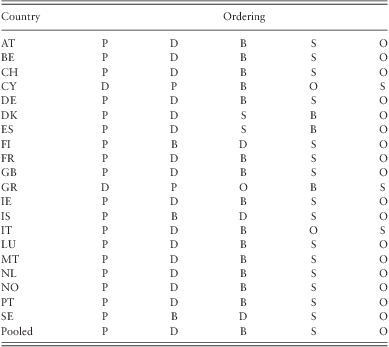
The second step of the analysis tests whether the item ordering is the same in the different samples so that we can say, for instance, that a respondent scoring two in France has engaged in the same actions as a respondent scoring two in Italy. We can now tell how many citizens have engaged in zero, one, two, three, four, and five political actions.Footnote 16 To further explore the political protest scale's cross-country equivalence, the analysis should check how the items are ordered in the country samples in order to assess whether the points of the scale hold the same meaning in different contexts. Table 5 includes the item ordering, which can make an optimized Mokken scale. In most cases, the item ordering is the same as in the pooled sample. Five patterns describing different item orderings emerge from the data. However, to use the scale as an ordinal one and compare it across countries, only those countries showing the same item ordering should be used. The countries that may be compared using a five-item scale with six points, with an ordering equal to (1) petition, (2) demonstrations, (3) boycotts, (4) strikes, and (5) occupying, are: Austria, Belgium, France, Germany, Great Britain, Ireland, Malta, the Netherlands, Norway, and Switzerland. Finland and Iceland can also be compared, but follow a different item ordering. Denmark, Greece, and Italy cannot be compared with the other cases since they all present unique item orderings. For Spain, Sweden, and Portugal no ordinal scale may be built, as the first two have different item orderings compared with the other countries, and the latter has an inadequate H.
Item ordering for each country and for the pooled sample
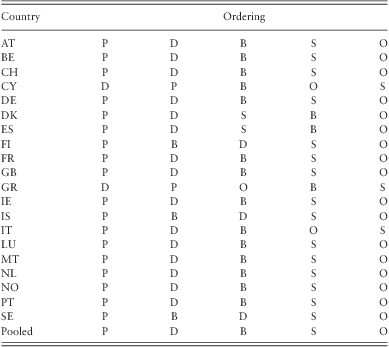
AT = Austria; BE = Belgium; CH = Switzerland; CY = Cyprus; DE = Germany; DK = Denmark; ES = Spain; FI = Finland; FR = France; GB = Great Britain; GR = Greece; IE = Ireland; IS = Iceland; IT = Italy; LU = Luxembourg; MT = Malta, NL = the Netherlands; NO = Norway; PT = Portugal; SE = Sweden; P = signing a petition; D = attending lawful demonstrations; B = joining in boycotts; S = joining unofficial strikes; O = occupying buildings or factories.
The levels of political protest in the pooled sample and in the country samples can now be addressed. Disregarding the countries’ heterogeneity, we can say that those who never engaged in political protest nor thought of doing so represent about 40% of the sample. Those who signed a petition represent about 34%, those who attended lawful demonstrations 16%, the percentage of respondents who boycotted products is seven, while those who joined an unofficial strike and occupied a factory or a building account for, respectively, two and almost 1% (see Figure 2). The highest percentage of inactive respondents is in Malta (62%), while the lowest is in Norway (23%). As far as petitions are concerned, the country in which these are the most used is Great Britain, while respondents use them the least in Malta. The highest numbers of demonstrators, boycotters, strikers, and occupiers are found in France, and the lowest in, respectively, Malta, Ireland, Germany, and Norway.
‘Political protest’ index distribution in the comparable countries
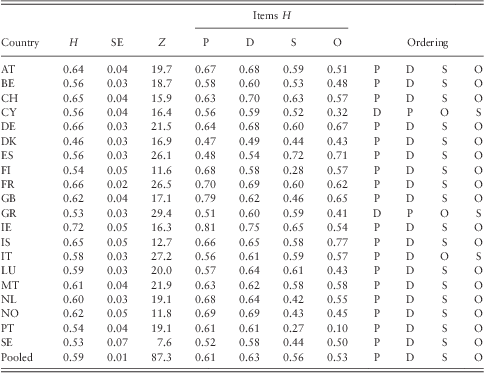
If a comparative researcher is interested in comparing more cases, he or she may enlarge the scope by discarding an item and checking whether the new set of items forms a ‘more’ comparable scale, a sub-scale of political protest. Table 6 demonstrates that removing the item ‘boycotts’ would lead to more cases in which the items form a Mokken scale. All the H coefficients for the scale are higher than 0.4, and in most cases they are higher than 0.5. Further, they are all highly significant. The H coefficients of the items are lower than 0.30, as before, for Portugal for the items ‘strike’ and ‘occupying’. However, the item ordering is now similar across more countries. In fact, using five actions the scale is comparable for 10 countries, while excluding the item ‘boycotts’ makes the scale comparable for up to 16 countries, thus allowing a broader scope of analysis.
H coefficients, standard errors, Z statistics, items’ H coefficients for the political protest scale constructed with four items for each country and for the pooled sample
AT = Austria; BE = Belgium; CH = Switzerland; CY = Cyprus; DE = Germany; DK = Denmark; ES = Spain; FI = Finland; FR = France; GB = Great Britain; GR = Greece; IE = Ireland; IS = Iceland; IT = Italy; LU = Luxembourg; MT = Malta, NL = the Netherlands; NO = Norway; PT = Portugal; SE = Sweden; P = signing a petition; D = attending lawful demonstrations; S = joining unofficial strikes; O = occupying buildings or factories.
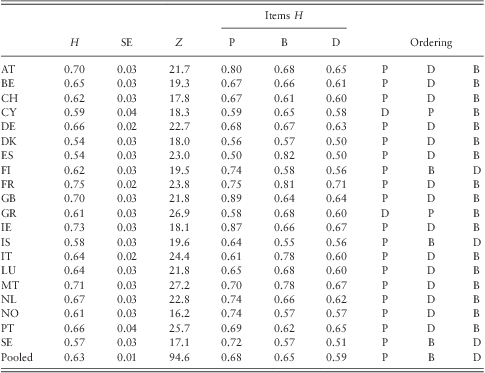
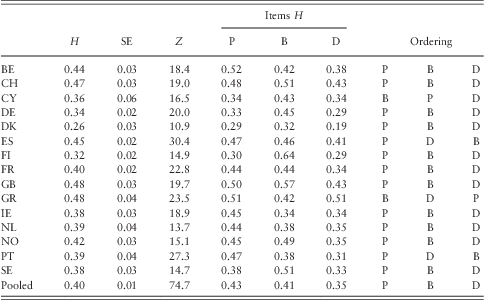
Welzel and Deutsch (Reference Welzel and Deutsch2012: 469) argue that a scale of political protest can be constructed using three items, getting rid of ‘joining unofficial strikes’ and ‘occupying buildings or factories’, for several reasons: ‘First, these activities are closer to violence, so including them blurs the focus on non-violent protest. Second, these activities stick out from the others as being by far the least popular ones. They are used in every sample by such minor proportions of the respondents (consistently below 5%) that responses are fully within the margin of sampling error’. In line with this argument, the scale was reanalyzed using three items.Footnote 17 The H coefficient for the whole scale is high (above 0.50) in all the countries, showing that this sub-scale is very strong. Z statistics strengthen the reliability of the scale since all coefficients are highly statistically significant. The H coefficients of the items also tell that the three-item scale is acceptable since all values are >0.30. The most popular item ordering is: (1) ‘petition’, (2) ‘demonstrations’, and (3) ‘boycotts’. This response pattern is the same in 15 countries, while it varies for the other five. This analysis shows that reducing the number of items allows the scale to be applied in all 20 Western European countries, if item ordering is not taken into account. This means that a cumulative scale can be constructed, ranging from zero to three, where zero represents an individual who has not engaged in any political action and three represents a respondent who has engaged in all actions. To analyze political protest in a comparative perspective while being certain that each point of the scale has the same meaning in all countries, Cyprus, Finland, Greece, Iceland, and Sweden should be excluded.
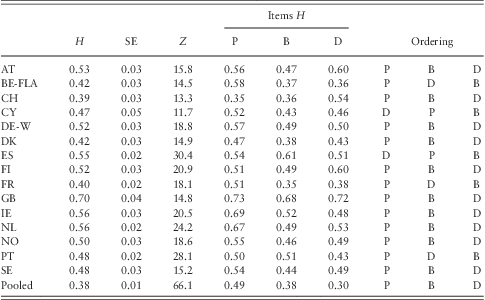
Since the International Social Survey Programme (ISSP, 2007) and the European Social Survey (ESS, 2011) contain the same three items, the scale is validated using these surveys.Footnote 18 The MSA on the ISSP data (Citizenship survey) shows that the scale is homogeneous in all the countries (H ⩾ 0.30). The H coefficients of the items are all above the suggested threshold. Conversely, the MSA on the ESS data (fourth round) suggests that Denmark, Germany, and Finland should all be discarded on the basis of low H coefficients for items. Figure 3 presents the mean scores of the cumulative scales, built using three items and the EVS, ISSP, and ESS data, for each country where the data are available and H coefficients are above the threshold of 0.30.Footnote 19
Mean scores of the political protest index using three items and the EVS, ISSP, and ESS data for the available countries. EVS = European Values Study; ISSP = International Social Survey Programme; ESS = European Social Survey
Surprisingly, the scores are not similar among the three data sets used. It seems the ISSP data overestimate the mean scores, while the ESS data underestimate them. The EVS data always present scores that fall in between the other two data sets. The item ordering for both the ISSP and ESS data is different from that found using the EVS data. The item ordering for the two data sets is most frequently: (1) ‘petition’, (2) ‘boycotts’, and (3) ‘demonstrations’.Footnote 20 It may be possible that the differences in the means and item orderings are due to different question wordings in the three questionnaires and not to systematic bias. In fact, the EVS question allows respondents to express the intention to engage in forms of political protest; the ISSP question has four possible answers;Footnote 21 and the ESS questions only ask whether or not the respondent has engaged in the actions in the last 12 months.Footnote 22 Besides, it should be underlined that the three- and five-item scales built using the EVS data have similar mean scores, as they are highly correlated.Footnote 23 This is due to the hierarchical property of the items. In fact, those who answered positively to ‘joining unofficial strikes’ and ‘occupying buildings or factories’ also answered the other three items positively.
Conclusion
This article analyzed the concept of political protest and provided an empirical strategy, first, to measure its underlying latent trait and, second, to assess its cross-national equivalence in a set of 20 Western European countries. As argued, despite the tradition of concept formation and analysis within the field of political science (Sartori et al., Reference Sartori, Riggs and Teune1975; Sartori, Reference Sartori1984), as also demonstrated by recent publications (Goertz, Reference Goertz2006; Collier and Gerring, Reference Collier and Gerring2008; Mair, Reference Mair2008), the importance of testing measurement instruments in comparative research is less prominent in the literature (Van Deth, Reference Van Deth1998b; Jackman, Reference Jackman2008; Ariely and Davidov, Reference Ariely and Davidov2012; Stegmuller, Reference Stegmuller2011), even though it is a fundamental stage of empirical research ensuring that analyses carried out are unbiased (Jacoby, Reference Jacoby1999).
The article thus assessed the cross-national measurement equivalence of the political protest scale. First, according to the existing literature, the concept of political protest was outlined, distinguishing it from conventional political participation. Barnes and Kaase (Reference Barnes and Kaase1979) created the distinction between conventional and unconventional political participation, arguing that the latter addresses not only political institutions but also private subjects using more intense forms of political action. Accordingly, political participation can be seen as a ladder made up of several rungs of intensity, ranging from legal conventional participation, such as voting or campaigning, to unconventional participation activities, such as demonstrations, boycotts, or occupations of buildings (Dalton, Reference Dalton1988, Reference Dalton2008). Unconventional political participation includes direct political protest activities that are not mediated by institutions (Della Porta and Diani, Reference Della Porta and Diani2006; Tilly and Tarrow, Reference Tilly and Tarrow2006), with different degrees of ‘legality, that is, their conformity to legal norms relevant for a given type of behavior, and their legitimacy, that is, the extent to which a given population at a given point in time approves of or disapproves them’ (Kaase and Marsh, Reference Kaase and Marsh1979a: 45). Since political protest can be conceptualized as an ordinal continuum, MSA was used to assess its unidimensionality, the homogeneity of the items capturing the underlying latent trait and its cross-national equivalence. Techniques belonging to CTT were avoided, and the article focused on a model of ordinal unidimensional measurement more suited to dichotomous items (Van Schuur, Reference Van Schuur2003).
It was shown that when using the items included in the EVS (2011) the number of comparable Western European countries varies depending on what we intend to measure. If the goal is simply to verify that the scale has a sufficient degree of homogeneity, the scale may be applied to 19 out of 20 countries. If, instead, each step of the scale must have the same meaning, only 10 cases out of 20 may be used.
It was also shown that using the four- or three-item scales maximizes the comparability of the concept of political protest, since they make the ordinal measure fully comparable in 16 countries, albeit while reducing its intension, as fewer items are employed in the scale. This demonstrates that measurement equivalence should be an important concern for comparative researchers because analyses depend on how we choose measures.
The article aimed to contribute to the literature by providing a systematic study about the cross-national equivalence of the protest scale, which was absent in the literature, although this measure is widely used. It was argued that the assessment of cross-national measurement equivalence is a very relevant component of comparative analysis. The growing possibilities that international surveys provide to include larger numbers of countries (Norris, Reference Norris2009) require that the comparative researcher tests measurement instruments, in particular given the popularity of statistical methods, such as hierarchical models, suited for quantitative comparative research (Steenbergen and Jones, Reference Steenbergen and Jones2002; Gelman and Hill, Reference Gelman and Hill2006). Therefore, assessing the equivalence of measurement instruments ensures that we use measures with the same construct, that is, the concept is measurable with the same set of items, across populations. It follows that the measurement instrument thus has the same meaning in different contexts. Further, and most importantly, it increases the probability that the inferences drawn are correct. If we do not test measurement instruments, we cannot be sure whether the relations between dependent and independent variables are the product of real phenomena or just chance.
Acknowledgments
I would like to thank the Editors and the anonymous reviewers for providing valuable feedback and comments to previous versions of the article.
Appendix
H coefficients, standard errors, Z statistics, items’ H coefficients for the political protest scale constructed with three items for each country and for the pooled sample using the EVS data
H coefficients, standard errors, Z statistics, items’ H coefficients for the political protest scale constructed with three items for each country and for the pooled sample using the ISSP data
H coefficients, standard errors, Z statistics, items’ H coefficients for the political protest scale constructed with three items for each country and for the pooled sample using the ESS data