I. INTRODUCTION
There is an immense demand for renewable energy due to the limited accessibility of fossil and nuclear fuels and also with the growing environmental problems. Photovoltaic technology has the potential to contribute significantly to the next generation of electrical energy. Reference Shell1 Among all photovoltaic cells, Cu-based group I-III-V2 chalcopyrite thin film solar cells have been studied for years because of their stability and high solar conversion efficiency. Cu-chalcopyrite semiconductor materials are used as absorber layers in heterojunction solar cell devices. Among Cu-chalcopyrite materials, Cu(InGa)Se2 (CIGS) solar cells have been produced with the highest efficiency of 20.3%. Reference Jackson, Hariskos, Lotter, Paetel, Wuerz, Menner, Wischmann and Powalla2,Reference Ullal and Roedern3 The theoretical studies predict that the thin film heterojunction devices perform to their maximum efficiency when the absorber layer band gap is ideally 1.5 eV. Reference Kemell, Ritala and Leskelä4,Reference Shah, Torres, Tscharner, Wyrsch and Keppner5 Introducing Ga at various atomic percentages alters the [Ga]/[In + Ga] ratio and consequently the band gap (E g) varies from 1.02 eV (for CuInSe2) to 1.68 eV (for CuGaSe2) Reference Ahmed, Tomlinson, Pilkington, Hill, Ahmed, Ali and Hassan6,Reference Romeo, Terheggen, Abou-Ras, Bätzner, Haug, Kälin, Rudmann and Tiwari7 and thus provided the way for the optimization of E g. However, CIGS includes a toxic element, i.e., Se, so it is not an environmental friendly material as compared to CuInS2 (CIS). Therefore, CIS is still the major focus of the research interest among the materials suitable for thin film solar cells, such as amorphous silicon, CdTe, and Cu(In,Ga)Se2. Reference Birkmire8 CuInS2 has an energy band gap, E g ∼ 1.52 eV, and has a high absorption coefficient 105 cm−1. Reference Scheer, Walter, Schock, Fearheiley and Lewerenz9,Reference He, Kriegseis, Meyer, Polity and Serafin10 The practical conversion efficiency of CuInS2 solar cells is presently limited to approximately 12%. Reference Siemer, Klaer, Luck, Bruns, Klenk and Bräunig11 Therefore, this material is more applicable as a top absorber layer for the tandem solar cells.
Many researchers prepared CIS thin films by using several techniques including thermal decomposition, chemical vapor transport, thermal evaporation, sputtering, and hydrothermal and sol gel coating. Reference Kino, Kuzuya, Itoh, Sumiyama, Wakamatsu and Ichidate12–Reference Tsai, Ting and Wang19 Braunger et al. Reference Braunger, Hariskos, Walter and Schock15 demonstrated the performance of CIS solar cells with efficiency close to 12%. The optical absorption of CIS is very high with absorption coefficient ∼10−5 cm−1 in the visible and near-infra-red (IR) regions. Reference Gurinovich, Gurin, Ivanov, Bodnar, Molochko and Solovei20,Reference Scheer, Diesner and Lewerenz21 Although several researchers Reference Malyarevich, Yumashev, Posnov, Mikhailov, Gurin, Prokopenko, Alexeenko and Melnichenko22–Reference Qi, Liu, Tang, Liang, Ren and Liu25 have studied about this material, film thickness and annealing temperature dependent structural change are still motivating. A systematic investigation on bulk energy band gap and strong excitonic transition with increasing annealing temperature is a very fundamental problem in CIS.
Normally, in thin films deposited on substrates held at an ambient temperature, the conditions for the formation of crystalline films fully do not obtain. Thus, it becomes necessary to anneal the films, which are disordered. Annealing favors surface diffusion and more importantly allows clusters to attain equilibrium and develop into an ordered crystalline structure. This transformation from a disordered to an ordered state is essentially driven by externally supplied thermal energy. The optical transition from excitonic to bulk absorption is exceedingly noticeable when the transition occurs between the two structurally disordered and ordered states. Rajesh et al. Reference Rajesh and Sunandana26 studied this transition through thorough chemical etching of Ag films, which were briefly brominated.
The goal of the present work is to investigate the structural transition from quasi-amorphous (highly disordered and poorly ordered) to nanocrystalline (highly ordered and poorly disordered) phase in CuInS2 thin films by thermal annealing process and for which the characterization techniques such as x-ray diffraction (XRD), atomic force microscope (AFM) techniques, Raman spectroscopy, and UV-visible spectrophotometer are used. For this purpose, we deposited CuInS2 films of various thicknesses ranging from 196 to 1000 nm by thermal evaporation using a single source containing CIS nanoparticles and then these films were annealed from 100 to 500 °C in a vacuum furnace. Prior to the deposition, CIS nanoparticles were prepared in a high temperature furnace by following controlled step-heating process Reference Karthikeyan, Hill, Pilkington, Cowpe, Hisek and Bagnall27 and used as a precursor for the preparation of CuInS2 thin films. In this work, step-heating process is proved to be the very best and rapid method for the synthesis of CIS nanoparticles. The film thickness and temperature dependent optical properties and chemical structure of CuInS2 thin films are investigated by UV-visible spectroscopy and Raman spectroscopy.
II. MATERIAL AND METHODS
A. Synthesis of CuInS2 nanoparticles
Ingot of CuInS2 was prepared in a high temperature furnace after mixing high pure (99.99%) elements such as Cu, In, and S in 1:1:2 stoichiometry ratio in a vacuum sealed quartz ampoule at the pressure of 1 × 10⁻³ mbar. To avoid explosion due to sulfur vapor pressure, a step heating and cooling process was followed. The melt was kept at 1150 °C for 2 h to achieve a complete homogeneous mixture.
B. Heating steps
28–50 °C: 5.0 °C/min.
50–350 °C: 0.5 °C/min.
350–1150 °C: 10.0 °C/min (kept at 1150 °C for 2 h).
C. Cooling steps
1150–28 °C: 10 °C/min.
Slow heating process was crucial between 100 and 300 °C because of the exothermic reaction between sulfur and indium. Ingot was formed after the sample was cooled slowly. Later on, the CIS ingot was crushed into powder form using an agate mortar and pestle to obtain a homogeneous composition of CuInS2 phase.
D. Preparation of CuInS2 thin films
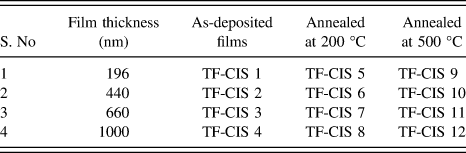
Prior to the deposition, micro glass slides were first immersed in 10% soap solution with 90% water, rubbed with cotton in distilled water to remove weathering, kept in acetone followed by ultrasonication for 10 min, then washed in cold water to remove the surface contaminants followed by ultrasonication for 10 min in deionized water, and finally these substrates were dried. Afterward, these glass slides were loaded inside the thermal evaporation chamber and used as substrates for thin film deposition. The as-prepared CIS nanoparticles were placed in a molybdenum boat and then evaporated by applying dc current of 62 A to reach sufficiently above the melting point of 1050 °C. The evaporants condensed on the substrates were placed directly above the source at a distance of 26 cm. The base pressure of the evaporation chamber was 1 × 10⁻⁶ mbar and the deposition rate was maintained between 1 and 2 nm per second throughout the deposition process. The thickness of the films was varied from 196 to 1000 nm with increasing the deposition time by retaining the same deposition rate. Finally, the film thickness was confirmed with the help of a laser surface profilometer. Sample codes of the as-deposited films and annealed films as a function of film thickness are mentioned in Table I.
Sample codes of as-deposited and annealed CuInS2 thin films with increasing film thickness.

E. Characterization techniques
XRD patterns of as-prepared CuInS2 (CIS) films were recorded by Philips PW 1830 XRD instrument (Netherlands) using monochromatic Cu Kα (λ = 1.541 Å) radiation at a scanning rate of 2° per minute in 2θ ranging from 10 to 70°. The samples were examined by field emission scanning electron microscopy (FE-SEM), and the elemental compositions of the films were determined by means of energy dispersive x-ray analysis (EDX) using a ZEISS-ULTRA 55 equipment (Germany). Seiko SPA-400 scanning probe microscope (Japan) was used in the noncontact atomic force microscopy mode to obtain the surface topography of CuInS2 thin film samples. Micro Raman scattering measurements have been performed at room temperature with a Jobin–Yvon Horiba spectrometer (Japan) coupled with an Olympus metallographic microscope, using the green line of an Ar+ laser (λ = 514 nm) as the excitation light. The objective used (×100, NA 0.95) yields a nearly submicron spot size on the sample spectra, which were obtained in the backscattering configuration, collecting light from all possible polarizations. Under these conditions, the depth investigated by the Raman microprobe is determined by optical absorption of light in CuInS2, which is about 1/100 nm. Excitation power of light on the sample was about 1.0 mW, for which no thermal effects in the spectra were observed. Finally, the spectra were compared with those measured at the same conditions on single crystal stoichiometric CuInS2. Optical measurements such as absorbance, reflectance, and transmittance of CIS films were recorded using UV-Vis-NIR (JASCO V-670, Japan) spectrophotometer in the wave length range between 300 and 2000 nm.
III. RESULTS AND DISCUSSION
A. Crystal structure, surface morphology, and chemical structure
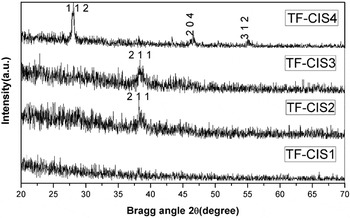
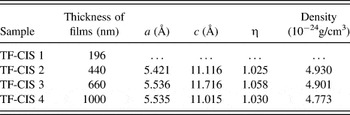
The XRD spectra in Fig. 1 show that the film with 196 nm exhibits quasi-amorphous structure. However, it becomes crystalline with increasing the film thickness as confirmed by (211) plane at 38.2° (in 2θ) for TF-CIS 2 and TF-CIS 3. The as-deposited CIS thin films have short-range orders of any type of crystallographic orientations, which are possible within the chalcopyrite phase. Here, the (211) plane is preferably grown with the short-range order up to 660 nm of film thickness. With increasing film thickness above 660 nm, the long-range order is becoming more dominant in (112) direction rather than in (211) direction. TF-CIS 4 shows the presence of three prominent CIS peaks corresponding to the planes (112), (204), and (312) at 2θ equal to 28.08, 46.67, and 54.97°, respectively. Reference Rajesh and Sunandana26 It can be said that a crystalline CIS film forms at 1000 nm film thickness, which is as-deposited, tending to grow predominantly in (112) direction, whereas the plane (211) oriented faintly strong in a partly disordered (quasi-amorphous) CIS phase. Evidently, at higher thickness, the peak (2 1 1) disappears and the new plane (1 1 2) starts to grow (Fig. 1). The other secondary faces such as, In2S3 and Cu2S, were not found in XRD pattern. The single phase growth of CuInS2 was confirmed after comparing the crystal plane positions with the Joint Committee for Powder Diffraction Data (JCPDS) of tetragonal CuInS2 structure (Card Number: 89-6095). Chalcopyrite structure is a distorted double zincblende lattice, with the lattice parameter c > 2a, which is in good agreement with our calculated results. Tetragonal distortion (η) of the lattice is calculated from the equation 2 − (c/a). The unit cell lattice parameters (a, c, η, and density) were calculated for all XRD patterns and compared in Table II. The lattice parameters observed agree well with the reported data (a = 5.523 Å and c = 11.14 Å), favoring the formation of CuInS2 structure in thin film form by thermal evaporation. Tetragonal distortion (η) is found to be ≈1 confirming the arrangement of an extended double lattice structure of CuInS2.
XRD patterns of thermally evaporated CuInS2 films with thicknesses of 196, 440, 660, and 1000 nm (from bottom to top). The as-deposited films are almost quasi-amorphous in nature; however, long-range order increases with increasing film thickness progressively.

Thickness, unit cell lattice parameters, and tetragonal distortion parameter of thermally evaporated as-deposited CuInS2 films.

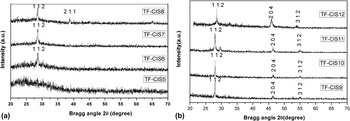
Figure 2 shows XRD patterns of the as-deposited CIS films annealed at 200 and 500 °C. The crystallinity of chalcopyrite phase of CIS marginally increases after the as-deposited films annealed at 200 °C. A very high degree of crystallinity is achieved for crystal planes such as (112), (204), and (312) with increasing film thickness up to 1000 A°, because thermally evaporated atoms/molecules release lots of thermal energy, thus increasing the surface diffusion of CIS atoms responsible for the long-range order development. Moreover, it is further enhanced after annealing the films at 500 °C. All the peaks are in good agreement with the standard pattern of CuInS2. Reference Hwang, Cheng, Liu, Liu and Sun28 A shift in 2θ of TF-CIS 12 occurs mainly due to two reasons: (i) when there is a decrease in Cu/In ratio Reference Kodigala29 and (ii) stress relaxation. There is a least probability for accepting the first reason because the same shift is not observed in as-deposited and annealed films (at 200 °C). The second reason could be very much satisfactory. The as-deposited films are under both intrinsic and extrinsic stresses. Intrinsic stress comes from defects such as dislocations in thin films. The origin of extrinsic stress comes mainly from adhesion to its substrate. The adhesion of CIS film on a glass substrate is fairly well. Stress is introduced also in CIS thin films grain growth, and the removal of grain boundaries, hence the reduction of excess volume in the grain boundaries, induces stress in the film when it is constrained by the glass substrate. As the annealing temperature increases to 500 °C, the 2θ position of (112) peak is shifted toward the higher angle side due to the relaxation of stress. Reference Shim, Kang, Pang, Kang, Yun and Lee30
XRD patterns of CuInS2 films annealed at (a) 200 °C and (b) 500 °C. Sample codes of all the annealed CuInS2 films are given in Table I. Quasi-amorphous of CuInS2 films are crystallized after annealing at 500 °C.

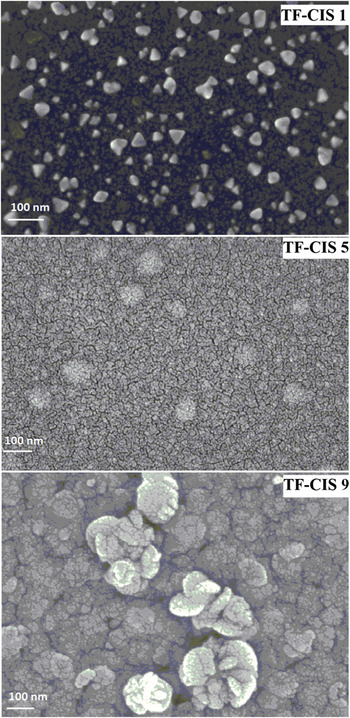
FE-SEM images show surface morphology of as-deposited and annealed films of thickness 196 nm. Triangular shape of CIS nanoparticles embedded in a disordered matrix was obtained in the as-deposited film.

In thermal evaporation, the atoms are evaporated from the source subsequent to nucleate on the substrate by rapid condensation to form small islands. Since the substrate is placed at an ambient temperature, the thermal energy induced diffusion process is relatively slow, thereby controlling the agglomeration to form bigger clusters. Such situation is feasible up to 200 nm of film thickness due to the presence of a lesser amount and larger interparticle distance of islands on a glass substrate. The packing density of small islands increases with film thickness, where bulk diffusion is dominated among all islands leading to the formation of crystalline CuInS2 phase. The particles are separated from each other by distances determined by the volume fraction of the CIS particle loaded in the glass matrix, and thus the film behaves like a disordered system. This particular disordered structure is known as the quasi-amorphous phase (absence of long-range order). Consequently XRD of thermally evaporated shows a very broad background from angle 20 to 35 in 2θ. Thin film of thickness 196 nm shows an amorphous-like structure up to 200 °C—a direct evidence of short-range order and then it is crystallized at 500 °C by thermal means leading to agglomeration of CIS nanoparticles, which is confirmed with the existence of (112) plane in XRD pattern (TF-CIS 9). Diffracted planes observed at 500 °C become very sharp in peak shape with increasing film thickness and this could be due to an increase in crystallite size of CuInS2. Table III shows a random change in lattice parameters (a, c) and lattice distortion (η) with increasing annealing temperature; however, it occurs in a negligible range.
Film thickness, unit cell parameters, and tetragonal distortion parameter of thermally evaporated CIS films annealed at 200 and 500 °C.

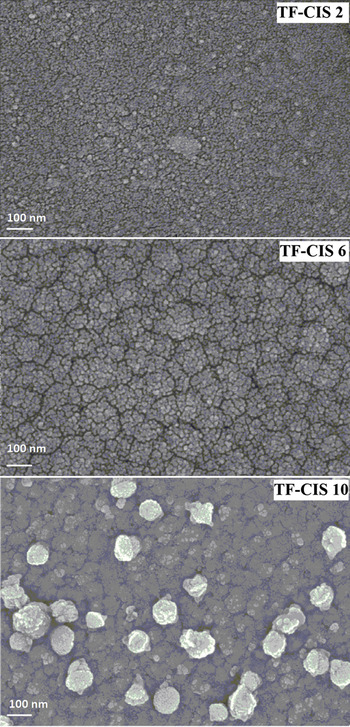
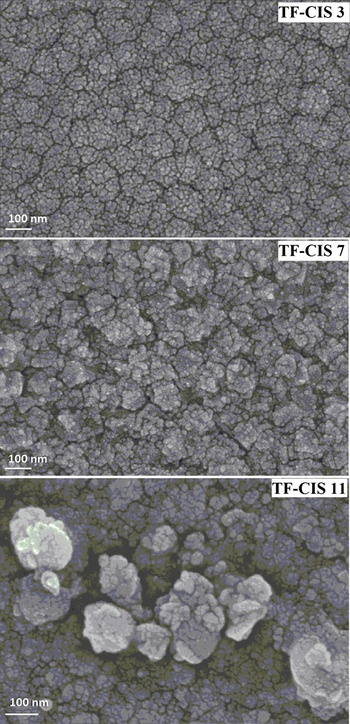
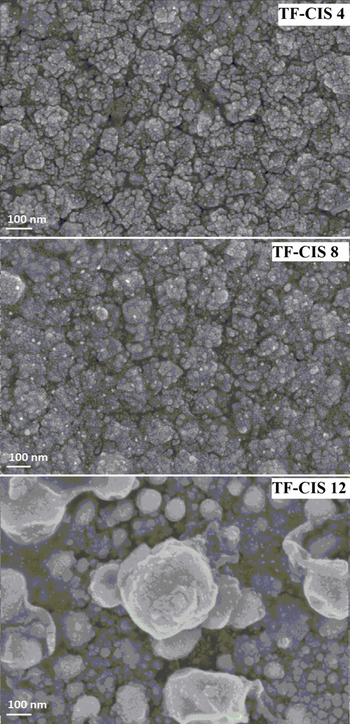
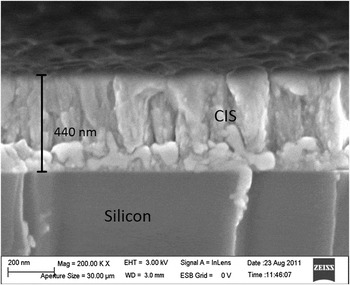
Surface morphology was studied on both as-deposited and annealed films by FE-SEM technique (Figs. 3–6). Figure 3 shows the as-deposited CuInS2 films that appear in a disordered form exhibiting few triangle-shaped embryos with phase length of each side 36, 42, and 44 nm; a very interesting and unusual result in thermally as-deposited evaporated films. A very smooth surface of CIS film was observed after annealing at 200 °C due to an increased surface diffusion. Particle size increases with increasing annealing temperature at 500 °C and with increasing film thickness indicating the crystallization of CuInS2 nanoparticles. The size and shape of the particles were homogeneous up to 200 °C and subsequently some bigger clusters were formed due to the agglomeration process with increasing annealing temperature to 500 °C. The surface roughness of films increased with increasing both annealing temperature and film thickness. The packing density of CIS particles increases with increasing film thickness, which leads to increase in the interparticle diffusion between the particles. From the above observations, one can visualize the topographical differences between the quasi-amorphous and crystalline films in conjunction with XRD results. To cross-check the film thickness, a cross-sectional view of the as-deposited CIS film of thickness 440 nm is taken from FE-SEM (Fig. 7). The film thickness obtained from FE-SEM cross-sectional image is the same as the value obtained from laser surface profilometer.
Thin film of thickness 440 nm exhibits a very smooth surface with uniform size and shape of CIS nanoparticles as obtained from FE-SEM. Bigger particles are formed at higher annealing temperature.

FE-SEM images show surface morphology of as-deposited and annealed films of thickness 660 nm. Particle size increases with crystallization at 500 °C.

The surface morphology from FE-SEM on as-deposited and annealed films of thickness 1000 nm. The particle size is greater with increasing annealing temperature and film thickness.

FE-SEM image shows the cross-sectional view of CIS film of thickness 440 nm deposited on silicon substrate. A highly denser film was obtained in as-deposited as thermally evaporated.

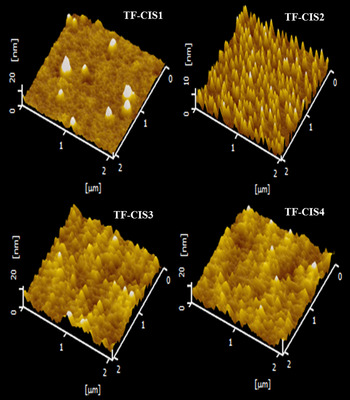
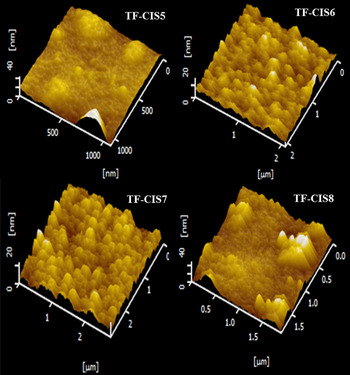
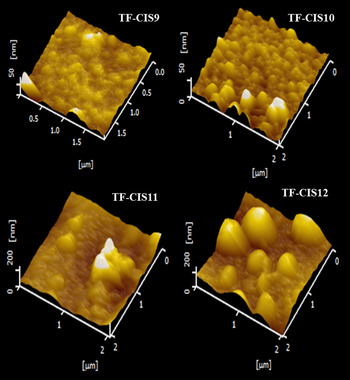
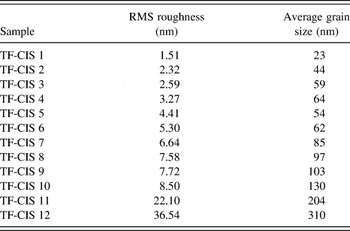
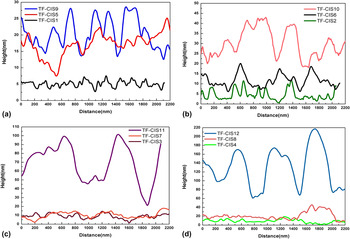
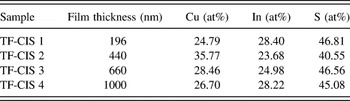
Surface topography of CuInS2 films was studied by AFM using tapping mode. Figures 8–10 show the 3D images of as-deposited and annealed films with four different thicknesses. The as-deposited CuInS2 films of thickness of 196, 440, 660, and 1000 nm are characterized by loosely bound isolated CuInS2 nanoparticles. These films are nothing but the quasi-amorphous phase of chalcopyrite crystal structure as it is corroborated by XRD. Isolated particles with a smaller size (23 nm) are observed in case of film thickness of 196 nm (Fig. 8). The as-deposited films are observed smooth in morphology and the particle size is exceedingly homogeneous, which increases from 1.5 to 3.3 nm with increasing film thickness from 196 to 1000 nm (Table IV). When these films were annealed at 200 °C (Fig. 9), the individual particles join together and form a closely packed continuous surface morphology as a result of an increasing surface volume fraction of CuInS2 nanoparticles with the increase of thermal energy. Particle size increases from 103 to 310 nm (Table IV) with increasing film thickness when annealed at 500 °C due to the crystallization process of CuInS2 phase (Fig. 10). However, annealing at higher temperature (500 °C) would not control the particle size and shape of nanoparticles in thicker film (1000 nm) (Fig. 11) because of an increasing surface roughness. Such films are observed with higher crystallinity from XRD. Figure 11 shows the rms roughness profile of as-deposited and annealed films with increasing film thickness. An increase in crystallinity leads to an increase in the particle size of the CuInS2 nanoparticles, which is merely responsible for the increase of rms roughness values. The rms roughness values increase with increasing film thickness and with increasing annealing temperature. The quantitative analysis of elemental composition in the as-deposited CuInS2 thin films was studied by EDX technique. Table V shows the presence of nominal composition of Cu, In, and S elements in atomic percentage. Even though there is a small disparity observed in the stoichiometry of the as-deposited films, the single phase formation of crystalline chalcopyrite structure is confirmed through XRD when these films are annealed at 500 °C.
Three-dimensional views of AFM images of as-deposited CuInS2 films with increasing film thickness of 196 nm (TF-CIS 1), 440 nm (TF-CIS 2), 660 nm (TF-CIS 3), and 1000 nm (TF-CIS 4). The topography of films is observed with very uniform surface and smaller particle size.

Three-dimensional views of AFM images of CuInS2 films annealed at 200 °C with increasing film thickness, 196 nm (TF-CIS 5), 440 nm (TF-CIS 6), 660 nm (TF-CIS 7), and 1000 nm (TF-CIS 8).

Three-dimensional views of AFM images of thermally evaporated CIS films, annealed at 500 °C with increasing film thickness, 196 nm (TF-CIS 9), 440 nm (TF-CIS 10), 660 nm (TF-CIS 11), and 1000 nm (TF-CIS 12). Surface roughness increased with increasing film thickness after annealing at 500 °C.

The list of average particle size and rms roughness of the unannealed and annealed CIS films of various thicknesses.

Surface roughness rms values (in nanometer) of as-deposited and annealed films of CuInS2 of thickness 196 nm, 440 nm, 660 nm, and 1000 nm plotted in (a), (b), (c), and (d), respectively (see Table I for the sample codes). The rms values increase with increasing film thickness, suggesting the increased particle size of CuInS2 phase.

Quantitative analysis of CIS films from EDAX measurements.

Raman spectra were recorded for the as-deposited films and for the films annealed at 200 and 500 °C as shown in Fig. 12. Raman mode was not observed in case of as-deposited films and the films annealed at 200 °C due to a very poor crystalline CuInS2 films. However, a strong Raman mode (A1) is observed at 302.9, 303.2, 303.5, and 304 in cm−1 after annealing at 500 °C for the thickness of films 196, 220, 660, and 1000 nm, respectively. A1 is found to be the characteristic signature of CuInS2 phase and the dominant Raman mode in device quality of CuInS2 phase. Reference Garcia, Ruzafa, Rodriguez, Rodriguez, Morante and Scheer31 A1 mode is attributed to totally symmetric vibration of anion (sulfur) sublattice, evidencing the formation of crystalline phase of CuInS2 nanoparticles at 500 °C. Intensity of the Raman mode increases with increasing film thickness. This is accompanied by a small symmetric shift to the higher wave number and broadening of A1 mode. The shift in Raman mode occurs due to increase in particle size, whereas broadening is closely related to the presence of structural defects or stress gradients in the scattering volume. A broad hump cantered at 250 cm−1 is nothing but the calculated E3 symmetry of phonon mode of CuInS2 chalcopyrite structure. Reference Koschel and Bettni32 No other modes are observed due to a very low scattering efficiency and its high absorption coefficient of the modest crystalline phase of CuInS2. Reference Ohrendorf and Haeuseler33,Reference Saad, Bleyhl, Ohashi, Hashimoto, Ito, Mertesacker, Jäger-Waldau, Woletz, Lux-Steiner and Schmid34
Raman spectra of thermally evaporated CuInS2 films annealed at 500 °C. Raman mode is not observed in as-deposited and annealed films (at 200 °C). However, crystalline films are favorable to exhibit a very strong Raman mode at 304 cm−1 for thicker film.

B. Optical transmittance, absorbance, and reflectivity
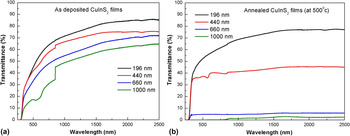
Optical properties of CuInS2 thin films are of great importance for their potential applications in the area of photovoltaic industry. Reference Gorska, Beaulieu, Loferski and Roessler35 Optical properties of ternary semiconductor nanocrystals are influenced by size, shape, and composition of the nanoparticles. Reference Zhong, Zhou, Ye, He, Ye, He, Yang and Li36 Figure 13 presents transmission spectra of the as-deposited and thermally annealed CIS films of various thicknesses. Sudden step at 850 nm is observed in few transmittance spectra due to lamp change in spectrophotometer. The as-deposited films show transmittance ranging from 50% to 85% with decreasing film thickness in the near-IR region and then gradually decreases on the way to visible region. UV light is completely absorbed by glass substrate below the wave length of 300 nm. Annealed films have less transmittance as compared to the as-deposited films due to good crystalline phase of chalcopyrite CuInS2. Thermal annealing at high temperature increases the particle size during the course of crystallization process as well. Transmittance of CIS films decreases with increasing film thickness because of an increase in concentration of CIS nanoparticles during thermal evaporation process. Gradual decrease in transmittance is observed due to the increase in optical absorption coefficient of CIS films. A broad dip at 600 nm in transmittance is attributed to absorption of crystalline CuInS2 phase. After annealing at 500 °C, the film with a thickness of 196 nm shows no significant difference in transmittance. However, above 440 nm, a massive drop in transmittance is observed, which could be attributed to the crystallization (highly oriented crystalline structure) of CIS nanoparticles.
Transmittance spectra of CuInS2 films (a) as-deposited and (b) annealed at 500 °C with varying film thickness. Transmittance decreases with increasing film thickness and annealing temperature.

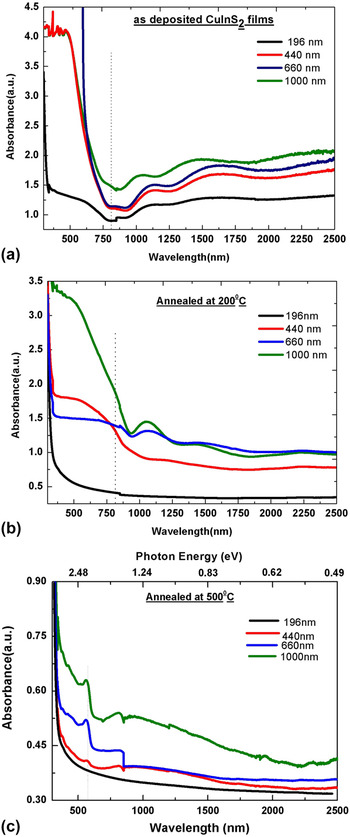
Figure 14 reveals optical absorbance spectra of the as-deposited and annealed (at 200 and 500 °C) films of CuInS2 with increasing film thickness. The standard value of the energy band gap of bulk CuInS2 crystals is 1.52 eV, which is approximately 810 nm in wave length. The as-deposited films exhibit a sharp fundamental absorption band edge at 770 nm, which seems to be blue shifted as compared to the value of bulk CIS crystals [Fig. 14(a)]. Film thickness of 196 nm shows a broad shoulder with a long trail in the longer wave length region covering the whole visible region, which could be attributed to a quasi-amorphous phase of CuInS2 structure. The topography of this film shows a very small size (23 nm) of CIS nanoparticles. A broad shoulder disappears above the film thickness of 440 nm; however, a sharp band edge is still observed with increasing film thickness suggesting increase of particle size from 44 to 64 nm.
Optical absorbance spectra of CuInS2 films (a) as-deposited, (b) annealed at 200 °C, and (c) annealed at 500 °C with varying film thickness. Quasi-crystalline to crystalline phase transition is revealed.

Absorption band edge is red shifted when CuInS2 films are annealed at 200 °C [Fig. 14(b)]. Crystallization process of CuInS2 phase is completed at temperature above 500 °C, which is confirmed by XRD [Fig. 2(b)]. The energy band gap calculation is very tricky below 500 °C due to the partial crystallization process. After annealing at 500 °C, interference pattern disappears in the IR region, while a broad absorption peak is observed in the visible region centered at 870 nm, extended up to the near-IR region. A broad absorption band in Fig. 14(c) confirms the formation of crystalline CuInS2 structure. A broad absorption from the as-deposited quasi-amorphous CIS film of thickness 196 nm disappears after thermal annealing. Thin film of thickness 196 nm annealed at 500 °C is a crystalline film having the particle size of 103 nm. Intensity of absorption increases with increasing film thickness because of the increasing concentration of CuInS2 nanoparticles. During crystallization process, the crystallite size increases from 57 to 234 nm with increasing annealing temperature up to 500 °C.
Based on the allowed direct interband transition, band gap (E g) was determined from Tauc plot by extrapolating the straight line of the (αhν)2 versus hν curve to the intercept of the horizontal photon energy axis. The intercept of the linear portion on energy axis at (αhν)2 equal to zero gives the band gap energy. Band gap is calculated for the as-deposited and annealed films, and the range varies between 1.43 and 1.64 eV, possibly attributed to p-type of CuInS2 semiconductor Reference Sun, Kazmerski and Clark37 could be used as an absorber layer in solar cells. The as-deposited CIS film shows a strong blue shift with the maximum energy band gap of 1.64 eV as compared to the bulk energy band gap (1.52 eV), which could possibly arise due to the presence of smaller size particles (74 nm). As the annealing temperature increases, the energy band gap of CIS films red shifted due to an increase in particle size or a decrease in quantum size effect. It is observed that the optical energy band gap CIS films decrease with both increasing film thickness and increasing annealing temperature. The energy band gap decreases from 1.64 to 1.43 eV when a transition occurs from quasi-amorphous to nanocrystalline phase. In the as-deposited CIS films, the Cu/In ratio is obtained from 0.87 to 1.51. However, the p-type conductivity is observed in CIS films for Cu/In ratio of 0.84–1.3. Reference Park, Chung, Kim, Park, Jeong, Kim, Gu and Lee38 The increase in band gap also happens due to an increase in Cu/In ratio and a decrease in particle size. Reference Todorov, Cordoncillo, Sanchez-Royo, Carda and Escribano39 In addition to optical absorption, an exciton band transition is observed at 2.04 eV for the annealed films at 500 °C [Fig. 14(c)], which indicates the presence of several intrabands Reference Castro, Bailey, Raffaelle, Banger and Hepp40 in the band structure of CIS. Intensity of exciton peak increases with increasing film thickness and also blue shifted with a considerable difference (0.69 eV), which could be attributed to first excitonic resonance in the quantum-confined particles. Reference Malyarevich, Yumashev, Posnov, Mikhailov, Gurin, Prokopenko, Alexeenko and Melnichenko22 Exciton peak is immensely significant in case of crystalline CIS films while it is missing in case of quasi-amorphous CIS films. The coexistence of optical absorption and excitons in an annealed crystalline CIS films is significantly attractive towards the area of photovoltaic cells.
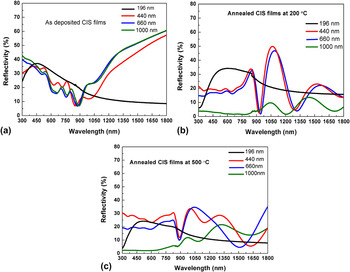
Figure 15 shows reflectance spectra of the as-deposited and annealed CuInS2 films of various thicknesses. Annealed films exhibit greater enhancement in reflectance as compared to deposited films, which is an indication of good crystallinity of CuInS2 structure. Reference Gurinovich, Gurin, Ivanov, Bodnar, Molochko and Solovei20 Reflectance diminished towards bulk energy band gap in the as-deposited films irrespective of the thickness of films. Annealing introduces a sharp peak near the energy band gap region followed by a sharp fall immediately at the band gap for film thicknesses of 440 and 660 nm. A sharp drop in reflectance close to the wave length of 900 nm is due to the strong absorption of CuInS2 in fairly thick films, whereas the least thickness of 196 nm film exhibiting a sluggish drop near the same wave length is due to the less absorption of light from CuInS2 film. Smaller-sized CuInS2 nanoparticles with elevated monodispersity increases surface area to volume ratio, which could be responsible for an enhancement of multi-reflectance peaks. An increase of particle size and the irregular shape of CuInS2 nanoparticles cause an extremely rough surface area where light is trapped almost utterly, evidenced by a dramatic decrease of reflectance observed when film thickness is increased to 1000 nm.
Reflectivity of CuInS2 films (a) as-deposited, (b) annealed at 200 °C, and (c) annealed at 500 °C with varying thickness.

IV. CONCLUSIONS
CuInS2 nanoparticles were synthesized by step-heating process in a high temperature furnace and then subsequently thin films were deposited with the film thickness ranging from 196 to 1000 nm by using thermal evaporation unit. The highly oriented chalcopyrite phase (a = 5.456 Å and c = 11.641 Å for the film thickness of 1000 Å) of CuInS2 thin films was characterized by XRD with the reflections (112), (204), and (312) after the crystallization temperature (500 °C) is reached. Tetragonal distortion (η) is found to be ≈1 confirming the arrangement of an extended double lattice structure. Thermally evaporated CuInS2 thin films eventually yield crystallite sizes ranging from 42 to 234 nm with increasing annealing temperature (from 200 to 500 °C) and film thickness (196–1000 nm), which could be due to Oswald ripening, agglomeration, and diffusion of Cu, In, and S atoms during the formation. Triangular shape of CIS nanoparticles was obtained by FE-SEM in an as-deposited amorphous-like film structure of thickness 196 nm. Crystallization process increases the surface roughness with increasing film thickness and annealing temperature, confirmed through AFM analysis. Raman studies exhibit A1 mode at 303 cm−1, which corresponds to symmetric vibration of anion sublattice of CuInS2 structure. Reflectance is diminished towards the bulk energy band gap region in amorphous films, whereas a sharp peak followed by a sharp fall at energy band gap in crystalline films, obtained due to strong absorption of CuInS2. Bulk energy band gap increases from 1.43 to 1.64 eV with increasing film thickness from 196 to 1000 nm and excitonic transition at 2.04 eV is observed in crystalline CIS films.
ACKNOWLEDGMENT
Authors thank the University Grant Commission, New Delhi for providing fund through Major Research Project (F. No.4151868/2012(SR)).