



1. Introduction
Particle-laden turbulent flows are ubiquitous in natural and industrial systems, including plastic transport in the ocean (Van Sebille Reference Van Sebille2020), cloud droplets (Grabowski & Wang Reference Grabowski and Wang2013), fluidised beds (Kolehmainen et al. Reference Kolehmainen, Ozel, Boyce and Sundaresan2016) and cyclone separators (Grimble et al. Reference Grimble, Agarwal and Juniper2017). However, particle motion in such flows is inherently complex because of turbulence–particle interactions, which depend strongly on various flow and particle characteristics (Balachandar & Eaton Reference Balachandar and Eaton2010). A key feature of inertial particles is that they do not passively follow fluid motion, leading to preferential sampling and clustering, even under homogeneous isotropic turbulence (Monchaux et al. Reference Monchaux, Bourgoin and Cartellier2012; Bec et al. Reference Bec, Gustavsson and Mehlig2024; Matsuda et al. Reference Matsuda, Yoshimatsu and Schneider2024; Huang et al. Reference Huang, Jie, Cui, Xu, Andersson and Zhao2025).
Direct numerical simulations and experiments have extensively characterised particle clustering in turbulent mixing layers, channel flows and homogeneous turbulence (Brown & Roshko Reference Brown and Roshko1974; Eaton & Fessler Reference Eaton and Fessler1994; Brandt & Coletti Reference Brandt and Coletti2022; Kriaa et al. Reference Kriaa, Favier and Le Bars2023; Gualtieri et al. Reference Gualtieri, Battista, Salvadore and Casciola2023; Matsuda et al. Reference Matsuda, Yoshimatsu and Schneider2024; Bhattacharjee et al. Reference Bhattacharjee, Tom, Carbone and Bragg2024; Chen et al. Reference Chen, Wang and Zheng2025). The interactions between turbulence and particles are the primary factors driving clustering. However, the inherent multiscale nature and strong stochasticity of turbulence make it challenging to isolate the fundamental mechanisms that drive clustering (Bec et al. Reference Bec, Biferale, Cencini, Lanotte, Musacchio and Toschi2007; Balachandar & Eaton Reference Balachandar and Eaton2010; Nath et al. Reference Nath, Roy, Ravichandran and Govindarajan2024). An effective alternative is to study vortex–particle interactions, because intense vortices are the building blocks of turbulent flows (Moffatt et al. Reference Moffatt, Kida and Ohkitani1994). Vortices can trap particles for long periods, with release typically occurring only upon vortex breakdown (Elhmaïdi et al. Reference Elhmaïdi, Provenzale and Babiano1993; Angilella Reference Angilella2010; Brocchini et al. Reference Brocchini, Marini, Falchi, Postacchini and Zitti2023). When particles have finite inertia, clustering is further promoted (Bec Reference Bec2003, Reference Bec2005), and in complex vortex systems or rotating backgrounds, particles can be captured within vortex cores (IJzermans & Hagmeijer Reference IJzermans and Hagmeijer2006; Ravichandran et al. Reference Ravichandran, Perlekar and Govindarajan2014; Kapoor et al. Reference Kapoor, Jaganathan and Govindarajan2024). Moreover, particle feedback can accelerate vortex dissipation and influence vortex stability, which in turn alters particle dynamics (Shuai & Kasbaoui Reference Shuai and Kasbaoui2022; Shuai et al. Reference Shuai, Dhas, Roy and Kasbaoui2022, Reference Shuai, Roy and Kasbaoui2024; Lee & Marcus Reference Lee and Marcus2025). Therefore, vortex–particle interactions provide a tractable framework to understand inertial particle clustering in turbulence.
Most prior studies on the vortex–particle interaction have focused on the effect of the vortex on particle dynamics within the one-way coupled regime, where particle feedback on the vortex flow is neglected because the particle volume fraction is sufficiently small. In this regime, vortical structures act as dynamic attractors for inertial particles, which is a key mechanism underlying clustering. For example, in a two-dimensional inviscid flow generated by line vortices, heavy particles can be permanently trapped at stable equilibrium points (Nizkaya et al. Reference Nizkaya, Angilella and Buès2010). Subsequent work examined the effects of gravity, viscosity and boundaries, revealing transient capture during viscous vortex roll-up (Angilella Reference Angilella2010; Angilella et al. Reference Angilella, Vilela and Motter2014). More complex attractors have also been identified: limit cycles near a Burgers vortex (Marcu et al. Reference Marcu, Meiburg and Newton1995), periodic attractors in a von Kármán vortex street (Burns et al. Reference Burns, Davis and Moore1999) and attracting inertial Lagrangian coherent structures (Sapsis & Haller Reference Sapsis and Haller2010). The effectiveness of vortical attractors in trapping particles is fundamentally governed by particle inertia characterised by the particle Stokes number
 ${\textit{St}} = \tau _p/T$
, where
 $T$
denotes the characteristic time of the flow and
 $\tau _p$
is the inertial response time of a particle to a modification of the flow in its vicinity. A universal feature is the existence of a trapping critical Stokes number
 ${\textit{St}}_{\textit{cr,t}}$
; beyond this number, stable trapping ceases and the dynamics transition to chaotic scattering (Marcu et al. Reference Marcu, Meiburg and Newton1995; Angilella Reference Angilella2010; Nizkaya et al. Reference Nizkaya, Angilella and Buès2010; Angilella et al. Reference Angilella, Vilela and Motter2014; Kapoor et al. Reference Kapoor, Jaganathan and Govindarajan2024; Kapoor et al. Reference Kapoor, Jaganathan and Govindarajan2024; Nath et al. Reference Nath, Roy, Ravichandran and Govindarajan2024). Moreover, this critical Stokes number depends on the particle-to-fluid density ratio
 $\beta$
(Raju & Meiburg Reference Raju and Meiburg1997; Kapoor et al. Reference Kapoor, Jaganathan and Govindarajan2024).
In some situations, particle feedback on the flow cannot be ignored, especially when the particle volume fraction is high enough (Elghobashi & Truesdell Reference Elghobashi and Truesdell1993; Elgobashi Reference Elgobashi2006; Brandt & Coletti Reference Brandt and Coletti2022). We argue that even under dilute conditions, particle clustering can locally increase the volume fraction, thereby amplifying particle feedback effects. Particle feedback can significantly modulate the structure of the suspended flow system. Heavy particles centrifugally expelled from the Lamb–Oseen vortex core form ring-shaped clusters and accelerate vortex decay by orders of magnitude (Shuai & Kasbaoui Reference Shuai and Kasbaoui2022). It can also induce new instabilities in originally stable vortices (Shuai et al. Reference Shuai, Dhas, Roy and Kasbaoui2022) and modulate vortex–wall interactions (Uchiyama & Shimada 2014, Reference Uchiyama and Shimada2016). Clearly, the modulation of the suspended vortical flow caused by particle feedback further alters the dynamics of the particles themselves. Only a few studies have examined particle dynamics with two-way coupling in vortex flows (Uchiyama & Shimada Reference Uchiyama and Shimada2014; Ku et al. Reference Ku, Li, Lin and Jin2019; Shuai & Kasbaoui Reference Shuai and Kasbaoui2022; Biswas & Govardhan Reference Biswas and Govardhan2025). In a two-dimensional single vortex, particle feedback causes particle aggregation to evolve into spiral-shaped concentric arms or filamentary structures (Druzhinin Reference Druzhinin1995; Shuai et al. Reference Shuai, Dhas, Roy and Kasbaoui2022). In particular, the effect of particle feedback on the vortical attractor itself remains largely unexplored. The primary objective of this study is to investigate the clustering dynamics of inertial particles in vortex flows, with a particular focus on the vortical attractor, while accounting for particle feedback within the two-way coupled regime.
Vortex pairs represent a canonical model for coherent vortical structures in shear-driven and turbulent flows (Legras et al. Reference Legras, Dritschel and Caillol2001; Brandt & Nomura Reference Brandt and Nomura2010; Leweke et al. Reference Leweke, Le Dizès and Williamson2016). The pairs provide a tractable yet physically relevant framework for studying inertial particle clustering dynamics in vortical flows. In corotating vortex pairs without gravity, heavy particles with Stokes numbers below a critical value,
 ${\textit{St}} \lt {\textit{St}}_{\textit{cr,t}}$
, are permanently captured by stable point attractors, whereas more complex dynamics, including limit cycles and transient chaotic scattering, emerge for particles with larger Stokes numbers (Angilella Reference Angilella2010; Nizkaya et al. Reference Nizkaya, Angilella and Buès2010; Kapoor et al. Reference Kapoor, Jaganathan and Govindarajan2024). In contrast, the dynamics of particles in counter-rotating vortex pairs (CVPs) exhibit a distinct organising feature: a stable attracting ring within the corotating frame governs particle motion. This attracting ring can trap particles to form a localised particle clustering ring (PCR), even in finite-density-ratio systems where point attractors cease to exist (Zhao et al. Reference Zhao, Guo, Zuo and Qian2024, Reference Zhao, Zuo and Qian2025). Despite these advances, previous studies on the dynamics of particle clustering within vortex pairs have focused predominantly on one-way coupling, without evaluating how particle feedback may alter the particle dynamics themselves.
In this study, we further examine the particle dynamics within a gravity-free CVP flow, accounting for particle feedback, as a representative problem to effectively understand the aforementioned issue. We focus specifically on a dilute, two-way coupled particle-laden CVP flow with a circulation ratio
 $\gamma = \varGamma _2/ \varGamma _1 \in (-1,0)$
and an initial particle volume fraction
 $\varPhi _{p,0}\lt 1.0\times 10^{-3}$
, where
 $\varGamma _2$
and
 $\varGamma _1$
are the circulations of the vortices within the CVP. Building upon the study by Zhao et al. (Reference Zhao, Guo, Zuo and Qian2024, Reference Zhao, Zuo and Qian2025), we systematically investigate the impact of particle feedback on the particle clustering represented by the PCR and the particle dynamics in the CVP. Even in the dilute regime, the localised clustering of particles can induce substantial feedback, ultimately affecting the dynamics of the particles themselves. We consider small, heavy, dilute inertial particles with the effective density ratio
 $R = 3/(2\beta +1) \lt 1$
, specifically focusing on particles with Stokes numbers in the range of
 ${\textit{St}} \in (0, 0.1)$
.
The remainder of this work is organised as follows. Section 2 provides an overview of the flow configuration for a particle-laden CVP, along with the associated governing equations and numerical methods. In this approach, the dilute two-way coupled particle-laden CVP flow is treated as an equivalent single-phase fluid with an effective density and a sufficiently small particle Stokes number. In § 3, an overview of inertial particle dynamics in the CVP considering particle feedback is presented. We identify a novel regime of particle dynamics in which localised particle clustering triggers leakage. In §§ 4 and 5, we discuss the particle dynamics associated with localised clustering and leakage, along with the corresponding mechanisms. Two critical Stokes numbers govern the particle dynamics. The critical trapping Stokes number
 ${\textit{St}}_{\textit{cr,t}}$
controls particle trapping to initially form the PCR, whereas the critical stability Stokes number
 ${\textit{St}}_{\textit{cr,s}}$
determines the stability of the PCR. As shown in
 ${\textit{St}}_{\textit{cr,s}} \lt St \lt {\textit{St}}_{\textit{cr,t}}$
, PCR initially occurs, but is followed by periodic temporal leakage of particles; this phenomenon is attributed to significant particle feedback effects induced by the PCR. Finally, a summary is provided in § 6.
Initial configuration of the unequal-strength particle-laden CVP flow. (
 $a$
) Schematic representation of the circular computational domain (not to scale) and the boundary condition set-up. Initially, particles are uniformly distributed with a constant volume fraction. The CVP exhibits differential circulation intensities, with
 $\varGamma _1\gt 0$
(counterclockwise rotation) and
 $\varGamma _2\lt 0$
(clockwise rotation) in the co-rotating reference frame, which has an angular velocity
 $\varOmega$
about the central point
 $I$
. (
 $b$
) Initial CVP flow in the absence of particles within the
 $\varOmega$
-rotating frame. Separatrix streamlines (bold curves) delineate three simply connected regions: the V1 core region (light red), the V2 core region (light blue) and the recirculation region (light grey). The separatrix streamline for the V2 core region is specifically marked with pink colour and denoted as
 $S_{\textit{max}}$
.

2. Flow configuration and numerical method
2.1. Configuration of the initial particle-laden CVP flow
We investigate the dynamics of dilute inertial particles in the two-way coupled regime within a two-dimensional unequal-strength CVP. The initial particle-laden flow configuration is depicted in figure 1, where particles with volume fractions of
 $\varPhi _{p,0} \leqslant 1.0\times 10^{-3}$
are uniformly distributed with initial velocities that match the local fluid velocity. The initial flow field is generated by two counter-rotating vortices, V1 (counterclockwise,
 $\varGamma _{1} \gt 0$
) and V2 (clockwise,
 $\varGamma _{2} \lt 0$
), and is characterised by a circulation ratio
 $\gamma = \varGamma _{2}/\varGamma _{1} \in (-1,0)$
. The system exhibits temporal evolution because of particle–fluid interactions, modifying the inherent vortex dynamics. Following the Biot–Savart law, the vortices undergo mutual rotation around a stationary point
 $I$
with an angular velocity of
 $\varOmega = (\varGamma _{1}+\varGamma _{2})/2\pi b^2$
, where
 $b$
denotes the initial intervortex separation distance (Leweke et al. Reference Leweke, Le Dizès and Williamson2016).
We employ a circular computational domain centred at point
 $I$
, with slip wall boundaries being positioned at a sufficient distance of
 $6b$
from point
 $I$
to minimise boundary effects (Zhao et al. Reference Zhao, Guo, Zuo and Qian2024). The reference frame then rotates around
 $I$
with an angular velocity of
 $\varOmega$
, where the initial vortex centres are located at
 $\boldsymbol{X}_{c1} = (b\gamma /(1+\gamma ),0)$
and
 $\boldsymbol{X}_{c2} = (-b/(1+\gamma ),0)$
, as illustrated in figure 1(a). Through non-dimensionalisation using characteristic scales
 $L=b$
,
 $T=1/\varOmega$
and
 $U=b/T$
, the initial vortical flow field in this rotating frame becomes
 \begin{align} \varPsi (\boldsymbol{X}) = \phi (\boldsymbol{X}-\boldsymbol{X}_{c1})+\gamma \phi (\boldsymbol{X}-\boldsymbol{X}_{c2})+2\left | \boldsymbol{X}\right |^2\!, \end{align}
where
 $\varPsi (\boldsymbol{X})$
is the stream function and
 $\boldsymbol{X}$
represents the position vector in the corotating reference frame. The fluid velocity field
 $\boldsymbol{u}_{\!f} = (u_{f,x},u_{f,y})$
is obtained from
 $\varPsi$
via
 $u_{f,x}=\partial \varPsi /\partial y$
and
 $u_{f,y}=\partial \varPsi /\partial x$
. The function
 $\phi (\boldsymbol{X}) = -\ln \left | \boldsymbol{X} \right |/(1+\gamma )$
represents the stream function of a line vortex of unit circulation and the term
 $2| \boldsymbol{X}|^2$
accounts for the rotation of the frame (Nizkaya et al. Reference Nizkaya, Angilella and Buès2010; Zhao et al. Reference Zhao, Guo, Zuo and Qian2024, Reference Zhao, Zuo and Qian2025). The CVP flow structure in the corotating frame reveals three distinct topological regions bounded by separatrix streamlines (bold curves), i.e. the V1 core region (light red), V2 core region (light blue) and recirculation region (light grey). These simply connected domains exhibit nested closed streamlines that demonstrate the hierarchical organisation of the vortical flow.
2.2. Governing equations
We employ equations of motion derived for gravity-free, dilute two-way coupled particle-laden flows following Druzhinin (Reference Druzhinin1995), as briefly described later. Given the initial particle volume fraction
 $\varPhi _{p,0} \leqslant 1.0\times 10^{-3}$
and flow Reynolds number
 $Re = UL/\nu \gg 1$
(where
 $\nu$
is the kinematic viscosity of the fluid), we neglect both interparticle collisions and viscous dissipation in the fluid momentum equation. The particles are modelled as heavy, rigid spheres with a radius
 $a \ll L$
, where
 $L$
denotes the characteristic flow length scale. At intermediate scales between
 $a$
and
 $L$
, the discrete particles can be treated as a continuous medium with a volume fraction
 $\varPhi _p = 4\pi a^3n/3$
, where
 $n$
represents the particle number density.
The characteristic scales (
 $L$
,
 $U$
and
 $T$
) defined previously are introduced and the conservation equations for the fluid phase are given by the volume-averaged equations (Jackson Reference Jackson2000), which in non-dimensional form read
 \begin{align} \frac {\partial \varPhi _p}{\partial \tau }- \boldsymbol{\nabla }\boldsymbol{\cdot }\left(1-\varPhi _p\right)\boldsymbol{u}_{\!f}&=0, \end{align}
 \begin{align} \left(1-\varPhi _p\right)\frac {\mathrm{D}\boldsymbol{u}_{\!f}}{\mathrm{D}\tau }&= - \boldsymbol{\nabla }p - \frac {\varPhi _p}{R} \boldsymbol{F}_{\!p}.\end{align}
The corresponding equations for the particulate phase are
 \begin{align} \frac {\mathrm{d}\boldsymbol{v}_p}{\mathrm{d}\tau }&=R \frac {\mathrm{D}\boldsymbol{u}_{\!f}}{\mathrm{D}\tau }+\frac {\boldsymbol{u}_{\!f}-\boldsymbol{v}_p}{St}, \\[-28pt] \nonumber \end{align}
 \begin{align} \frac {\partial \varPhi _p}{\partial \tau }+\boldsymbol{\nabla }\boldsymbol{\cdot }\varPhi _p\boldsymbol{v}_p&=0. \\[-12pt] \nonumber \end{align}
The notation used in (2.2)–(2.5) is as follows. Here,
 $\boldsymbol{v}_p$
represents the particle velocity. The variables
 $p$
and
 $\tau$
denote the pressure and non-dimensional time, respectively. The effective density factor of the particle
 $R=3/(2\beta +1)$
accounts for the effect of added mass; in this study, we consider
 $R \lt 1$
for the heavy particle. The parameter
 $\beta$
is defined as the ratio of the particle density
 $\rho _p$
to the fluid density
 $\rho _{\!f}$
. The particle Stokes number
 ${\textit{St}}$
, which indicates the particle inertia, is defined as
 ${\textit{St}}=\tau _p/T$
, where
 $\tau _p=a^2/3\nu R$
is the characteristic time of the particle.
Coupling between the fluid and particulate phases occurs at two levels. The first pathway for flow modulation involves a reduction in the volume available to the fluid because of the presence of particles. However, this effect, which is represented by the volume fraction of particles
 $\varPhi _p$
in the continuity and momentum equations (2.2)–(2.3), is negligible in the dilute regimes (Pakseresht & Apte Reference Pakseresht and Apte2019). The dominant pathway for flow modulation occurs through momentum exchange between these two phases, which is represented by the term
 $\varPhi _p \boldsymbol{F}_{\!p} /R$
in (2.3), where
 $\boldsymbol{F}_{\!p}$
is the force exerted by the fluid on the particles. In the case of small, rigid and heavy particles, the primary contribution to the force
 $\boldsymbol{F}_{\!p}$
is from the viscous Stokes drag term and the fluid stress gradient term, which includes the effect of added mass (Maxey & Riley Reference Maxey and Riley1983; Zhao et al. Reference Zhao, Zuo and Qian2025), as presented in (2.4). Faxén correction terms, which introduce spatial derivatives of the flow field to account for finite particle size effects, are excluded based on our assumption of small particle size. This simplification is further justified by operating within the dual limits of a low particle Reynolds number
 $Re_p = a|\boldsymbol{v}_p-\boldsymbol{u}_{\!f}|/\nu$
and a weak shear Reynolds number
 $Re_s = a^2|\boldsymbol{\nabla }\boldsymbol{u}_{\!f}|/\nu$
. These limits collectively suppress the lift forces induced by the Saffman and Magnus effects (Kapoor et al. Reference Kapoor, Jaganathan and Govindarajan2024). The historical Basset force is omitted, since the effect of the historical Basset force always appears at a higher order
 $O({\textit{St}}^{3/2})$
than the other forces obtained by an asymptotic scheme analysis that is valid for particles with small Stokes numbers in vortical flows (Lasheras & Tio Reference Lasheras and Tio1994).
In principle, the set of (2.2)–(2.5) can be analysed numerically. Here, the particle Stokes number
 ${\textit{St}}$
is constrained to be sufficiently small (
 ${\textit{St}} \ll 1$
), allowing us to further simplify these equations by employing useful analytical solutions. In this context, (2.4) is amenable to asymptotic treatment via singular perturbation theory. The fast variables
 $\boldsymbol{v}_p$
vary rapidly at speeds of
 $O(1/St)$
. We can define a new time scale
 $\tau '=\tau /St$
in terms of the small perturbation parameter, thereby transforming the original problem into a regular perturbation problem. Given that the initial particle velocity is equal to the fluid velocity at the particle location, we can solve the regular perturbation problem detailed in the previous kinematic framework (Zhao et al. Reference Zhao, Guo, Zuo and Qian2024). The resultant particle velocity can be expressed as
 \begin{align} \boldsymbol{v}_p=\boldsymbol{u}_{\!f}+\textit{St}(R-1) \frac {\mathrm{D} \boldsymbol{u}_{\!f}}{\mathrm{D} \tau }, \end{align}
where the second term on the right-hand side of the equation is the perturbed particle velocity, indicating the influence of particle inertia. The non-uniform dispersion of the particle in the fluid flow originates from the perturbed particle velocity. When
 ${\textit{St}}=0$
, the particle strictly follows Lagrangian streamlines and disperses as fluid elements. Consequently, the divergence of the particle velocity is
 $\boldsymbol{\nabla }\boldsymbol{\cdot }\boldsymbol{v}_p=0$
, thereby preserving the initial particle volume fraction.
By substituting the solution from (2.6) for the particle velocity into (2.3) and (2.4), we can derive the following simplified equations for dilute, two-way coupled, particle-laden flows while neglecting the effect of the particle volume fraction on the continuity and momentum equations of the fluid (Druzhinin Reference Druzhinin1995; Pakseresht & Apte Reference Pakseresht and Apte2019):
 \begin{align} \boldsymbol{\nabla }\boldsymbol{\cdot }\boldsymbol{u}_{\!f}&=0, \\[-28pt] \nonumber \end{align}
 \begin{align} (\rho _{\textit{eff}})\frac {\mathrm{D}\boldsymbol{u}_{\!f}}{\mathrm{D}\tau }&= -\boldsymbol{\nabla }p , \\[-28pt] \nonumber \end{align}
 \begin{align} \frac {\partial \varPhi _p}{\partial \tau }+\boldsymbol{\nabla }\boldsymbol{\cdot }\varPhi _p\boldsymbol{v}_p&=0. \\[-12pt] \nonumber \end{align}
As shown in the above-mentioned simplified equations, the dilute two-way coupled particle-laden flow with a very small Stokes number is equivalent to that of a single-phase fluid with an effective density of
 $\rho _{\textit{eff}} = (1+\varPhi _p/R)$
. This effective density introduces a form of pseudocompressibility – a kinematic effect arising solely from the spatial variation of the particle volume fraction
 $\varPhi _p$
– despite the carrier fluid itself being incompressible (Shuai et al. Reference Shuai, Roy and Kasbaoui2024). Unlike true thermodynamic compressibility, this pseudocompressibility does not involve pressure–density coupling; it reflects that the effective density
 $\rho _{\textit{eff}}$
varies spatially due to the non-uniform particle distribution. Spatial variations in the particle volume fraction
 $\boldsymbol{\nabla }\varPhi _p$
create gradients in the effective density
 $\boldsymbol{\nabla }\rho _{\textit{eff}}$
. Through the two-way coupling term, these gradients can drive fluid from regions of high particle volume fraction to those of low particle volume fraction or, conversely, alter the inertia of existing flows, thereby modifying the fluid flow (Eaton & Fessler Reference Eaton and Fessler1994; Capecelatro et al. Reference Capecelatro, Desjardins and Fox2018).
2.3. Numerical set-up and parameters
Based on the governing equations (2.1) and (2.6)–(2.9), the two-way coupled particle-laden CVP flow is characterised by non-dimensional parameters such as
 $\gamma$
,
 $R$
,
 ${\textit{St}}$
and
 $\varPhi _p$
. Table 1 provides a summary of these parameters for the cases considered in the main content of the present study. The reference case considers one-way coupling. Cases A–C represent the two-way coupled particle-laden CVP flow, where variations in the parameters, including
 ${\textit{St}}$
and
 $\varPhi _p$
, are particularly examined. The circulation ratio
 $\gamma$
that determines the initial CVP flow is set to
 $-0.2$
. The values of the other parameters that define the characteristics of the particles are selected to strictly meet the aforementioned requirements. Three initial volume fractions
 $\varPhi _{p,0} = 1.0\times 10^{-3}$
,
 $5.0\times 10^{-4}$
and
 $5.0\times 10^{-5}$
are considered, corresponding to the dilute regime. The specific particle density factor
 $R=0.2$
represents particles with finite densities, such as steel particles in water flows. Furthermore, the particle Stokes number
 ${\textit{St}}$
is strictly constrained to the range
 ${\textit{St}}\in (0,0.1)$
with fixed increments
 $\Delta St = 0.01$
, where the accuracy of the simplified governing equations (2.6)–(2.9) developed with the assumption that a small
 ${\textit{St}}$
is validated, as discussed in Appendix A.
Non-dimensional parameters considered in the simulations within the main content of the present study. The reference case corresponds to one-way coupled particle-laden CVP flow. Cases A–C consider the two-way coupled particle-laden CVP flow, in which the initial particle volume fraction
 $\varPhi _{p,0}$
and Stokes number
 ${\textit{St}}$
vary. Three initial volume fractions are considered, all of which correspond to the dilute regime. Moreover, the particle Stokes number
 ${\textit{St}}$
is constrained to the range
 $(0,0.1)$
with fixed increments
 $\Delta St = 0.01$
.

Table 1. Long description
A table comparing non-dimensional parameters for different simulation cases. The table has five rows and five columns. The columns are labeled Case, γ, R, Φp,0, and St. The rows are labeled A, B, C, and Reference. Row A: γ is negative 0.2, R is 0.2, Φp,0 is 1.0 times 10 to the power of negative 3, St is (0, 0.1). Row B: γ is negative 0.2, R is 0.2, Φp,0 is 5.0 times 10 to the power of negative 4, St is (0, 0.1). Row C: γ is negative 0.2, R is 0.2, Φp,0 is 5.0 times 10 to the power of negative 5, St is (0, 0.1). Reference: γ is negative 0.2, R is 0.2, Φp,0 is 1.0 times 10 to the power of negative 3, St is (0, 0.1).
Equations (2.6)–(2.9) governing the particle-laden CVP flow are discretised and solved using the finite-volume method (FVM) solver OpenFOAM 8. For temporal discretisation, the backwards scheme is employed, whereas linear interpolation is used for the spatial discretisation of scalar fields. Additionally, the linear-upwind stabilisation transport (LUST) scheme is applied to vector fields. These methods ensure second-order accuracy. The pressure-implicit splitting of operators (PISO) algorithm is employed to solve the coupled pressure and velocity fields. A structured mesh is used to discretise the circular computational domain. To achieve a high spatial resolution in the core region of the CVP, we use a mesh size of
 $4000\times 1000$
in the tangential and radial directions, yielding a ratio of
 $b/\Delta x \approx 167$
, where
 $\Delta x$
is the minimum length of the mesh element. Moreover, a fixed time step of
 $\Delta \tau = 1.0\times 10^{-4}$
is adopted and the corresponding maximum Courant number (Co
 $= \boldsymbol{u}_{\!f}\Delta \tau / \Delta x$
) is approximately 0.5. The independence of the mesh size and time step has been validated. A specific example of a dependence analysis for particles with
 ${\textit{St}}=0.005$
and 0.025 in Case A is presented in Appendix A.
3. Overview of the particle dynamics in CVP
Our analysis begins by examining particle dynamics, specifically the trapping and leakage within the CVP flow. In the present study, the particles are modelled as a continuous phase characterised by a volume fraction,
 $\varPhi _p$
, the evolution of which can describe the particle dynamics.
The reference case considers a one-way coupled particle-laden CVP flow, where the feedback of the particle on fluid flow is neglected. Hereafter, the CVP flow in the corotating frame is steady. As detailed in Appendix B and identical with Zhao et al. (Reference Zhao, Zuo and Qian2025), a stable, localised ring-shaped particle clustering region (PCR) forms within the core region of the V2 vortex when the particle Stokes number
 ${\textit{St}}$
is below a trapping critical value
 ${\textit{St}}_{\textit{cr,t}}$
due to the influence of a particle-attracting ring within the CVP flow. The particle-attracting ring corresponds to a unique closed streamline
 $S_0$
that satisfies
 $I(S_0)=0$
,
 $I(S_0^+)\gt 0$
and
 $I(S_0^-)\lt 0$
. Here, the index
 $I(S)=\mathrm{d}(V_p(S))/\mathrm{d}\tau = \int _{\operatorname {int}(S)} \boldsymbol{\nabla }\boldsymbol{\cdot }\boldsymbol{v}_p \,\mathrm{d} V$
represents the rate of change in the particulate phase space volume
 $(V_p)$
bounded by the closed streamline
 $S$
.
For representative Case A, which includes two-way coupling (i.e. particle feedback effects to the flow), figures 2 and 3 compare the particle dynamics across different Stokes numbers
 ${\textit{St}}=0.025$
and 0.005, which are lower than the corresponding trapping critical value
 ${\textit{St}}_{\textit{cr,t}}=0.07893\pm 1\times 10^{-5}$
. Noted that the value of the trapping critical Stokes number
 ${\textit{St}}_{\textit{cr,t}}$
has been indicated in previous studies (Zhao et al. Reference Zhao, Guo, Zuo and Qian2024, Reference Zhao, Zuo and Qian2025). The value of
 ${\textit{St}}_{\textit{cr,t}}$
depends on the overall flow characteristics of the CVP, which is determined by the circulation ratio
 $\gamma$
and particle effective density factor
 $R$
. In the dilute regime, the value of
 ${\textit{St}}_{\textit{cr,t}}$
is similar under both one-way and two-way coupling cases. While initial particle trapping in the CVP occurs similarly to that in the reference case (figure 18
 $a$
), the subsequent clustering behaviour diverges into distinct regimes on the basis of the particle Stokes number
 ${\textit{St}}$
when particle feedback on flows is considered, even in the dilute regime. At
 ${\textit{St}}=0.025$
, a new temporal clustering behaviour is observed. A PCR forms temporarily, but is followed by significant particle leakage, a departure from the stable trapping observed in the reference case (figure 18
 $a$
). This leakage is periodic and characterised by particles accumulating in the tail region of the V2 vortex before ejection from the PCR (as detailed in later sections). In contrast, in the low-
 ${\textit{St}}$
regime (
 ${\textit{St}}=0.005$
), particles become trapped and form a stable PCR over time, similar to the reference case, as shown in figure 3.
Evolution of the distribution of the particle volume fraction
 $\varPhi _p$
for Case A with a particle Stokes number
 ${\textit{St}} = 0.025$
. The particle dynamics show two distinct stages: (
 $a$
) initially, the particles are trapped to form the PCR with the effect of the particle-attracting ring, as discussed in Appendix B; (
 $b$
) subsequently, the particles periodically escape the PCR, which is clearly presented in supplementary movie 1 available at https://doi.org/10.1017/jfm.2026.11988. Note that this figure presents only the central region
 $r\leqslant 2$
of the computational domain for clarity. This region encompasses the core areas of the V1 and V2 vortices, where particle clustering and leakage phenomena occur. TR denotes the tail region of the V2 vortex.

Evolution of the distribution of the particle volume fraction
 $\varPhi _p$
for Case A with a particle Stokes number
 ${\textit{St}} = 0.005$
. At this lower particle Stokes number, compared with that in figure 2, the particles become trapped and can form a stable PCR without particle leakage over time in the CVP flow, represented by an annular high particle volume fraction region.

The above-mentioned analysis yields new insights into the critical Stokes number threshold for particle trapping and the formation of a stable PCR in two-way coupled particle-laden CVP flow. Zhao et al. (Reference Zhao, Zuo and Qian2025), the trapping critical Stokes number
 ${\textit{St}}_{\textit{cr,t}}$
was identified for particle trapping in one-way coupled flows, where
 ${\textit{St}} \lt {\textit{St}}_{\textit{cr,t}}$
guarantees permanent trapping and a stable PCR. However, in the two-way coupled regime with
 ${\textit{St}}\lt {\textit{St}}_{\textit{cr,t}}$
, a PCR forms but remains stable only if the particle Stokes number is much lower than
 ${\textit{St}}_{\textit{cr,t}}$
. This finding indicates a new, lower threshold, denoted as the stability critical Stokes number,
 ${\textit{St}}_{\textit{cr,s}}$
, for stable PCR formation without particle leakage under two-way coupling. Table 2 presents the values of the critical Stokes number for particle dynamics in the coupled CVP flow, including the trapping threshold
 ${\textit{St}}_{\textit{cr,t}}$
and the new stability threshold
 ${\textit{St}}_{\textit{cr,s}}$
across different Cases A–C, where the primary distinction lies in the initial particle volume fraction
 $\varPhi _{p,0}$
. With the particle feedback to the flow, a stable PCR forms only when
 ${\textit{St}} \lt {\textit{St}}_{\textit{cr,s}}$
. For
 ${\textit{St}}_{\textit{cr,s}} \lt St \lt {\textit{St}}_{\textit{cr,t}}$
, a PCR forms within a finite time and particle leakage subsequently occurs.
Critical Stokes numbers for particle dynamics in the CVP flow, including the trapping threshold
 ${\textit{St}}_{\textit{cr,t}}$
and the new stability threshold
 ${\textit{St}}_{\textit{cr,s}}$
across different cases. The value of
 ${\textit{St}}_{\textit{cr,t}}$
depends on the circulation ratio
 $\gamma$
and particle effective density factor
 $R$
(Zhao et al. Reference Zhao, Zuo and Qian2025). For cases A–C in the dilute regime, and the reference with the same
 $\gamma$
and
 $R$
, the value of
 ${\textit{St}}_{\textit{cr,t}}$
is the same. For
 ${\textit{St}}_{\textit{cr,s}} \lt St \lt {\textit{St}}_{\textit{cr,t}}$
, a PCR forms within a finite time, but is followed by subsequent particle leakage. Only when
 ${\textit{St}}\lt {\textit{St}}_{\textit{cr,s}}$
can the PCR remain stable over time. To determine
 ${\textit{St}}_{\textit{cr,s}}$
, a finer increment
 $\Delta St=0.005$
is used near the transition regions in this study.

Table 2. Long description
A table comparing critical Stokes numbers for particle dynamics in different cases. The table has four rows and four columns. The columns are labeled Case A, Case B, Case C, and Reference case. The rows are labeled Stability threshold, St_cr,s and Trapping threshold, St_cr,t. Row 1: Case A, 0.0075 ± 0.0025; Case B, 0.020 ± 0.0025; Case C, 0.060 ± 0.0025; Reference case, 0.07893. Row 2: Case A, 0.07893; Case B, 0.07893; Case C, 0.07893; Reference case, 0.07893.
Actually, the existence of
 ${\textit{St}}_{\textit{cr,s}}$
can be explained by considering the competition between particle clustering and particle feedback that leads to leakage, as detailed in the following sections. During the initial clustering stage, particles accumulate in the PCR, increasing the local particle volume fraction. The peak value of the particle volume fraction within the PCR scales as
 $\varPhi _{p,\textit{max}}^*/\varPhi _{p,0}\sim St$
, as indicated in (4.1). This PCR generates a positive vorticity ring (PVR) via the baroclinic source term, with a magnitude proportional to (
 $\varPhi _{p,\textit{max}}^*/R$
). Leakage occurs when this induced vorticity perturbs
 $S_{\textit{max}}$
and
 $S_0$
sufficiently to release particles. This condition translates into a critical value of
 $\varPhi _{p,\textit{max}}^*$
and, consequently, a critical Stokes number
 ${\textit{St}}_{\textit{cr,s}}$
. Using the linear scaling
 $\varPhi _{p,\textit{max}}^* \propto St$
(see (4.1) and figure 5
 $a$
), we obtain the approximate proportionality
 ${\textit{St}}_{\textit{cr,s}}\sim (R/\varPhi _{p,0})$
. This scaling is consistent with numerical observations. The critical Stokes number
 ${\textit{St}}_{\textit{cr,s}}$
decreases significantly as
 $\varPhi _{p,0}$
increases (Cases A–C in table 2) and as the
 $R$
decreases (Appendix D). It can be inferred that when
 $\varPhi _{p,0}$
is negligible and
 $R=1$
, the particle feedback effect vanishes and
 ${\textit{St}}_{\textit{cr,s}}$
converges to
 ${\textit{St}}_{\textit{cr,t}}$
.
Temporal evolution of the normalised maximum particle volume fraction,
 $\varPhi _{p,\textit{max}}/\varPhi _{p,0}$
, within the PCR when the particle Stokes number is
 ${\textit{St}}\lt {\textit{St}}_{\textit{cr,t}}$
in different cases. (
 $a$
,
 $b$
) Cases A and the reference case with the same initial particle volume fraction
 $\varPhi _{p,0}=1\times 10^{-3}$
. (
 $c$
,
 $d$
) Cases B and C for different
 $\varPhi _{p,0}$
. For
 ${\textit{St}} \lt {\textit{St}}_{\textit{cr,s}}$
, a stable PCR forms and
 $\varPhi _{p,\textit{max}}$
remains unchanged after peaking. With respect to
 ${\textit{St}}_{\textit{cr,s}}\lt St\lt {\textit{St}}_{\textit{cr,t}}$
,
 $\varPhi _{p,\textit{max}}$
tends to decrease after it reaches its maximum value.

Figure 4. Long description
Panel A: A line graph shows the temporal evolution of the normalized maximum particle volume fraction for Case A and a reference case, both with a Stokes number of 0.005. The x-axis represents time (τ) and the y-axis represents the normalized maximum particle volume fraction (Φp,max/Φp,0). The graph includes a zoomed-in inset highlighting the region around τ* where the values stabilize. Panel B: Another line graph depicts the temporal evolution for Case A and the reference case, both with a Stokes number of 0.025. The x-axis represents time (τ) and the y-axis represents the normalized maximum particle volume fraction (Φp,max/Φp,0). The graph shows a peak followed by a decrease for Case A. Panel C: A line graph illustrates the temporal evolution for Cases B and C, both with a Stokes number of 0.005. The x-axis represents time (τ) and the y-axis represents the normalized maximum particle volume fraction (Φp,max/Φp,0). The graph includes a zoomed-in inset highlighting the region around τ* where the values stabilize. Panel D: Another line graph shows the temporal evolution for Cases B and C, both with a Stokes number of 0.025. The x-axis represents time (τ) and the y-axis represents the normalized maximum particle volume fraction (Φp,max/Φp,0). The graph shows a peak followed by a decrease for Case B.
4. Localised particle clustering
The results in figures 2 and 3 demonstrate that particles with Stokes numbers below the trapping critical threshold (
 ${\textit{St}} \lt {\textit{St}}_{\textit{cr,t}}$
) are initially trapped, forming localised particle clustering represented as a PCR. To quantify this particle clustering, we analyse the temporal evolution of the maximum particle volume fraction,
 $\varPhi _{p,\textit{max}}$
, within the V2 core region bounded by the separatrix
 $S_{\textit{max}}$
. This region contains the unique PCR; therefore,
 $\varPhi _{p,\textit{max}}$
directly represents the peak concentration within the PCR.
The normalised values of
 $\varPhi _{p,\textit{max}}$
for various particle Stokes numbers across different cases are shown in figure 4. The volume fraction
 $\varPhi _{p,\textit{max}}$
increases monotonically until it reaches a peak value
 $\varPhi _{p,\textit{max}}^*$
at time instant
 $\tau = \tau ^*$
for all the cases. Here,
 $\tau ^*$
is defined as the time at which
 $\varPhi _{p,\textit{max}}$
attains its global maximum
 $\varPhi _{p,\textit{max}}^*$
; this value is determined directly from the temporal evolution data without any arbitrary threshold. Notably,
 $\varPhi _{p,\textit{max}}^*$
can exceed
 $\varPhi _{p,0}$
by more than one order of magnitude. This finding indicates that even in the initially dilute regimes, localised particle clustering can significantly increase the local particle volume fraction, potentially leading to substantial particle feedback on the carrier fluid. This possibility is further supported by the results shown in figures 4(b) and 4(d). For Cases A and B with
 ${\textit{St}}_{\textit{cr,s}} \lt St \lt {\textit{St}}_{\textit{cr,t}}$
,
 $\varPhi _{p,\textit{max}}$
decreases after reaching its maximum rather than remaining stable as in the reference case when
 $\tau \gt \tau ^*$
.
Prior to the peak clustering time
 $\tau ^*$
, the influence of particle feedback on the particle clustering process is negligible, as evidenced by the nearly identical evolution of
 $\varPhi _{p,\textit{max}}$
in the two-way coupled Case A and the reference case (figures 4
 $a$
and 4
 $b$
). We should note that characterising clustering solely by
 $\varPhi _{p,\textit{max}}$
is a simplified proxy; more detailed measures (e.g. pair correlation functions or fractal dimensions) could be used in future work. Nevertheless,
 $\varPhi _{p,\textit{max}}$
directly captures the local concentration increase that drives particle feedback, making it suitable for the present analysis. As shown in figures 4(c) and 4(d), the time evolution of
 $\varPhi _{p,\textit{max}}$
(normalised by the initial particle volume fraction
 $\varPhi _{p,0}$
) is independent of the initial volume fraction at
 $\tau \lt \tau ^*$
. In particular, the normalised peak value
 $\varPhi _{p,\textit{max}}^*/\varPhi _{p,0}$
is constant for a given Stokes number, implying that
 $\varPhi _{p,\textit{max}}^*$
scales linearly with the initial volume fraction
 $\varPhi _{p,0}$
. Moreover, the peak time
 $\tau ^*$
is also independent of
 $\varPhi _{p,0}$
. The Stokes number is the primary determinant of clustering behaviour. As the particle Stokes number increases, the clustering process accelerates and the maximum particle volume fraction correspondingly increases. In figure 5, we further present the peak value of the maximum particle volume fraction,
 $\varPhi _{p,\textit{max}}^*$
, normalised by the initial particle volume fraction
 $\varPhi _{p,0}$
and the corresponding time instant
 $\tau ^*$
versus different particle Stokes numbers
 ${\textit{St}}$
for different cases. Both the normalised maximum particle volume fraction and the time required to reach this maximum value remain identical at same
 ${\textit{St}}$
values, reinforcing the negligible effects of particle feedback on initial particle clustering behaviours. Furthermore, as shown in figure 5(a), the dashed regression line, with a coefficient of determination
 $\mathcal{R}^2\gt 0.98$
, reveals a proportional relationship between the normalised
 $\varPhi _{p,\textit{max}}^*$
and the particle Stokes number
 ${\textit{St}}$
. This phenomenon is readily described by the linear fit given in (4.1) with a slope of
 $195$
:
 \begin{align} \frac {\varPhi _{p,\textit{max}}^*}{\varPhi _{p,0}} = 195 \textit{St}+8.0. \end{align}
Normalised peak value of the maximum particle volume fraction within the PCR,
 $\varPhi _{p,\textit{max}}^*/\varPhi _{p,0}$
, and the corresponding time instant
 $\tau ^*$
versus different particle Stokes numbers for different cases. (
 $a$
) The normalised peak particle volume fraction increases linearly with increasing particle Stokes number with a slope of
 $195$
. (
 $b$
) Time instant
 $\tau ^*$
decreases rapidly with increasing
 ${\textit{St}}$
with a power-law relationship.

Previously, Zhao et al. (Reference Zhao, Zuo and Qian2025) examined the basin of attraction (BOA) associated with particle clustering at various particle Stokes numbers. The scholars concluded that as the Stokes number increases, the BOA area decreases, indicating that few particles become trapped. This conclusion does not contradict our current results. With increasing Stokes number, particle dispersion intensifies because of the increase in the perturbed particle velocity, as indicated in (2.6). This suggests that, although fewer particles are trapped at higher Stokes numbers, the clustering that does occur is more concentrated, resulting in a higher peak volume fraction. This interpretation is consistent with the observed trends as illustrated in figure 5(a). Additionally, increased particle inertia accelerates clustering, as illustrated in figure 5(b), where
 $\tau ^*$
decreases rapidly with increasing Stokes number. This power-law relationship between
 $\tau ^*$
and
 ${\textit{St}}$
is described by (4.2) with
 $\mathcal{R}^2\gt 0.99$
:
 \begin{align} \tau ^* = 0.28{\textit{St}}^{-1.1}. \end{align}
5. Particle leakage triggered by clustering with particle feedback
As mentioned, we unequivocally demonstrate the existence of a new particle–CVP interaction regime in the parameter range of the present study: when the particle Stokes number is
 ${\textit{St}}_{\textit{cr,s}}\lt St\lt {\textit{St}}_{\textit{cr,t}}$
, particle clustering occurs and a PCR forms within a finite time, but subsequent particle leakage occurs. Localised particle clustering significantly increases the local particle volume fraction, ultimately leading to substantial particle feedback on the carrier fluid and triggering particle leakage. In this section, we further illustrate the characteristics of the particle leakage triggered by clustering and reveal the corresponding potential mechanism.
5.1. Evolution of particle leakage
In the stage of particle leakage, particles depart from the PCR within the V2 core region (enclosed by the separatrix streamline
 $S_{\textit{max}}$
), which consequently leads to a decrease in the particle volume within this region. Here, we define the total particle volume
 $\xi _{\textit{total }}$
, given as (5.1), to quantify the particle leakage process:
 \begin{align} \xi _{\textit{total }}=\int _{{V}_2} \varPhi _p \mathrm{\,d}V, \end{align}
where
 $V_2$
denotes the core region of the V2 vortex enclosed by the separatrix streamline
 $S_{\textit{max}}$
(see figure 1). The volume element
 $\mathrm{\,d}V$
is equivalent to an area element in two dimensions in this study. The value of
 $\xi _{\textit{total }}$
is proportional to the total number of particles in that region.
The overall evolution of the total particle volume,
 $\xi _{\textit{total }}$
, in Cases A and B with varying particle Stokes numbers,
 ${\textit{St}}\in ({\textit{St}}_{\textit{cr,s}},{\textit{St}}_{\textit{cr,t}})$
, is presented in figure 6. Here, the value of
 $\xi _{\textit{total }}$
is normalised by its initial value,
 $\xi _{\textit{total },0}$
. The time instant
 $\tau =\tau ^*$
corresponds to the moment when the maximum volume fraction,
 $\varPhi _{p,\textit{max}}$
, within the PCR reaches its peak value,
 $\varPhi _{p,\textit{max}}^*$
. For simplicity, the results for Case C are not presented; the particle leakage patterns are fundamentally similar with those illustrated in figure 6. When
 $\tau =\tau *$
, the normalised total particle volume even exceeds 1, as some particles from the V1 core region are attracted and trapped to form PCR, in addition to those from the V2 core region (Zhao et al. Reference Zhao, Zuo and Qian2025). Owing to particle leakage from the PCR, the total particle volume
 $\xi _{\textit{total }}$
gradually decreases, with the rate of decrease decelerating over time. At a later time, the PCR is in a quasisteady state, as the particle leakage rate is almost equal to zero. In each case, the initial particle volume fraction is fixed and the rate of decrease in
 $\xi _{\textit{total }}$
increases with increasing particle Stokes number. This finding indicates that particles with greater inertia escape the PCR rapidly. Moreover, the initial particle volume fraction significantly influences the particle leakage behaviour: as the initial particle volume fraction decreases from Case A to B, the leakage of particles with the same Stokes number decelerates.
Overall evolution of the total particle volume
 $\xi _{\textit{total }}$
in the V2 core region for Cases A and B with particle Stokes numbers
 ${\textit{St}}=0.025$
and
 $0.045$
. The value of
 $\xi _{\textit{total }}$
is normalised by the initial total particle volume,
 $\xi _{\textit{total },0}$
. The total particle volume in the V2 core region tends to decrease, with the rate of decrease slowing over time. The decreasing rate of
 $\xi _{\textit{total }}$
increases with increasing particle Stokes number and initial particle volume fraction.

Process of periodic particle leakage for Case A with a particle Stokes number
 ${\textit{St}}=0.045$
. (
 $a$
) Evolution of the total particle volume,
 $\xi _{\textit{total }}$
, with a high temporal resolution over two short time periods
 $(\tau -\tau ^*) \in (0,5.5)$
and
 $(15,21)$
. The decrease in
 $\xi _{\textit{total }}$
over time exhibits a distinct periodic pattern with a time interval
 $T^*$
. The red points indicate the starting times of each particle leakage period. (
 $b$
) Distribution of the particle volume fraction,
 $\varPhi _p$
, at time points
 $\tau _1$
,
 $\tau _2$
and
 $\tau _3$
within a particle leakage period, as marked in panel (
 $a$
). At time instant
 $\tau _1$
, corresponding to the onset of the particle leakage period, the PCR nearly coincides with the separatrix streamline for the V2 core region (denoted as
 $S_{\textit{max}}$
). Some particles have crossed the separatrix streamline and escaped the V2 core region at
 $\tau _2$
(marked by the dashed blue ellipse). Moreover, at time instant
 $\tau _3$
, the potential trajectories of the particles are depicted on the basis of the current flow field, revealing distinct movement patterns for the particles inside and outside the V2 core region.

Particle leakage from the PCR over time results in an overall decline in the total particle volume; however, the leakage process is not continuous. In figure 7, we further present the evolution of
 $\xi _{\textit{total }}$
, along with the corresponding distribution of the particle volume fraction,
 $\varPhi _{p}$
, over time. This characteristic is shown with higher temporal resolution during two short time periods for Case A with a particle Stokes number
 ${\textit{St}}=0.045$
. The total particle volume,
 $\xi _{\textit{total }}$
, decreases periodically over time, as illustrated in figure 7(a). Particles escape significantly from the PCR at regular time intervals, as indicated by the intermediate red circles in figure 7(a), which represent the onset of each particle leakage period. Within each period,
 $\xi _{\textit{total }}$
rapidly decreases and then stabilises. The time interval between successive particle leakage periods, denoted as
 $T^*$
, remains constant, indicating strict temporal periodicity. However, the magnitude of the decline in
 $\xi _{\textit{total }}$
during each leakage period shows an overall decreasing trend over time, although it may vary non-monotonically in the late stage, when the number of escaping particles becomes very small. Thus, while the timing of the leakage events is regular and invariant, the magnitude of each particle leakage period progressively decreases, resulting in a deceleration of the overall rate of decrease in
 $\xi _{\textit{total }}$
over time, as shown in figure 6.
Average time interval
 $T^*$
for the particle leakage period in Cases A and B with various particle Stokes numbers
 ${\textit{St}}$
. Across Cases A and B with various particle Stokes numbers, the time interval
 $T^*$
remains approximately 1.25 (dashed line), indicating that the particle leakage period is independent of both the initial particle volume fraction and the Stokes number. The average time interval
 $T^*$
for each case is calculated by averaging the leakage time periods for each particle leakage event within the time range
 $(\tau - \tau ^*) \in (0, 35)$
, where the uncertainty is quantified as the standard deviation of these individual intervals.

In addition, we clearly illustrate the process of particle leakage within a single period in figure 7(b), and the distributions of
 $\varPhi _{p}$
at three representative time instants
 $\tau _1$
,
 $\tau _2$
and
 $\tau _3$
are presented in figure 7(a). At time instant
 $\tau _1$
, which corresponds to the critical starting point of the particle leakage period, we can observe that the PCR nearly coincides with the separatrix streamline
 $S_{\textit{max}}$
for the V2 core region within the marked area. Subsequently, some particles cross the separatrix streamline
 $S_{\textit{max}}$
and escape from the V2 core region, directly causing a decrease in
 $\xi _{\textit{total }}$
. These escaping particles gradually migrate towards the tail region of the V2 vortex. At time instant
 $\tau _3$
, we present the potential trajectories of particles based on the current flow field. Two distinct movement patterns for particles inside and outside the V2 core region can be identified. Particles that cross the separatrix streamline
 $S_{\textit{max}}$
and leave the V2 core region ultimately move away from the V2 vortex (see the blue particle tracks in figure 7(b) at time instant
 $\tau _3$
), whereas particles within the V2 core region remain trapped.
For cases with different particle Stokes numbers and initial particle volume fractions, we further summarise the average time interval
 $T^*$
for each particle leakage events within the time range
 $(\tau - \tau ^*) \in (0, 35)$
, as presented in figure 8, where the uncertainty is quantified as the standard deviation of these individual intervals. The particle leakage time interval
 $T^*$
almost remains at approximately 1.25. This finding indicates that the particle leakage period is independent of both the initial particle volume fraction and the Stokes number. Actually, this leakage phenomenon arises from the particle feedback effects on the flow and its periodicity is fundamentally related to the flow field characteristics. Under different conditions, increases in the particle Stokes number and initial volume fraction accelerate particle leakage (see figure 6). This acceleration occurs primarily due to the increased number of particles escaping per leakage period rather than due to a change in the frequency of particle leakage events.
5.2. Role of particle clustering in leakage
As mentioned earlier, when the feedback effect of particles on the flow is accounted for, particle clustering triggers periodic particle leakage. This phenomenon essentially arises from changes in particle dynamics caused by modifications to the flow field induced by the particles themselves.
Distribution of the vorticity field
 $\boldsymbol{\omega }$
in the CVP flow at time points
 $\tau =2$
,
 $6$
and
 $10$
for Case A with particle Stokes number
 ${\textit{St}}= 0.045$
. The clustering of particles corresponding to the formation of the PCR leads to alterations in the local vorticity field of the CVP flow. A positive vorticity ring (PVR) forms around the V2 vortex in the CVP and this PVR is spatially identical with the PCR formed around the V2 vortex (figure 10
 $a$
).

Feedback effects of particle clustering on the vorticity field of the CVP flow. (
 $a$
) Distribution of the effective density
 $\rho _{\textit{eff}}$
within the CVP flow at times
 $\tau =2$
,
 $6$
and
 $10$
for Case A with a particle Stokes number of
 ${\textit{St}}=0.045$
. (
 $b$
) Corresponding distribution of the pressure
 $p$
within the CVP flow. (
 $c$
) Corresponding distribution of the baroclinic source term
 $\boldsymbol{S}_\omega$
within the CVP flow. The PCR establishes a strong density gradient, which is not necessarily aligned with the existing pressure gradients, consequently activating the baroclinic source term and contributing to the generation of the PVR.

In our dilute regime, the particle feedback effect does not significantly influence the overall characteristics of the CVP, as detailed in Appendix C. The intervortex separation distance
 $b$
and circulation ratio
 $\gamma$
of the CVP do not significantly change, resulting in a maximum deviation of only 3.5
 $\,\,\%$
in the rotational angular velocity
 $\varOmega$
. However, local particle clustering corresponding to the formation of the PCR leads to alterations in the local vorticity field of the CVP flow, as shown in figure 9. A positive vorticity ring (PVR) forms around the V2 vortex in the CVP, which is spatially identical with the PCR formed around the V2 vortex.
In fact, the local particle clustering determines the generation of the PVR, which can be captured by the vorticity transport equation (5.2) of the equivalent single-phase pseudocompressible flow, as derived in § 2.2:
 \begin{align} \frac {\mathrm{D}\boldsymbol{\omega }}{\mathrm{D}\tau }=(\boldsymbol{\omega }\boldsymbol{\cdot }\boldsymbol{\nabla })\boldsymbol{u}+\frac {\boldsymbol{\nabla }\rho _{\textit{eff}}\times \boldsymbol{\nabla }p}{\rho _{\textit{eff}}^2}, \end{align}
where
 $\boldsymbol{\omega }$
denotes the vorticity of the flow. The first term on the right-hand side of (5.2) represents the vorticity stretching and tilting by the velocity gradient. The second term, denoted as
 $\boldsymbol{S}_\omega$
, is a key baroclinic source term for the generation of vorticity in this pseudocompressible flow. It is non-zero when the effective density gradients (
 $\boldsymbol{\nabla }\rho _{\textit{eff}}$
) are not aligned with the pressure gradients (
 $\boldsymbol{\nabla }p$
).
The non-uniform dispersion of inertial particles within the flow results in a spatially heterogeneous distribution of the effective density, as shown in figure 10(a). The PCR forms around the V2 vortex and induces a significant local augmentation of the effective density field, thereby establishing strong density gradients within the CVP flow. Crucially, these gradients are not necessarily aligned with the existing pressure gradients, which are governed primarily by large-scale flow dynamics. As shown in figure 10(b), the low-pressure regions formed around the centres of the V1 and V2 vortices exhibit pressure gradients directed radially outward from the vortex centres in the surrounding areas. Furthermore, the misalignment between the pressure and density gradients gives rise to the baroclinic source term
 $\boldsymbol{S}_\omega$
(figure 10
 $c$
), which consequently initiates the generation of vorticity and the PVR, as shown in figure 9.
Evolution of the vorticity within the PVR and the corresponding streamline patterns of the CVP for Case A with particle Stokes number
 ${\textit{St}}=0.045$
. The vorticity within the PVR surrounding the V2 vortex undergoes a periodic transport process, as illustrated in supplementary movie 2, which is identical with the periodicity of particle leakage. In panels (
 $a$
)–(
 $c$
), the vorticity distribution within the PVR and the corresponding streamline pattern of the CVP indicated by the lines are presented at typical time instants
 $\tau _1$
,
 $\tau _2$
and
 $\tau _3$
within a period, as defined in figure 7. (
 $d$
) Spatial positions of streamlines
 $S_{\textit{max}}$
and
 $S_0$
at different time instants. These streamlines are rotated around the origin point
 $I$
to ensure consistency in the positions of the vortex centres
 $\boldsymbol{X}_{c1}$
and
 $\boldsymbol{X}_{c2}$
. The accumulation of vorticity in the head and tail regions of vortex V2 at time
 $\tau _2$
leads to changes in the spatial positions of
 $S_{\textit{max}}$
and
 $S_0$
, which play a decisive role in particle trapping within the CVP.

As mentioned earlier, particle clustering leads to the formation of PVR within the CVP flow. The PVR plays a decisive role in subsequent particle leakage. Further analysis reveals that the vorticity within the PVR surrounding the V2 vortex undergoes a periodic transport process. The temporal evolution of vorticity within the PVR is illustrated in supplementary movie 2 for Case A with a particle Stokes number of
 ${\textit{St}}=0.045$
. The periodicity of vorticity transport within the PVR is identical to the periodicity of particle leakage illustrated in figure 7. In figure 11, we further present the vorticity distribution within the PVR and the corresponding streamline pattern of the CVP at typical time instants
 $\tau _1$
,
 $\tau _2$
and
 $\tau _3$
within either a particle leakage period or a vorticity transport period within the PVR. At time instant
 $\tau _1$
, as the particles begin to escape from the PCR, the vorticity within the PVR is advected by the local velocity field. This vorticity is transported bidirectionally along both sides of the vortex V2 towards its tail and head regions, as shown in figure 11(a). Owing to the presence of stagnation points at the head and tail regions of the V2 vortex (figure 1), the transported vorticity accumulates at these locations. By time
 $\tau _2$
, pronounced zones of vorticity accumulation become evident, as shown in figure 11(b). Subsequently, the accumulated vorticity stretches under the effect of the local velocity gradient. This process continues until time
 $\tau _3$
, when the accumulated vorticity is substantially dissipated or reconfigured, marking the end of the current period and the beginning of the next period.
The transport of vorticity is inherently accompanied by a restructuring of the velocity field, which affects local flow characteristics. The streamlines
 $S_{\textit{max}}$
and
 $S_0$
that play decisive roles in particle trapping in the CVP at different time instants are shown in figures 11(a)–11(
 $c$
). The formation and periodic transport of vorticity in the PVR do not affect the existence of
 $S_{\textit{max}}$
and
 $S_0$
. Throughout the particle leakage period, the CVP consistently maintains the potential conditions for forming a PCR. In figure 11(d), we further compare the spatial positions of streamlines
 $S_{\textit{max}}$
and
 $S_0$
at different time instants, where both streamlines
 $S_{\textit{max}}$
and
 $S_0$
at different time instants undergo rotation around the origin point
 $I$
to ensure consistency in the positions of the vortex centres
 $\boldsymbol{X}_{c1}$
and
 $\boldsymbol{X}_{c2}$
. When vorticity accumulates in the head and tail regions of vortex V2 up to time instant
 $\tau _2$
, the streamline
 $S_{\textit{max}}$
shifts inwards, whereas the streamline
 $S_0$
shifts outwards. The outwards expansion of
 $S_0$
causes the PCR to shift laterally. Simultaneously, the contraction of
 $S_{\textit{max}}$
reduces the stable region, ultimately leading to some particles in the PCR crossing
 $S_{max }$
and escaping, as shown in figure 7. Owing to the stretching of the accumulated vorticity, streamlines
 $S_0$
and
 $S_{\textit{max}}$
subsequently tend to return to their original positions, similar to those at time instant
 $\tau _1$
. Although the recovery of the streamlines
 $S_0$
and
 $S_{\textit{max}}$
is limited, no particle leakage from the PCR occurs during this process (figure 7).
Schematic diagram illustrating the mechanism by which localised particle clustering triggers periodic particle leakage. The presence of the particle-attracting ring
 $S_0$
induces localised particle clustering and the formation of a PCR. This PCR generates substantial particle feedback, producing vorticity through the baroclinic source term and creating a morphologically similar PVR. The periodic transport of vorticity within the PVR directly triggers periodic particle leakage by modulating the critical streamlines
 $S_{\textit{max}}$
and
 $S_0$
, which govern particle dynamics within the PCR.

Overall evolution of the integrated baroclinic source term
 ${S}_{\omega ,\textit{total}}$
in the core region of the V2 vortex and the distortion of the streamlines
 $S_0$
and
 $S_{\textit{max}}$
(
 $\Delta \delta$
) induced by the PCR with particle Stokes numbers
 ${\textit{St}}=0.025$
and
 $0.045$
. (
 $a$
) Integrated baroclinic source term decays over time. Higher initial volume fraction and Stokes number leads to stronger coupling between the fluid and the particle phase, resulting in a correspondingly higher magnitude of
 ${S}_{\omega ,\textit{total}}$
. (
 $b$
) Larger
 ${S}_{\omega ,\textit{total}}$
causes greater
 $\Delta \delta$
for the distortion of the streamlines
 $S_0$
and
 $S_{\textit{max}}$
, indicating that particles are more vulnerable to escape.

Overall, the above-mentioned analysis delineates a self-consistent feedback loop governing particle dynamics in the dilute two-way coupled particle-laden CVP flow, as summarised in figure 12. Particle clustering forms the PCR, which generates vorticity via the baroclinic source term, creating a morphologically similar PVR (figure 9). The vorticity within this PVR is then advected periodically by the underlying CVP flow, as shown in figure 11. This periodic transport of the vorticity modulates the critical streamlines
 $S_{\textit{max}}$
and
 $S_0$
, whose synchronous expansion and contraction directly trigger the periodic leakage of particles from the PCR. During each particle leakage period, the leakage rate is governed by the particle parameters, including the particle Stokes number
 ${\textit{St}}$
and initial volume fraction
 $\varPhi _{p,0}$
, through their influence on the intensity of the particle feedback effect on the CVP flow, as indicated in (5.2). We further present the evolution of the integrated baroclinic source term
 ${S}_{\omega ,\textit{total}}=\int _{V2}|\boldsymbol{S}_{\omega }|\,\mathrm{d}V$
induced by the PCR in figure 13(a) for Cases A and B with different particle Stokes numbers. In all the cases, the integrated baroclinic source term decays over time, which is similar to the gradually decreasing total particle volume
 $\xi _{\textit{total }}$
(see figure 6). The initial particle volume fraction directly affects the global two-way coupling strength, whereas the Stokes number
 ${\textit{St}}$
affects the degree of local clustering within the PCR (figure 5). Both a higher
 $\varPhi _{p,0}$
and a larger
 ${\textit{St}}$
can increase the baroclinic source term, leading to a stronger PVR with greater vorticity magnitude, as shown in figure 13(a).
This phenomenon, in turn, increases the periodic distortion of the streamlines
 $S_0$
and
 $S_{\textit{max}}$
, as shown in figure 13(b). Here, we define
 $\Delta \delta =\max (\delta )-\min (\delta )$
to quantify the distortion of these streamlines within a leakage period. The variable
 $\delta$
represents the minimum distance between
 $S_0$
and
 $S_{\textit{max}}$
. Physically,
 $\delta$
reflects the narrowest width of the stable trapping region for particles: a larger
 $\delta$
indicates a wider region where particles can be securely trapped, while a smaller
 $\delta$
means the PCR is closer to the separatrix and more susceptible to particle escape. When the baroclinic source term is large, it generates a stronger PVR around the V2 vortex. The periodic transport of vorticity within the PVR causes greater distortion of the streamlines
 $S_0$
and
 $S_{\textit{max}}$
(larger
 $\Delta \delta$
) ultimately leading to the escape of more particles from the PCR. In contrast, the leakage periodicity (
 $T^*$
) is an intrinsic property of the base CVP flow that remains invariant across cases, as the particle feedback in this dilute regime does not alter the global vortex dynamics (Appendix C). Thus,
 $\varPhi _{p,0}$
and
 ${\textit{St}}$
control the amplitude of the leakage rate, whereas the intrinsic dynamics of the vortex pair dictate its frequency.
In the main content of the present study, we focus on a specific circulation ratio,
 $\gamma =-0.2$
, of the CVP and a particle effective density ratio
 $R=0.2$
. As discussed in the context of one-way coupled sand-laden CVP flows (Zhao et al. Reference Zhao, Zuo and Qian2025), these parameters can significantly affect particle dynamics. To assess whether the newly observed periodic leakage phenomenon is generic or specific to our chosen parameters, we have performed supplementary simulations for other circulation ratios (
 $\gamma =-0.1$
,
 $-0.4$
) and for different effective density ratio (
 $R=0.1$
, 0.4), as detailed in Appendix D. These cases confirm that the same qualitative behaviour – PCR formation followed by periodic leakage – occurs across these parameter variations. Nevertheless, the quantitative characteristics do depend on
 $\gamma$
and
 $R$
. The circulation ratio governs the relative strength and spatial structure of the base CVP flow. Variations in
 $\gamma$
directly alter the characteristic advection time scale of vorticity, which affects the leakage period
 $T^*$
; a stronger V2 vortex (smaller
 $\gamma$
) shortens
 $T^*$
. The value of
 $R$
, representing the particle-to-fluid density ratio, influences both the intensity of particle clustering and the production of the baroclinic source term, as indicated in (5.2). For the moderately heavy particles considered here, the global flow modification remains weak. A lower
 $R$
of particles enhances particle clustering, ultimately resulting in a relatively high particle leakage rate.
6. Conclusions
In this study, we mainly investigate the dynamics of small, heavy, dilute inertial particles (
 ${\textit{St}}\in (0,0.1)$
) within a two-way coupled unequal-strength counter-rotating vortex pair (CVP) that flows with an initial particle volume fraction of
 $\varPhi _{p,0}\lt 1.0\times 10^{-3}$
. Even in this dilute regime, we specifically examine the influences of particle feedback on the dynamics of the particles in the two-way coupled regime using numerical methods. In this context, we identify that localised particle clustering can trigger periodic particle leakage – a new dynamical regime not observed under one-way coupling.
In the CVP, there is a particle-attracting ring
 $S_0$
, which governs the particle dynamics and provides a plausible mechanism for particle trapping and the formation of the localised particle clustering ring (PCR) (Zhao et al. Reference Zhao, Zuo and Qian2025). The particle trapping is governed by two critical Stokes numbers in the two-way coupled regime. The trapping threshold
 ${\textit{St}}_{\textit{cr,t}}$
determines whether particles are initially captured to form a PCR. A lower stability threshold
 ${\textit{St}}_{\textit{cr,s}}$
emerges, which determines the stability of the PCR. The value of
 ${\textit{St}}_{\textit{cr,s}}$
is lower than that of
 $ {\textit{St}}_{\textit{cr,t}}$
and is negatively correlated with the initial particle volume fraction.
At particle Stokes number
 ${\textit{St}}$
lower than
 ${\textit{St}}_{\textit{cr,t}}$
, particles are initially trapped in the CVP to form the PCR, where the maximum particle volume fraction
 $\varPhi _{p,\textit{max}}$
within the PCR increases monotonically until it reaches a peak value
 $\varPhi _{p,\textit{max}}^*$
at the time instant
 $\tau ^*$
. Particle feedback effects have a negligible influence on the initial particle clustering behaviours (
 $\tau \lt \tau ^*$
). The effect of the initial particle volume fraction on clustering is linear. The Stokes number is the primary determinant of the initial particle clustering behaviour. Greater particle inertia intensifies and accelerates the clustering process. Specifically, the maximum volume fraction
 $\varPhi _{p,\textit{max}}^*$
increases linearly, whereas the time
 $\tau ^*$
decreases with increasing particle Stokes number.
When
 ${\textit{St}}\lt {\textit{St}}_{\textit{cr,s}}$
, the formation of the PCR is stable. While for
 ${\textit{St}}_{\textit{cr,s}}\lt St\lt {\textit{St}}_{\textit{cr,t}}$
, a PCR forms only within a finite time, followed by subsequent particle leakage. The leakage process of particles is not continuous over time, but exhibits significant temporal periodicity with a constant time interval
 $T^*$
. The mechanism underlying the periodic particle leakage is elucidated as a self-consistent feedback loop. The formation of the PCR generates vorticity via the baroclinic source term, creating a morphologically similar positive vorticity region (PVR). The periodic advection and reconfiguration of this vorticity by the base CVP flow modulate the critical streamlines
 $S_{\textit{max}}$
and
 $S_0$
, reducing the stable region and displacing the PCR, thereby allowing particles to escape. The leakage period
 $T^*$
is an intrinsic property of the CVP with a specific circulation ratio
 $\gamma$
, whereas the leakage rate changes with
 ${\textit{St}}$
and
 $\varPhi _{p,0}$
.
While the main simulations focus on
 $\gamma =-0.2$
and
 $R=0.2$
, additional cases for other circulation ratios
 $\gamma = -0.1$
,
 $-0.4$
and effective density ratios
 $R=0.1$
, 0.4 are also presented in Appendix D. These confirm that the periodic leakage mechanism is qualitatively robust across these parameter variations, although the quantitative values of critical Stokes numbers and the leakage period depend on
 $\gamma$
and
 $R$
. In addition, the initial particle volume fraction is constrained to values below
 $1.0 \times 10^{-3}$
in the current study. Under these conditions, particle feedback effects do not influence the overall dynamics of the vortex pair. Future work should extend the present analysis to higher initial volume fractions, where feedback may modify the global vortex dynamics (Shuai & Kasbaoui Reference Shuai and Kasbaoui2022) and the vortex interactions (Shuai et al. Reference Shuai, Roy and Kasbaoui2024). These alterations in the vortex flow may further impact the formation of particle trapping.
Supplementary movies
Supplementary movies are available at https://doi.org/10.1017/jfm.2026.11988.
Acknowledgements
The numerical calculations in this work were performed on the Supercomputing system at the Supercomputing Centre of Wuhan University.
Funding
This work was supported by the National Natural Science Foundation of China (Grant Nos. 52279090, 52509128 and U24A20140) and the Natural Science Foundation of Hubei Province (Grant No. 2025AFB171).
Declaration of interests
The authors report no conflict of interest.
Appendix A. Independence analysis and simulation validation
A.1. Independence analysis of the simulation set-up
Three sets of mesh configurations (coarse, medium and fine) and time steps are adopted to conduct the independence analysis for the numerical simulation of the particle-laden CVP flow, as listed in table 3. The parameters
 $N_t$
and
 $N_r$
denote the numbers of mesh nodes in the tangential and radial directions, respectively. The minimum length of the mesh element is
 $\Delta x$
. In the three mesh configurations, the mesh size is consecutively refined in both the tangential and radial directions, and the time step is decreased to maintain a maximum Courant number (Co) of approximately 0.5.
Main parameters of the mesh and time step
 $\Delta \tau$
for the independence analysis of the simulation set-up. The parameters
 $N_t$
and
 $N_r$
denote the numbers of mesh nodes in the tangential and radial directions, respectively. The minimum length of the mesh element is
 $\Delta x$
. Compared with those in the coarse mesh, the mesh sizes in the medium and fine meshes are refined in both the tangential and radial directions, and the time step decreases correspondingly such that the maximum Courant number (Co) is approximately 0.5.

Table 3. Long description
A table with three rows and five columns comparing mesh parameters and time steps for simulation analysis. The columns are labeled N_t, N_r, b/Δx, Δτ, and Max. Co. The rows are labeled Coarse, Medium, and Fine. Row 1: N_t, 2,500; N_r, 650; b/Δx, 100; Δτ, 2.0 x 10^-4; Max. Co, 0.5. Row 2: N_t, 4000; N_r, 1000; b/Δx, 167; Δτ, 1.0 x 10^-4; Max. Co, 0.5. Row 3: N_t, 6000; N_r, 1500; b/Δx, 250; Δτ, 5.0 x 10^-5; Max. Co, 0.5.
Simulation independence is assessed by comparing the temporal evolution of the maximum particle volume fraction,
 $\varPhi _{p,\textit{max}}$
, within the PCR. The results of this independence analysis for particles with Stokes numbers
 ${\textit{St}}=0.005$
and 0.025 in Case A are presented in figure 14, where the black scatter points represent the results obtained using the fine mesh. We find that further mesh refinement and a reduction in the time step do not affect the evolution of
 $\varPhi _{p,\textit{max}}$
compared with the results obtained using the medium mesh. Therefore, the medium mesh with a time step
 $\Delta \tau =1.0\times 10^{-4}$
is used for the simulations.
Temporal evolution of the maximum particle volume fraction,
 $\varPhi _{p,\textit{max}}$
, within the PCR in Case A with the particle Stokes numbers (
 $a$
)
 ${\textit{St}}=0.005$
and (
 $b$
)
 ${\textit{St}}=0.025$
; these values are obtained by simulations using different mesh configurations and time steps. Compared with the medium mesh, the fine mesh is further refined, but this process does not affect the evolution of
 $\varPhi _{p,\textit{max}}$
.

A.2. Validation of the simulation method
In the present study, a simplified governing equation (2.6) for particle motion is adopted. In fact, the accuracy of this equation is limited by the particle Stokes number and its precision can be ensured only when the particle Stokes number is sufficiently small. Here, we strictly confine the particle Stokes number to the range of (0, 0.1). In this context, we first validate the accuracy of the simplified governing equation by comparing the corresponding simulation results with the available results obtained by the original particle motion equation of Zhao et al. (Reference Zhao, Zuo and Qian2025).
The predicted critical Stokes number
 ${\textit{St}}_{\textit{cr,t}}$
in the one-way coupled particle-laden CVP flow against the data from Zhao et al. (Reference Zhao, Zuo and Qian2025) are compared for the cases of
 ${\textit{St}}\in (0,0.1)$
,
 $R\in (0.0.3)$
and
 $\gamma =-0.2$
. The value of the critical Stokes number
 ${\textit{St}}_{\textit{cr,t}}$
is obtained by calculating the average Stokes number of adjacent cases where the particle trapping dynamics change. In these adjacent cases, the interval for the particle Stokes number is specifically set to 0.005. The results are shown in figure 15, where the scattered points represent the critical Stokes numbers predicted using the simplified (2.6). The critical Stokes values predicted by the simplified equation are identical with those obtained by directly solving the particle equations (Zhao et al. Reference Zhao, Zuo and Qian2025). These findings further confirm the applicability of the present method for accurately determining the particle motion in the CVP flow within a limited range of particle Stokes numbers
 ${\textit{St}}\in (0,0.1)$
.
Predicted critical Stokes number
 ${\textit{St}}_{\textit{cr,t}}$
for particle trapping for the reference case with
 ${\textit{St}}\in (0,0.1)$
,
 $R\in (0.0.3)$
and
 $\gamma =-0.2$
. The values of the critical Stokes numbers predicted by the simplified equation in the present study are identical with those obtained by directly solving the particle equations (Zhao et al. Reference Zhao, Zuo and Qian2025).

To further validate the simplified method adopted in the present study, which considers two-way coupled simulations, we perform additional simulations using a coupled Euler–Lagrange (E–L) method for a representative case (Case A,
 ${\textit{St}}=0.045$
,
 $\varPhi _{p,0}=1 \times 10^{-3}$
). In this method, the equation of motion is integrated using the finite-volume flow solver NGA (Desjardins et al. Reference Desjardins, Blanquart, Balarac and Pitsch2008) with the Euler–Lagrange strategy of Capecelatro & Desjardins (Reference Capecelatro and Desjardins2013), which has been validated from dilute to dense particle-laden flows. Since the local particle volume fraction in the PCR can exceed
 $\varPhi _{p,0}$
by more than an order of magnitude (reaching values greater than
 $10^{-2}$
), we also include inter-particle collisions using a soft-sphere model to assess their potential influence.
Figure 16 shows the particle volume fraction distribution at several time instants from the coupled Euler–Lagrange simulation. The same qualitative features observed in figure 10 are evident: a PCR forms and then undergoes periodic leakage, with particles escaping from the V2 core region. In addition, the particle volume fraction distribution remains nearly the same regardless of the effect of particle collisions.
Distribution of the particle volume fraction
 $\varPhi _p$
at several time instants for the Case A with
 ${\textit{St}}=0.045$
from the coupled Euler–Lagrange simulation. (
 $a$
) Effect of the inter-particle collisions are neglected. (
 $b$
) Inter-particle collisions are considered. The same qualitative features observed in figure 10 are evident: a PCR forms and then undergoes periodic leakage.

Overall evolution of the total particle volume
 $\xi _{\textit{total }}$
in the V2 core region for the Case A with
 ${\textit{St}}=0.045$
from the coupled Euler–Lagrange (E–L) simulation. The total particle volume obtained using the coupled Euler–Lagrange method is essentially consistent with the values predicted by the method employed in this study.

Figure 17 quantifies the temporal evolution of the normalised total particle volume in the V2 core region from the coupled Euler–Lagrange simulation. It can be observed that the total particle volume obtained using the conventional coupled Euler–Lagrange method is essentially consistent with the values predicted by the method employed in this study. Even when particle collisions are considered, the total particle volume shows only a slight decrease of less than 1
 $\,\,\%$
.
In summary, our direct validation confirms that the method adopted in the present study captures the essential physics of the periodic leakage phenomenon and the neglect of inter-particle collisions in the main simulations is justified for the dilute conditions considered (
 $\varPhi _{p,0} \lt 1 \times 10^{-3}$
). Although the local particle volume fraction increases due to particle clustering, the effect of local particle collisions on the global dynamics of the particles is negligible. This could be because, under the present conditions (very small particles, low Stokes numbers and a quasi-steady ring structure), the relative velocities among particles are small, and the PCR acts as a coherent, ordered cluster rather than a random, high-speed granular flow. The probability of energetic collisions that could significantly change particle trajectories or the overall mass balance is very low.
Appendix B. Particle dynamics for reference case
Numerical simulation results showing the evolution of the distribution of the particle volume fraction
 $\varPhi _p$
for the reference case. (
 $a$
) Particle Stokes number
 ${\textit{St}} = 0.005 \lt {\textit{St}}_{\textit{cr,t}}=0.07893$
, a stable PCR forms in the CVP. (
 $b$
) Particle Stokes number
 ${\textit{St}} = 0.080 \gt {\textit{St}}_{\textit{cr,t}}=0.07893$
, where particles completely escape the CVP flow over time and no PCR forms. The light pink lines represent the separatrix streamlines in the CVP flow.

In the reference case, one-way coupled particle-laden CVP flow is considered. In this regime, the CVP flow in the corotating frame is steady without the effect of particle feedback, as defined in (2.1). Although the flow is steady, the initial particles exhibit significant unsteady characteristics, which manifest as non-uniform dispersion. Zhao et al. (Reference Zhao, Guo, Zuo and Qian2024), an index
 $I(S)$
is defined to quantify the dispersion of particles in the CVP flow. In the CVP flow, a closed critical streamline
 $S_0$
exists (figure 18), characterised by
 $I(S_0)=0$
,
 $I(S_0^+)\gt 0$
and
 $I(S_0^-)\lt 0$
, where
 $S_0^+$
and
 $S_0^-$
denote streamlines outside and inside the boundary of
 $S_0$
, respectively. This closed critical streamline
 $S_0$
governs the trapping of particles and functions as a particle-attracting ring (Zhao et al. Reference Zhao, Guo, Zuo and Qian2024).
Figure 18 illustrates the evolution of the particle volume fraction,
 $\varPhi _p$
, for the reference case. Distinct regimes of particle migration patterns can be identified. Initially, the particles are evacuated from the vortex core regions in both scenarios. Under the influence of the particle-attracting ring, the particles subsequently aggregate within the core region of the V2 vortex, forming an annular region characterised by a high particle volume fraction. We refer to this stable region of the elevated particle volume fraction as the localised ring-shaped particle clustering region (PCR), as identified by Zhao et al. (Reference Zhao, Guo, Zuo and Qian2024, Reference Zhao, Zuo and Qian2025). In the one-way coupled regime, the trapping of particles and the formation of the corresponding PCR are determined only by the particle Stokes number and a critical Stokes number threshold exists. We denote this critical threshold as the trapping critical Stokes number
 ${\textit{St}}_{\textit{cr,t}}$
. The value of the trapping critical Stokes number
 ${\textit{St}}_{\textit{cr,t}}$
has been indicated in previous studies (Zhao et al. Reference Zhao, Guo, Zuo and Qian2024, Reference Zhao, Zuo and Qian2025). As depicted in figure 18(a), when the particle Stokes number is 0.005 below
 ${\textit{St}}_{\textit{cr,t}}$
=
 $0.07893$
, a stable PCR forms in the V2 core region and its location aligns with the particle-attracting ring. However, when
 ${\textit{St}} \gt {\textit{St}}_{\textit{cr,t}}$
, the particles completely depart from the CVP flow over time and no PCR forms, as shown in figure 18(b).
Moreover, in this study, a stable PCR is defined as after the peak at
 $\tau =\tau ^*$
, the relative change of
 $\varPhi _{p,\textit{max}}$
is below
 $2\,\%$
and that of
 $\xi _{\textit{total}}$
is below
 $1\,\%$
over any time interval for the entire simulation (up to
 $\tau =150$
). The entire simulation is much longer than the clustering time scale
 $\tau ^*$
and exceeds it by at least 40 times the leakage period
 $T^*$
, ensuring that the observed stability is not transient.
Evolution of the intervortex separation distance
 $b$
and circulation ratio
 $\gamma$
of the CVP in Case A with particle Stokes numbers
 ${\textit{St}} = 0.025$
and 0.065. Considering the low particle volume fraction in the present study, the changes in
 $b$
and
 $\gamma$
are small, where the maximum change in
 $b$
is 4 %, and the maximum deviation in
 $\gamma$
is only 1 %. The dashed lines denote the initial intervortex separation distance and circulation ratio, which remain constant in the reference case without the particle feedback effect.

Appendix C. Dynamics of the coupled particle-laden CVP
To evaluate the effects of particle feedback on the overall characteristics of the CVP, we discuss the dynamics of the coupled particle-laden CVP in Cases A–C, focusing on the intervortex separation distance
 $b$
, circulation ratio
 $\gamma$
and corresponding rotational angular velocity
 $\varOmega$
. For simplicity, we present only the results for Case A, which has the highest initial volume fraction
 $\varPhi _{p,0}=1\times 10^{-3}$
. The particle feedback effect on the fluid is the most pronounced in this case.
Figure 19 illustrates the evolution of the intervortex separation distance
 $b$
and the circulation ratio
 $\gamma$
of the CVP in Case A, with Stokes numbers of
 ${\textit{St}} = 0.25$
and 0.65. The parameters used to calculate
 $b$
and
 $\gamma$
, including the vortex centre positions (
 $\boldsymbol{X}_{c1}$
,
 $\boldsymbol{X}_{c2}$
) and circulations (
 $\varGamma _1$
,
 $\varGamma _2$
) for vortices V1 and V2, are determined using the method proposed by Wakim et al. (Reference Wakim, Brion, Dolfi-Bouteyre and Jacquin2020), as defined in (C1):
 \begin{align} \boldsymbol{X_c} = \frac {1}{\varGamma }\left ({\int _\zeta x\boldsymbol{\omega }\,\mathrm{d}\zeta },{\int _\zeta y\boldsymbol{\omega }\,\mathrm{d}\zeta } \right ), \quad \text{and} \quad \varGamma = \int _\zeta \boldsymbol{\omega }\,\mathrm{d}\zeta , \end{align}
where
 $\zeta$
is the integral region for each vortex, in which the values of
 $Q$
and
 $\omega$
should satisfy
 $Q(x,y)\gt 0$
and
 $\omega (x,y)\gt 0$
for vortex V1 and
 $\omega (x,y)\lt 0$
for vortex V2, respectively. The value of
 $Q = 1/2 (\|\boldsymbol{\varOmega }^*\|-\|\boldsymbol{S}^*\|)$
is the
 $Q$
criterion that defines a vortex as a region with a positive second invariant of
 $\boldsymbol{\nabla }\boldsymbol{u}_{\!f}$
; here,
 $\boldsymbol{\varOmega }^*$
and
 $\boldsymbol{S}^*$
denote the rotation rate tensor and the strain rate tensor of the fluid, respectively.
As shown in figure 19, the intervortex separation distance
 $b$
increases, whereas the circulation ratio
 $\gamma$
decreases over time, which is attributed to the feedback effect of particles on the CVP (Shuai & Kasbaoui Reference Shuai and Kasbaoui2022; Shuai et al. Reference Shuai, Roy and Kasbaoui2024). However, given the low particle volume fraction in the present study, the changes in
 $b$
and
 $\gamma$
are not significant. For a particle Stokes number of
 ${\textit{St}} = 0.025$
, the maximum change in
 $b$
is 4 %, and the maximum deviation in
 $\gamma$
is only 1 %. Furthermore, as indicated in § 2, the rotational angular velocity
 $\varOmega$
depends on the intervortex separation distance and the circulation ratio of the CVP. Variations in these parameters lead to changes in
 $\varOmega$
, although the maximum variation remains below 3.5 %. Overall, the rotational angular velocity of the CVP tends to decelerate, causing the CVP position to shift counterclockwise around the centre point within the rotational coordinate system, as shown in figures 2 and 3.
Appendix D. Influence of circulation and density ratio
To examine the robustness of the particle dynamics in the two-way coupled CVP flow, we perform additional simulations for other circulation ratios (
 $\gamma = -0.1$
,
 $-0.4$
) and effective density ratios (
 $R = 0.1$
,
 $0.4$
), all with
 $\varPhi _{p,0}=1\times 10^{-3}$
as listed in table 4. In these cases, the same particle dynamics is observed: a PCR forms temporarily and then undergoes periodic leakage (figure 20). As in the baseline case, the particle dynamics are governed by two critical Stokes numbers: the trapping threshold
 ${\textit{St}}_{\textit{cr,t}}$
and the stability threshold
 ${\textit{St}}_{\mathrm{cr,s}}$
. Table 5 summarises these critical values for all tested parameter sets. The value of
 ${\textit{St}}_{\textit{cr,t}}$
depends on
 $\gamma$
and
 $R$
(Zhao et al. Reference Zhao, Zuo and Qian2025), while
 ${\textit{St}}_{\mathrm{cr,s}}$
is much smaller than
 ${\textit{St}}_{\textit{cr,t}}$
and tends to increase with
 $R$
.
Non-dimensional parameters considered in the additional simulations for other circulation ratios
 $\gamma$
and effective density ratios
 $R$
with the same initial particle volume fraction
 $\varPhi _{p,0}$
as in Case A. The particle Stokes number
 ${\textit{St}}$
is constrained to the range
 $(0,0.1)$
with fixed increments
 $\Delta St = 0.01$
.

Table 4. Long description
A table with four rows and five columns. The columns are labeled Case, γ, R, Φp,0, and St. The rows are labeled with different cases: A-1, A-2, A-3, and A-4. Each row lists specific values for γ, R, Φp,0, and St. For example, Case A-1 has γ of -0.1, R of 0.2, Φp,0 of 1.0 x 10^-3, and St of (0, 0.1). The table provides detailed parameters for simulations with varying circulation ratios and effective density ratios.
Evolution of the distribution of the particle volume fraction
 $\varPhi _p$
for cases with a particle Stokes number
 ${\textit{St}} = 0.045$
and an initial particle volume fraction
 $\varPhi _{p,0}=1\times 10^{-3}$
considering the influence of the circulation ratio
 $\gamma$
and effective density ratio
 $R$
: (
 $a$
)
 $\gamma =-0.1$
,
 $R=0.2$
; and (
 $b$
)
 $\gamma =-0.2$
,
 $R=0.4$
. The same particle dynamics is observed as shown in figure 2: for
 ${\textit{St}}_{\textit{cr,s}}\lt St\lt {\textit{St}}_{\textit{cr,t}}$
, a PCR forms temporarily and than undergoes periodic leakage.

As discussed in § 4, for
 ${\textit{St}} \lt {\textit{St}}_{\textit{cr,t}}$
, particles are initially trapped and the maximum particle volume fraction
 $\varPhi _{p,\textit{max}}$
increases monotonically until it reaches a peak
 $\varPhi _{p,\textit{max}}^*$
at time
 $\tau ^*$
. Figure 21 shows
 $\varPhi _{p,\textit{max}}^*$
and
 $\tau ^*$
for
 ${\textit{St}} = 0.025$
and
 $0.045$
under variations of
 $\gamma$
and
 $R$
. With increasing
 $\gamma$
(less negative) and
 $R$
, the peak clustering intensity (
 $\varPhi _{p,\textit{max}}^*$
) increases, but the clustering process slows down (larger
 $\tau ^*$
).
Critical Stokes numbers for particle dynamics in the CVP flow, including the trapping threshold
 ${\textit{St}}_{\textit{cr,t}}$
and the stability threshold
 ${\textit{St}}_{\textit{cr,s}}$
across different cases with
 $\varPhi _{p,0}=1\times 10^{-3}$
,
 $\gamma =-0.1,-0.4$
and
 $R=0.1,0.2,0.4$
.

Table 5. Long description
A table with four columns and five rows, including headers. The columns are labeled Parameter, gamma, R, St_cr,s, and St_cr,t. The rows list different values for these parameters. Row 1: Parameter, gamma, R, St_cr,s, St_cr,t. Row 2: -0.1, 0.2, 0.0025 ± 0.0025, 0.056. Row 3: -0.4, 0.2, 0.005 ± 0.0025, 0.047. Row 4: -0.2, 0.1, 0.0025 ± 0.0025, 0.061. Row 5: -0.2, 0.4, 0.01725 ± 0.0025, 0.119. The table provides critical values for different cases of particle dynamics.
During the leakage stage, particles escape from the V2 core region, causing the total particle volume
 $\xi _{{total}}$
to decrease. Figure 22 presents the evolution of
 $\xi _{{total}}$
for the additional cases. At
 $\tau = \tau ^*$
, the normalised total particle volume is larger for higher
 $R$
, which is related to the larger basin of attraction (BOA) reported by Zhao et al. (Reference Zhao, Zuo and Qian2025). Over time,
 $\xi _{{total}}$
decreases rapidly and eventually stabilises. A lower circulation ratio (more negative
 $\gamma$
) and a higher effective density
 $R$
lead to a faster particle escape rate. The leakage is periodic and table 6 lists the average time interval
 $T^*$
between successive leakage events. Here,
 $T^*$
decreases as
 $\gamma$
becomes more negative (stronger V2 vortex), while it remains nearly unchanged when
 $R$
varies for fixed
 $\gamma$
, further confirming that the periodicity is governed primarily by the base flow. However, a smaller
 $R$
(heavier particles) strengthens the particle feedback, increasing the number of particles escaping per period and thus accelerating the overall decay of
 $\xi _{{total}}$
(figure 22).
Average time interval
 $T^*$
for the leakage period of particles with different Stokes numbers in cases with a initial particle volume fraction
 $\varPhi _{p,0}=1\times 10^{-3}$
considering the influence of the circulation ratio
 $\gamma$
and effective density ratio
 $R$
.

Table 6. Long description
A table with four rows and four columns. The columns are labeled ‘Parameter’, ‘γ’, ‘R’, and ‘T*’. The first row under ‘Parameter’ lists ‘γ’ and ‘R’. The subsequent rows provide values for these parameters. Row 1: γ, -0.1, R, 0.2, T*, 1.56 ± 0.06. Row 2: γ, -0.4, R, 0.2, T*, 0.89 ± 0.08. Row 3: γ, -0.2, R, 0.1, T*, 1.27 ± 0.07. Row 4: γ, -0.2, R, 0.4, T*, 1.24 ± 0.04.
Normalised peak value of the maximum particle volume fraction within the PCR,
 $\varPhi _{p,\textit{max}}^*$
, and the corresponding time instant
 $\tau ^*$
for cases with particle Stokes numbers
 ${\textit{St}} = 0.025$
, 0.045 and a initial particle volume fraction
 $\varPhi _{p,0}=1\times 10^{-3}$
considering the influence of the circulation ratio
 $\gamma$
and effective density ratio
 $R$
. (
 $a$
) Values of
 $\varPhi _{p,\textit{max}}^*$
and
 $\tau ^*$
for cases with different
 $\gamma$
and
 $R=0.2$
. (
 $b$
) Values of
 $\varPhi _{p,\textit{max}}^*$
and
 $\tau ^*$
for cases with different
 $R$
and
 $\gamma =-0.2$
.

Overall evolution of the total particle volume
 $\xi _{\textit{total }}$
in the V2 core region for cases with a particle Stokes number
 ${\textit{St}} = 0.025$
and a initial particle volume fraction
 $\varPhi _{p,0}=1\times 10^{-3}$
considering the influence of the ciculation ratio
 $\gamma$
and effective density ratio
 $R$
. The value of
 $\xi _{\textit{total }}$
is normalised by the initial total particle volume,
 $\xi _{\textit{total },0}$
.


 a
 Γ1>0
 Γ2<0
 Ω
 I
 b
 Ω
 Smax

 Φp,0
 St
 St
 (0,0.1)
 ΔSt=0.01

 Φp
 St=0.025
 a
 b
 r⩽2

 Φp
 St=0.005

 Stcr,t
 Stcr,s
 Stcr,t
 γ
 R
 γ
 R
 Stcr,t
 Stcr,s
 St
 Stcr,s
 ΔSt=0.005

 Φp,max/Φp,0
 St
 a
 b
 Φp,0=1×10⁻³
 c
 d
 Φp,0
 St
 Φp,max
 Stcr,s
 Φp,max

 Φp,max∗/Φp,0
 τ∗
 a
 195
 b
 τ∗
 St

 ξtotal
 St=0.025
 0.045
 ξtotal
 ξtotal ,0
 ξtotal

 St=0.045
 a
 ξtotal
 (τ−τ∗)∈(0,5.5)
 (15,21)
 ξtotal
 T∗
 b
 Φp
 τ1
 τ2
 τ3
 a
 τ1
 Smax
 τ2
 τ3

 T∗
 St
 T∗
 T∗
 (τ−τ∗)∈(0,35)

 ω
 τ=2
 6
 10
 St=0.045
 a

 a
 ρeff
 τ=2
 6
 10
 St=0.045
 b
 p
 c
 Sω

 St=0.045
 a
 c
 τ1
 τ2
 τ3
 d
 Smax
 S0
 I
 Xc1
 Xc2
 τ2
 Smax
 S0

 S0
 Smax
 S0

 Sω,total
 S0
 Smax
 Δδ
 St=0.025
 0.045
 a
 Sω,total
 b
 Sω,total
 Δδ
 S0
 Smax
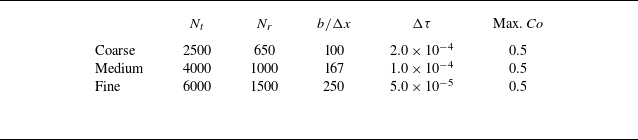
 Δτ
 Nt
 Nr
 Δx

 Φp,max
 a
 St=0.005
 b
 St=0.025
 Φp,max

 Stcr,t
 St∈(0,0.1)
 R∈(0.0.3)
 γ=−0.2

 Φp
 St=0.045
 a
 b

 ξtotal
 St=0.045

 Φp
 a
 St=0.005
 b
 St=0.080>Stcr,t=0.07893

 b
 γ
 St=0.025
 b
 γ
 b
 γ

 γ
 R
 Φp,0
 St
 (0,0.1)
 ΔSt=0.01

 Φp
 St=0.045
 Φp,0=1×10⁻³
 γ
 R
 a
 γ=−0.1
 R=0.2
 b
 γ=−0.2
 R=0.4
 Stcr,s

 Stcr,t
 Stcr,s
 Φp,0=1×10⁻³
 γ=−0.1,−0.4
 R=0.1,0.2,0.4

 T∗
 Φp,0=1×10⁻³
 γ
 R

 Φp,max∗
 τ∗
 St=0.025
 Φp,0=1×10⁻³
 γ
 R
 a
 Φp,max∗
 τ∗
 γ
 R=0.2
 b
 Φp,max∗
 τ∗
 R
 γ=−0.2

 ξtotal
 St=0.025
 Φp,0=1×10⁻³
 γ
 R
 ξtotal
 ξtotal ,0



