Introduction
Scales that were developed for use in unipolar depression to measure depression severity are regularly used to measure depression in bipolar disorder. Depressive episodes of bipolar disorder have a different phenomenology to the episodes of unipolar depression Reference Mitchell, Wilhelm, Parker, Austin, Rutgers and Malhi(1). However, there is also considerable overlap of symptoms as well as heterogeneity of depressive phenomenology within the two diagnostic categories.
Features of bipolar depression can include abrupt onset and offset and atypical features such as fatigue, hypersomnia, hyperphagia and rejection sensitivity. Depressive episodes may be more recurrent in bipolar depression than in unipolar depression and may occur at an earlier age of onset; there may also be features of irritability, mixed states, lability, feelings of worthlessness, unvarying mood and marked anhedonia Reference Ghaemi, Ko and Goodwin(2). In clinical studies of bipolar depression, the most widely used observer-rated scales are the Hamilton Depression Rating Scale (HAM-D) Reference Hamilton(3) and the Montgomery Åsberg Depression Rating Scale (MÅDRS) Reference Montgomery and Asberg(4). Although they are useful instruments, both instruments were developed for use in populations with unipolar depression. Given that the phenomenology and clinical characteristics of bipolar and unipolar depressions differ Reference Berk, Malhi and Mitchell(5), a rating scale more sensitive to the features of bipolar depression is required.
The Bipolar Depression Rating Scale (BDRS) is an observer-rated scale for bipolar depression. It can be downloaded free of charge from www.barwonhealth.org.au/bdrs. It was designed to reflect the characteristics of bipolar depression and uses items that partially overlap and partially differ from items in the HAM-D and MÅDRS. For example, the BDRS includes both insomnia and hypersomnia as characteristic of depression rather than insomnia only and both hyperphagia and hypophagia rather than hypophagia only. The BDRS additionally includes items that characterise mixed states. The BDRS places a different emphasis on items compared to the HAM-D and MÅDRS which better reflects bipolar depression. In a study where bipolar patients (N = 60) were administered, the BDRS hierarchical cluster analysis (HCA) and multidimensional scaling (MDS) revealed an internal structure that was sensitive to complex features of bipolar depression. The BDRS was found to have a two-cluster structure, with 12 items in a depressive symptoms cluster and 8 items in a mixed symptoms cluster Reference Chang, Ahn and Yu(6).
Other rating scales designed specifically for use in bipolar disorder, most notably the Young Mania Rating Scale (YMRS), focus on manic and hypomanic symptoms. The BDRS is the only validated, freely available scale for use in bipolar depression. The scale was first published in 2007 Reference Berk, Malhi and Cahill(7) and is being used in several clinical studies and is currently available in seven languages. The purpose of this paper is to assess the validity of the BDRS as an outcome measure in a clinical trial. The results of the trial, including change in BDRS scores, are reported elsewhere Reference Berk, Copolov and Dean(8). This is the first completed and published clinical trial where the BDRS has been used as an outcome measure.
This paper reports on the analysis of validity of the BDRS both within items and compared to the YMRS, MÅDRS and HAM-D in a clinical trial population.
Method
In a 24-week double-blind, randomised clinical trial of N-acetylcysteine or placebo for the treatment of depressive symptoms in bipolar disorder, the BDRS was administered to all participants at each of the nine study visits from baseline, assessment visits during the 24-week trial and a discontinuation assessment after a further 4-week washout period. A diagnosis of bipolar I or II disorder was confirmed using the Mini International Neuropsychiatric Interview Reference Sheehan, Lecrubier and Sheehan(9). There were three trial clinicians who conducted the interviews at three different sites. Trial clinicians were trained together at a training session prior to commencing the clinical trial in order to ensure proficiency in administering the BDRS and to minimise the differences in scoring between the raters. Only visit 1 data are used in this scale validation study.
Statistical methods
Factor analyses
Exploratory factor analyses (EFA) were conducted using the unweighted least squares method. Squared multiple correlations were specified as the prior communality estimates and an oblique (Promax) factor rotation was used as dimensions were expected to be correlated. Factors were retained after assessment of the Scree test, the proportion of common variance accounted and the interpretability criteria.
Reliability analyses
Internal consistency reliability was assessed by calculating correlations between each of the 20 items of the BDRS using Cronbach's alpha.
Hierarchical cluster analysis
HCA was performed using Ward's minimum-variance method with the emerging cluster being determined by the least increase in the sum of squared Euclidean distance.
Multidimensional scaling
MDS was considered as an alternative to the EFA where similarities or dissimilarities (distances) between the items on the BDRS were investigated. In order to select the optimal number of dimensions, the Scree test and the interpretability of configuration were used. In addition, the S-Stress level (Stress) was used as a badness-of-fit measure and the R 2 index (RSQ) as a goodness-of-fit measure, both of which range from 0 (perfect fit for the Stress; worst possible fit for the RSQ) to 1 (worst possible fit for the Stress; perfect fit for the RSQ). The Stress <0.2 or RSQ >0.6 is generally acceptable in terms of the data interpretability and information loss Reference Kruskal(10,Reference Kruskal and Wish11).
Associations between measures
Associations between the BDRS and the YMRS, MÅDRS and HAM-D were assessed using Pearson correlations.
All statistical analyses were performed using SAS® Version 9.1.3 for Windows™ (SAS Institute, Cary, North Carolina, USA).
Results
A total of 75 participants were randomised and included in the efficacy analyses; however, 76 participants underwent visit 1 assessments (1 withdrew following the baseline visit), therefore N = 76 at visit 1.
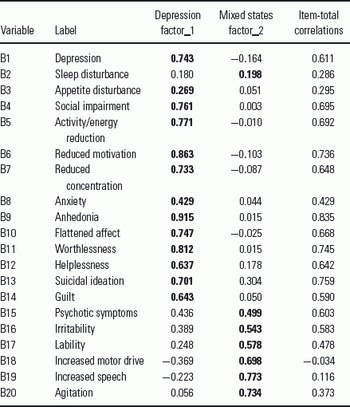
Table 1 shows the factor loadings and the correlations of each individual item with the total BDRS score. The two-factor solution was deemed to be most suitable for this set of data explaining 82% of the variance. In each column, the items with high factor loadings are shown in bold. Two factors were identified. Items 1–16 corresponded to one factor labelled depression and items 17–20 corresponded to a second factor labelled mixed states. Factor loadings are given in Table 1. These results are very similar to those reported in the original validation of the BDRS Reference Berk, Malhi and Cahill(7) which identified three factors: psychological depression corresponding to items 1–3 and 5–7, somatic depression corresponding to items 4, 8–14 and 16, and mixed states corresponding to items 15 and 17–20.
Rotated factor pattern (standardised regression coefficients) for visit 1

The correlations of each item with the BDRS total score are also shown in Table 1 and were significant at the 0.05 level with the exception of item 18 (increased motor drive). This was consistent with previous findings Reference Berk, Malhi and Cahill(7).
Strong internal consistency was observed with the visit 1 Cronbach's alpha coefficient 0.905 (raw) and 0.903 (standardised).
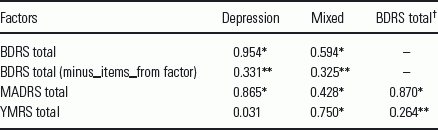
Pearson correlations between the two factors and the BDRS, HAM-D, Montgomery Asberg Rating Scale (MADRS) and YMRS totals are shown in Table 2. The correlation coefficient between the BDRS and the MADRS was strong and positive with a value of 0.87. The correlation of the depression subscale (items 1–15) of the BDRS with the MADRS was high, 0.86. The total BDRS scores, as expected, correlated weakly with the YMRS (0.26), while the mixed subscale items (items 16–20) were more strongly correlated with the YMRS (r = 0.75). The correlation between the two factors was 0.33.
Pearson's correlation between scales based on the two factors (depression and mixed) and the BDRS, HAM-D, MADRS and YMRS totals

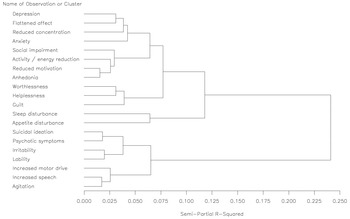
Figure 1 shows the presence of a two-cluster structure for the BDRS. The levels of dissimilarity between items, as measured by the semi-partial R 2, on the horizontal distance are shown. Cluster 1 includes 13 items of depressive symptoms and is almost entirely consistent with the exploratory factor analyses, apart from the inclusion of the somatic item of sleep disturbance and the exclusion of the suicidal ideation. The second cluster includes seven items of mixed symptoms. Findings were similar to Chang et al. Reference Chang, Ahn and Yu(6).
Ward's method dendrogram produced of 20 items on the BDRS (N = 76) for visit 1.

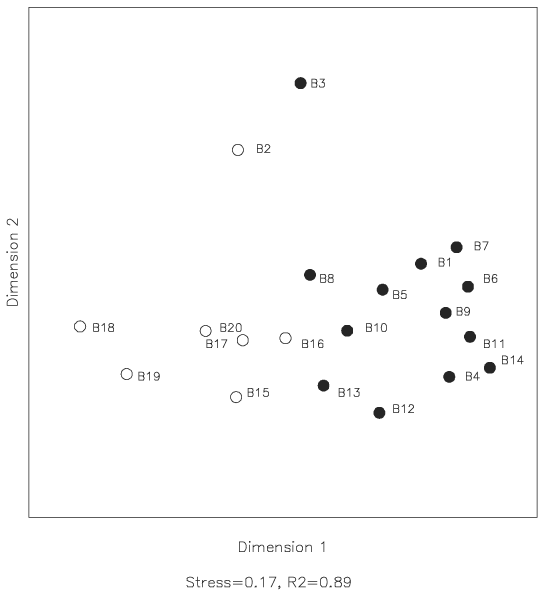
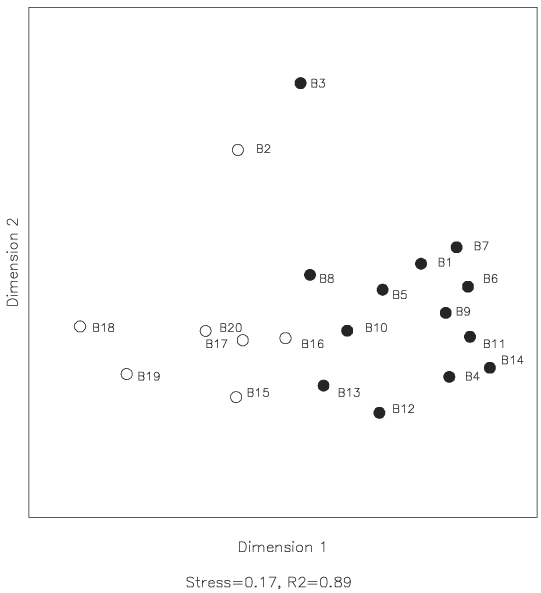
Figure 2 shows the two-dimensional (depression and mixed clusters) scatter plot of the MDS solutions for the items of the BDRS. The 2D solution was supported by the stress and R 2 measures and was consistent with the two-factor solution of the exploratory factor analyses. The cluster of items depicted for both the depression and mixed states closely related to what was observed for the EFA factor loadings.
Representation of the relationship of the two dimensions (depressive cluster and mixed states cluster) between the 20 items of the BDRS (N = 76) at baseline. The depressive cluster and mixed cluster are indicated by black dots and the white dots, respectively. B1, depressed mood; B2, sleep disturbance; B3, appetite disturbance; B4, reduced social engagement; B5, reduced energy and activity; B6, reduced motivation; B7, impaired concentration and memory; B8, anxiety; B9, anhedonia; B10, affective flattening; B11, worthlessness; B12, helplessness and hopelessness; B13, suicidal ideation; B14, guilt; B15, psychotic symptoms; B16, irritability; B17, lability; B18, increased motor drive; B19, increased speech; B20, agitation.
Discussion
Validation data from participants in the clinical trial were consistent with what was previously reported in the original validation of the BDRS conducted in a patient cohort Reference Berk, Malhi and Cahill(7). Cronbach's alpha coefficient was very similar to the score of 0.917 reported in the earlier study. The two-factor solution reported in this study overlapped closely with the three-factor solution reported in the earlier study Reference Berk, Malhi and Cahill(7) and was similar to the two-factor solution of Chang et al. Reference Chang, Ahn and Yu(6). Depressive and mixed clusters have been clearly identified in all three studies. The depressive cluster was further divided into depressive (somatic) and depressive (psychological) clusters in the earlier study Reference Berk, Malhi and Cahill(7). Both MDS and HCA revealed consistent results with EFA and confirmed findings from previous work.
In the context of the trial, the BDRS was simple to administer, time effective and was useful and sensitive for severity of depression in bipolar disorder and was sensitive to change. It worked well within the battery of outcome measures administered to study participants by trial clinicians at interview. It compares well with the HAM-D and MÅDRS for ease of administration and time to administer. A significant difference in BDRS score between N-acetylcysteine and placebo treated participants was measured at 24 weeks (p = 0.012) Reference Berk, Copolov and Dean(8), confirming the usefulness of the BDRS in the clinical trial. The scale appeared to be sensitive to change.
Conclusion
The BDRS has been shown to have internal consistency and to be a useful measure to assess the outcomes of clinical studies of bipolar disorder. It has been shown to accurately measure the severity of bipolar depression. It is a simple scale to administer, is time effective and allows for high levels of inter-rater reliability. The BDRS is sensitive to change and given its high correlation to the MADRS and HAM-D (currently the most wide-spread primary outcome measures for bipolar depression) is suitable as a primary or secondary outcome measure in clinical studies of bipolar depression.
We wish to thank Alan Brnabic for his assistance in preparing this manuscript.