The first witness
Simply stated, fossils are the historic phenomena of life. All visible forms of life which neither move nor respond to stimuli may therefore be regarded as ‘fossils’. The same broad term can also be used to cover biological waste products or traces of biological activity such as rock borings. Where a microscope is needed for study and bulk collecting is required then these phenomena can be likewise regarded as ‘microfossils’ (Brasier Reference Brasier1980; Armstrong & Brasier Reference Armstrong and Brasier2004). Thus defined, we can see that the discipline of fossil studies ranges very widely indeed from the death and decay of modern bacterial cultures (microtaphonomy; e.g., reviews in Seckbach & Oren Reference Seckbach and Oren2010; Allison & Bottjer Reference Allison and Bottjer2011) all the way back to the earliest signs of life (geomicrobiology; e.g., Konhauser Reference Konhauser2007).
So what can fossils possibly tell us about exobiology – the search for life beyond Earth? Our definition above implies that almost all the signals we might plan to gather about life beyond Earth – be it from robotic missions or physical spectra – will invariably have a historic character, varying in length of transmission time from minutes to many billions of years. By its very nature, therefore, exobiology must involve a study of fossils, albeit of a special kind. A second strong reason for importance in the study of fossils concerns the preservation of signals. Living objects are by their very nature fleeting. Our chances of encountering alien life in living form may be very small. More likely are encounters with dead remains, or with metabolic waste products, both of which can be regarded as ‘fossils’ (a term that literally means anything ‘dug up’ from the ground). That is because dead and fossilized remains, and the waste products of cells, can endure across the vastness of geological time.
Most signs of life in the universe will arguably, therefore, take the form of chemical and morphological fossils. But while chemical analyses are bound to be major contributors in this endeavour, chemical signals alone will not be well placed to answer those astrobiological questions after which the public hunger most. What did remote life look like? Where did it live? And how did it feed and behave? Morphological fossils that can be tested chemically are therefore likely to provide our most reliable answers to questions about life in the remote corners of time and space. And it is upon these that we focus here.
The study of life remote in space will likely share many features with the study of life remote in time, as briefly outlined above. First among these shared problems is the one we here call ‘the problem of data restoration’. It concerns the challenge of working with very incomplete data sets – the so-called ‘epistemological challenge’ presented by the early fossil record (see discussions in Rose et al. Reference Rose, McLoughlin, Brasier and Seckbach2006; Antcliffe & McLoughlin Reference Antcliffe, McLoughlin, Seckbach and Walsh2009).
Data restoration
Much information that we would deem desirable has been filtered out during the processes of transmission across vast distances of space, or time or (as is likely on Mars) across both space and time. In the case of biosignals being sought on the surface of Mars, for example, huge problems are presented by the physical processes of sampling, data retrieval and data transmission back to Earth (e.g., Walter Reference Walter1999; Gilmour Reference Gilmour2003). In the case of the early fossil record, we likewise face the problem of distortion. Most obvious here is the distortion of selective fossilization, followed by that of selective destruction by metamorphism, by weathering and then by erosion. The oldest rocks with the earliest possible records of life are therefore very rare (for overview, see Wacey Reference Wacey2009), often remote, and possibly unrepresentative of the original suite of habitats. In each case, therefore, we are obliged to assemble a full picture from just a few, filtered, pieces of the jig-saw puzzle.
Success in this field therefore requires a powerful insight into the ways in which the world works today. A strong intuition is needed concerning the ways in which planet Earth has evolved through geological time (e.g., see Knoll Reference Knoll2003). This approach undoubtedly benefits from generous amounts of field work. Not least of the problems is the need to contemplate ways in which other worlds might work now, or have worked in the distant past, and on how thinking upon such worlds has changed greatly through time (e.g., Dick & Strick Reference Dick and Strick2005). All this requires us to foster creativity, and to aim towards a deeper geological – and astrobiological – intelligence. It is often said that a geologist is only as good as the number of rocks that he/she has examined around the world. For astrobiology, where the setting is universal, an even larger caveat is likely to apply.
All this leads towards the first great axiom for studies of life remote in time and space: the demonstration of a viable context for life.
Viable context for life
A key tenet of studies into ancient fossils has always been that ‘context is king’. Without a proper understanding of both the environmental context for any given claim for remote life, and its placement within a historic trajectory, it can be said that the plausibility of any such claim deserves to be deeply questioned, or even rejected. It was the lack of context, for example, that dealt a mortal blow to the ∼3.47 Ga ‘Awramik’ microfossils of Western Australia (Awramik et al. Reference Awramik, Schopf and Walter1983), when it was admitted that neither their location nor their setting were known (e.g., Schopf Reference Schopf1999).
And a comparable problem later bugged those putative microfossils from the nearby ∼3.46 Ga Apex Chert (e.g., Brasier et al. Reference Brasier, Green, Jephcoat, Kleppe, Van Kranendonk, Lindsay, Steele and Grassineau2002). The latter were once suggested to come from a surface habitat such as a beach or stream (Schopf Reference Schopf1999) but were later found to derive from rocks >100 m below the palaeosurface, within the complex fabrics of metaliferous hydrothermal veins (Brasier et al. Reference Brasier, Green, Jephcoat, Kleppe, Van Kranendonk, Lindsay, Steele and Grassineau2002, Reference Brasier, Green and Mcloughlin2004, Reference Brasier, Green, Lindsay, McLoughlin, Steele and Stoakes2005, Reference Brasier, Green, Lindsay, McLoughlin, Stoakes, Brasier and Wacey2011c; Pinti et al. Reference Pinti, Mineau and Clement2009; Olcott Marshall et al. Reference Olcott Marshall, Emry and Marshall2012). Such a confused setting contrasts markedly with that of candidate microfossil assemblages from the ∼3.43 Ga Strelley Pool Sandstone of Western Australia (Wacey et al. Reference Wacey, Kilburn, Saunders, Cliff and Brasier2011b), whose shoreline context has long been recognized (Buick et al. Reference Buick, Thornett, McNaughton, Smith, Barley and Savage1995) and latterly mapped out in detail (Wacey et al. Reference Wacey, McLoughlin, Green, Parnell, Stoakes and Brasier2006, Reference Wacey, McLoughlin, Stoakes, Kilburn, Green and Brasier2010b).
Context matters greatly in such debates because it allows one to test, for example, whether any candidate biogenic signals might be reinterpreted as abiogenic mimics or contaminants (Table 1), or whether they could have formed in a setting beyond the habitable zone for life. There is a need to keep an open mind about our limited levels of understanding about the habitable zone for early or remote life, of course. Three decades ago, no scientist would have thought to look for signs of early or primitive life around marine hydrothermal vents (Jannasch & Mottl Reference Jannasch and Mottl1985; Martin & Russell Reference Martin and Russell2007), or within non-marine hot springs (Mulkidjanian et al. Reference Mulkidjanian, Bychkov, Dibrova, Galperin and Koonin2012), or within basalts deep below the seafloor (Furnes et al. Reference Furnes, Staudigel, Thorseth, Torsvik, Muehlenbachs and Tumyr2001), or even inside early quartz sandstones (Wacey et al. Reference Wacey, Kilburn, Saunders, Cliff and Brasier2011b) and pumice lavas (Brasier et al. Reference Brasier, Matthewman, McMahon and Wacey2011b). Our perspective has therefore expanded greatly in recent years, and few settings are now barred from investigation (a brief introduction to these settings is given by Brasier et al. Reference Brasier, Wacey, McLoughlin, Allison and Bottjer2011a). One might speculate, of course, that the diversity of metabolic pathways and the reach of the habitable zone have both expanded continuously across our planet over the last four billion years or so, implying that the habitable zone was initially much less than now. The fossil record and its context is arguably the only way that expansion in the habitable zone through time can ever be tested and revealed. That may sound surprising, but there are three reasons why scientists should not expect to achieve this from a study of living microbes alone. First, a constant trade in lateral gene transfer may well have muddled their picture too greatly (e.g., Doolittle Reference Doolittle2000). Second, extinction of genomes over billions of years has likely removed much of the requisite evidence (e.g., Brasier Reference Brasier2012). Third, all modern microbes may be argued to have morphologies and metabolisms that are best adapted to a world filled with complex eukaryotes. There is therefore no good reason to suspect that our favourite modern microbes have survived unchanged from far back in time (for an interesting review, see Rickards Reference Rickards2012).
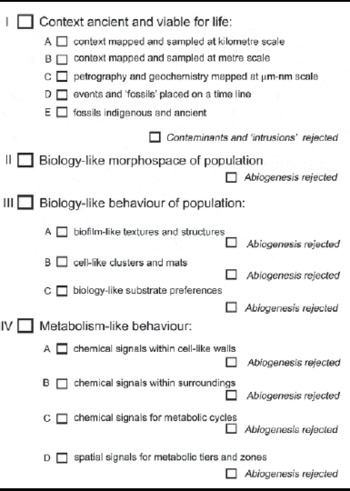
Our protocol sheet for proving claims of early fossil life. The criteria from I to IV are discussed in the sections below. According to our field and laboratory studies thus far, cell-like structures from the ∼1.9 Ga Gunflint Chert (e.g., Barghoorn & Tyler Reference Barghoorn and Tyler1965; Knoll Reference Knoll2003) should be able to tick most of the boxes down to criterion IV-D; cell-like structures from the ∼3.43 Ga Strelley Pool sandstone (Wacey et al. Reference Wacey, Kilburn, Saunders, Cliff and Brasier2011b) can arguably tick boxes down to criterion IV-B; but cell-like structures from the ∼3.46 Ga Apex chert (Brasier et al. Reference Brasier, Green, Lindsay, McLoughlin, Stoakes, Brasier and Wacey2011c) can only tick boxes down to I-E. These rankings may change with further work

The meaning of ‘viable’ in terms of context will no doubt be debated for decades. But the need for a plausibly decoded context cannot be set aside without risk. For without a plausibly decoded geological context, no candidate for early life can pass the biogenicity test. By ‘plausible’ here, we mean that fossil candidates can be tested against a time-line that encompasses major events involved in host rock lithogenesis, alteration, erosion and weathering, at scales from geological mapping (kilometre scale) down to fabric mapping (micrometre to nanometre scale). In Table 1, we show our suggested protocol sheet for testing claimants in the early fossil record. This is the protocol we have recently applied to the ∼3.46 Ga Apex Chert (Brasier et al. Reference Brasier, Green, Lindsay, McLoughlin, Stoakes, Brasier and Wacey2011c) and also the ∼3.43 Ga Strelley Pool Formation (Wacey et al. Reference Wacey, McLoughlin, Stoakes, Kilburn, Green and Brasier2010b). Our hope is that such a formula will help to bring many studies of ancient fossil candidates up to the highest possible level of contextural understanding.
Contextural mapping is not, of course, a quick or simple undertaking. And even when the stringent requirements can be met, a second major hurdle then presents itself: do the candidate fossil materials display geometries consistent with living matter? This question brings us directly to the next and central axiom, that of cell morphospace.
Cell morphospace
According to Cell Theory, all of life is cellular (see Hardin et al. Reference Hardin, Bertoni and Kleinsmith2011; and review in Brasier Reference Brasier2012). That is because a cell membrane provides a simple, easily achieved and effective barrier, a transport system, and a compartment within which homoeostasis can be maintained (e.g., Deamer et al. Reference Deamer, Dworkin, Sandford, Bernstein and Allamandola2002). Many would argue, therefore, that life and cellular organization will go hand-in-hand throughout the universe. If that argument is accepted (and it seems plausible), then astrobiology can surely learn some valuable lessons from decades of research into the earliest cellular fossil record on Earth. Below, we therefore discuss our three main criteria for the biological origin of fossilized cells: cell morphospace, biological behaviour and metabolic behaviour. Ideally, each of these items needs to be present before a cell-like structure can be accepted as being of biological origin.
A prime criterion for life is arguably the presence of a cell-like morphospace. Definition of this morphospace must build upon our familiarity with the myriad forms of cellular architecture, coupled with an understanding of the numerous ways in which abiogenic signals can closely mimic biogenic ones. Early life science is replete with cases of mistaken identity and it may be interesting to recall a few of these here. First of all, we may respect the errors made by Charles Darwin in admitting a curious fossil structure called Eozoon into his 1871 edition of the Origin of Species (Darwin Reference Darwin1871). This structure was indeed truly ancient – well over 1 billion years old – but its resemblance to the growth of living foraminiferid protozoans was illusory. Eozoon turned out to be the product of crystal segregation during high-grade thermal metamorphism (see Hofmann Reference Hofmann1971 for overview; see also Brasier Reference Brasier2009). Such structures are now regarded as ophicalcites. These kinds of problem have arisen repeatedly, so that many of the best geoscientists have also made such mistakes. When the 1.9 Ga old Gunflint Chert microbiota was first reported and illustrated (Tyler & Barghoorn Reference Tyler and Barghoorn1954), many of the specimens described were not genuine microfossils – they were mineral growths. These errors were mercifully, corrected a decade later (Barghoorn & Tyler Reference Barghoorn and Tyler1965; reviewed in Brasier Reference Brasier2012). But a similar mournful mistake was repeated with the so-called ‘microfossils’ in the Martian meteorite ALH 84001 (McKay et al. Reference McKay, Gibson, Thomas-Keprta, Vali, Romanek, Clemett, Chillier, Maechling and Zare1996), as criticized in some detail by Schopf (Reference Schopf1999). And then a similar mistake was arguably repeated with the so-called ‘microfossils’ from the 3.46 Ga Apex Chert from Australia (Schopf Reference Schopf1993), as latterly concluded by Brasier et al. (Reference Brasier, Green, Jephcoat, Kleppe, Van Kranendonk, Lindsay, Steele and Grassineau2002, Reference Brasier, Green, Lindsay, McLoughlin, Steele and Stoakes2005, Reference Brasier, Green, Lindsay, McLoughlin, Stoakes, Brasier and Wacey2011c), Pinti et al. (Reference Pinti, Mineau and Clement2009), Marshall et al. (Reference Marshall, Emry and Olcott Marshall2011) and Olcott Marshall et al. (Reference Olcott Marshall, Emry and Marshall2012).
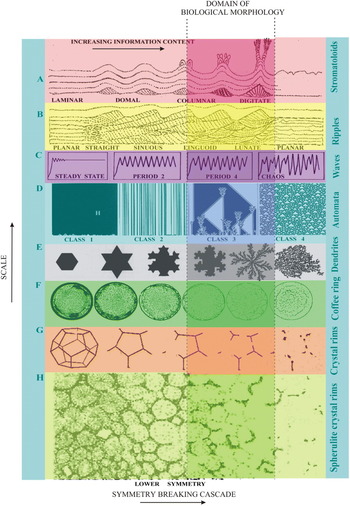
The problem here is that physico-chemical processes can readily produce structures that mimic biogenic ones. One need only think here of moss-like mineral growths called dendrites (see Ball Reference Ball1999, Reference Ball2009) that produce filamentous pseudofossils in hydrothermal settings (e.g., Hopkinson et al. Reference Hopkinson, Roberts, Herrington and Wilkinson1998) or of microscopic rounded mineral growths termed spherulites, which produce cell-like spheres within silica deposits (Figs. 1 and 2; Brasier et al. Reference Brasier, McLoughlin, Green and Wacey2006). Even cell-like tetrads can be formed abiogenically, as within iron oxides in methane seeps (e.g., Bailey et al. Reference Bailey, Raub, Meckler, Harrison, Rauub, Green and Orphan2010). Sand dunes and stromatolites provide further examples of such abiogenic self-organized structures or SOS (Fig. 1), as we discuss further below. Many of these mimics emerge from a process of symmetry breaking in which symmetry is lost and information is gained as a system grows (e.g., Bak Reference Bak1997; Ball Reference Ball1999, Reference Ball2009; Brasier et al. Reference Brasier, McLoughlin, Green and Wacey2006).
(Colour online available at http://journals.cambridge.org/IJA) The range of self-organizing structures (SOS) that can arise naturally in physico-chemical systems within the realms of chaotic behaviour. Symmetry is lost as one moves to the right but morphological complexity increases. The size of the SOSs decreases down the figure. In well preserved and true microfossil assemblages, the morphological variation is usually less than co-occurring abiogenic structures and so will occupy a more restricted domain (shaded ‘domain of biological morphology’) within the morphospace. A, stromatolites; B, sedimentary ripples; C, Verhulst bifurcations; D, Wolfram's self-organizing digital automata; E, Koch crystals and dendrites (e.g. hematite); F, coffee-ring effects; G, crystal rims (e.g., quartz, barite, pyrite); H, spherulites (e.g., impure silica; all modified from Brasier et al. Reference Brasier, McLoughlin, Green and Wacey2006).

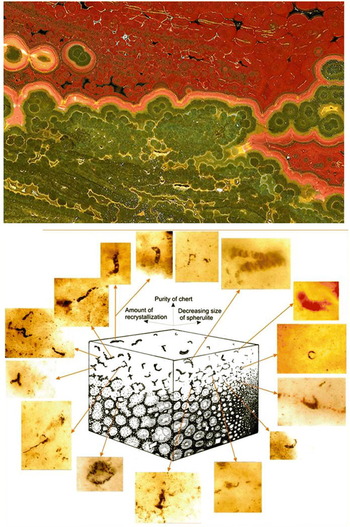
(Colour online) A morphospace for spherulitic fabrics, which very closely mimic cellular microfossils. At top is shown a volcanic (rhyolitic) lava from the Cretaceous of Madagascar that has recystallized into red and green jasper, with agate-like botryoidal fronts between. Equally prominent are the secondary spherulites of silica (best seen in the green zone) and microfossil-like arcuate rims (best seen as white and black wisps in the red zone at top). Below is shown a morphospace for such spherulites, in which their appearance varies in relation to the amount of recrystallization, the size of the spherulites, and the purity of the chert. The 15 micrographs scattered around this morphospace diagram shows much of the populational range to be found within the Apex chert ‘microfossils’ (after Brasier et al. Reference Brasier, Green, Lindsay, McLoughlin, Stoakes, Brasier and Wacey2011c). All of these forms are readily mapped onto this abiogenic, spherulitic morphospace.

Self-organized structures therefore push us unhappily towards the need for a strong null hypothesis:
‘that candidate fossil structures older than ∼3.0 Ga should not be accepted as of biological origin until all plausible explanations of their non-biological origin have been tested and falsified’ (Brasier et al. Reference Brasier, Green, Jephcoat, Kleppe, Van Kranendonk, Lindsay, Steele and Grassineau2002, Reference Brasier, McLoughlin, Green and Wacey2006, Reference Brasier, Green, Lindsay, McLoughlin, Stoakes, Brasier and Wacey2011c).
Every population of living or fossil cells, and every population of abiogenic crystals, may therefore be envisaged as occupants of a theoretical 3D morphospace (e.g., Fig. 2). The assumption here is that biological occupation of a morphospace is not unlimited but instead is constrained by genetic controls and the feasible limits of cell biology. If so, then variability in terms of cell length, width and arrangement should be envisaged as occupying a very distinctive and limited part of a given morphospace. In contrast, an abiological morphospace cannot – by definition – be genetically constrained, meaning that processes resulting from abiogenesis may well occupy a larger and probably rather different part of a given morphospace (Table 1, criterion II). That, at least, is the theory, but there is now an urgent need to test such concepts against reality and against mathematical models too. There are clearly reasons to be cautious here as well. For example, there is the problem that protocells, or primitive cellular life, might well have occupied a morphospace that was remarkably elastic, approaching that of some abiogenic systems. Then there is the problem that some mineral systems might be constrained by physical conditions in such a way that their sizes and shapes have been restricted, so that they come to resemble fossilized cells. A classic case here is that of the microtubes, called ambient inclusion trails, that can be left behind by sulphide grains that move through a mineral matrix under gaseous pressure (Tyler & Barghoorn Reference Tyler and Barghoorn1963; Wacey et al. Reference Wacey, Kilburn, McLoughlin, Parnell, Stoakes and Brasier2008). These can look remarkably like the moulds of cyanobacteria or be mistaken for bona fide microborings, yet their origin remains enigmatic and may be abiotic. Comparable structures have been reported from a C11 carbonaceous meteorite by Hoover (Reference Hoover2011) and may well be explained in such a way.
A further important requirement for morphospace analysis is the need for populational studies. We would argue that no unusual claim for life from a very remote time period, or from a very remote place, should be accepted by the scientific community unless it forms part of a natural population of structures that can be systematically studied. These populations will then need to be placed within an appropriate morphospace, and shown to be distinct in character from any abiogenic mimics that might be expected to occur within the same kind of setting (Table 1, criterion II). Although such tests have hitherto been mainly qualitative (e.g., Wacey et al., Reference Wacey, Kilburn, Saunders, Cliff and Brasier2011b), there is an urgent need to explore quantitative approaches (e.g., Corsetti & Storrie-Lombardi Reference Corsetti and Storrie-Lombardie2003; Brasier et al. Reference Brasier, McLoughlin, Green and Wacey2006, table 2), so that early life claims may be more objectively tested. Even so, numerical tests of biological morphospace must then be able to filter out the noise produced by mineral growths during the processes of fossilization, metamorphism and weathering. That will not be easy to achieve, except in rare cases of pristine preservation, such as those from the ∼1.9 Ga Gunflint Chert at Schreiber Beach, Ontario (Barghoorn & Tyler Reference Barghoorn and Tyler1965) or the equally fine ∼1.0 Ga Torridon microfossils of northwest Scotland (e.g., Strother et al. Reference Strother, Battison, Brasier and Wellman2011). There also remains the need for candidate cell-like structures to be supported by a very important and well-studied criterion: that of biological patterns of behaviour (Table 1, criterion III), as we discuss below.
Biology-like behaviour
The list of biology-like behaviour patterns is rather extensive, but we will pick out three salient examples here: association with biofilm-like structures; tendency to form clusters and ‘mats’; and a preference for certain substrates.
Biofilm-like structures (Table 1, criterion III-A)
One of the main search images for life in the early fossil record has involved the quest for biofilm-like textures and structures. Biofilms typically involve exudates and waste products (‘extracellular polymeric substances’ or EPS), mainly produced today by prokaryote cells, which serve to bind the community together, and to protect it from desiccation, radiation damage or other physical stress (e.g., Krumbein et al. Reference Krumbein, Paterson and Zavarzin2003). These biofilms may even become organized into cabbage-like growths called stromatolites by a process of sediment trapping, binding and chemical cementation (see Walter Reference Walter1976; Reitner et al. Reference Reitner, Queric and Arp2011). Some of the oldest known examples of stromatolites include those of the 3.43 Ga Strelley Pool Formation at the Trendall locality in Western Australia (e.g., Allwood et al. Reference Allwood, Walter, Kamber, Marshal and Burch2006). However, a major problem here is that nearly all of the macroscopic features of such stromatolites can be mimicked by abiological processes (McLoughlin et al. Reference McLoughlin, Wilson and Brasier2008; Brasier Reference Brasier, Golding and Glikson2010) meaning that demonstration of biogenicity now requires microfabric analysis (Riding Reference Riding, Reitner, Queric and Arp2011) and/or geochemistry. Since this new requirement differs so little from other potential witnesses (e.g., laminar mats, wrinkle mats, soils, ooids and nodules), stromatolites can, regrettably, no longer be regarded as superior clues to the deep history of life.
Biofilms may also assist in construction of the colloquially named wrinkle mats and elephant skin textures, resulting in a wide range of microbially induced sedimentary structures (MISS) in siliciclastic deposits (see Noffke Reference Noffke2010 for a comprehensive review and a list of stringent criteria). Examples of MISS are now known from 3.2 Ga coastal silicilastic sediments of South Africa (Noffke et al. Reference Noffke, Eriksson, Hazen and Simpson2006), broadly associated with cell-like carbonaceous structures (Javaux et al. Reference Javaux, Marshall and Bekker2010), and also from 1.0 Ga old lake beds in Scotland (Callow et al. Reference Callow, Battison and Brasier2011) associated with diverse cell morphotypes (Strother et al. Reference Strother, Battison, Brasier and Wellman2011). These MISS provide a promising avenue for future research. However, there is a pressing need for future work to focus less upon cyanobacterial tidal mats and uniformitarian process, and more upon other kinds and other process, such as those of anoxygenic phototrophs, iron bacteria, sulphur bacteria, osmotrophic and aphotic mats in both modern and ancient settings (e.g., Brasier et al. Reference Brasier, Callow, Menon, Liu, Seckbach and Oren2010).
Microbially influenced cements may themselves be regarded as ‘organominerals’ (Perry et al. Reference Perry2007), which formed in the manner of waste products. Microbially induced cements on Earth commonly include calcium carbonate, calcium phosphate, iron oxide (ironstone), iron carbonate and iron sulphide (see Konhauser Reference Konhauser2007; Rickards Reference Rickards2012). Early carbonate soils known as calcretes should also be included here since they have shown a marked evolutionary change in texture through deep time (Brasier Reference Brasier2011). Ideally, such mineral growths and waste products may form coatings around cell-like fossils, or occur as internal casts of the cell-like lumens, or as replicas of the whole structure. Even so, their biogenicity must then be tested by studies of chemical composition and of stable isotope fractionations consistent with biology (e.g., Kilburn & Wacey Reference Kilburn, Wacey, Seckbach and Tewari2011; Wacey et al. Reference Wacey, Kilburn, Saunders, Cliff and Brasier2011b).
Cell clusters and ‘mats’ (Table 1, criterion III-B)
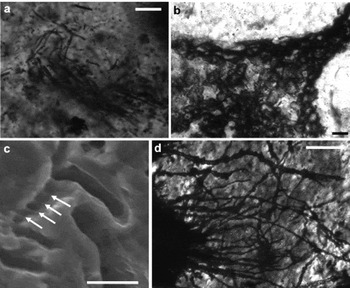
A further feature to look out for is the natural tendency for cell-like structures to be clustered together in the form of ‘microbial mats’. Intertwined filaments and geometrical blocks of spheroids that are concentrated within a specific layer, may resemble the kind typically encountered within modern and fossil microbial communities. A famous example of this can be seen in the 1.9 Ga Gunflint Cherts of Ontario (Fig. 3a) but there are reasons to be cautious here too. Filaments such as clusters of abiogenic mineral growths can also form within hydrothermal settings (e.g., Hopkinson et al. Reference Hopkinson, Roberts, Herrington and Wilkinson1998) meaning that morphospace tests may be required to help distinguish biological clusters from abiological dendrites (cf., Ball Reference Ball1999, Reference Ball2009). The testing of such distinctions may provide another promising avenue for future research.
Examples of biology-like patterns of behaviour. (a) Clustering and intertwining of filaments in the form of a ‘microbial mat’, 1.9 Ga Gunflint Formation, Canada. (b) Colonization of the outsides of sediment grains, 3.43 Ga Strelley Pool Formation, Australia. (c) Traces of carbon- and nitrogen-lined microbial pits on a detrital pyrite grain, 3.43 Ga Strelley Pool Formation, Australia (modified from Wacey et al. Reference Wacey, Saunders, Brasier and Kilburn2011a). (d) Titanite-filled microborings within the outer layers of volcanic glass, 3.35 Ga Euro Basalt, Australia (image courtesy of Nicola McLoughlin). Scale bars are 20 μm for a; 20 μm for b; 5 μ m for c; and 25 μm for d.

Biology-like substrate preferences (Table 1, criterion III-C)
Lastly, there is a need to check for biology-like preferences towards certain kinds of substrate. A common axiom of microbiology is that microbial life typically flourishes and concentrates along interfaces, typically on sediment surfaces and upon mineral grains along those surfaces (e.g., Varnam & Evans Reference Varnam and Evans2000). Ancient and remote biology may therefore be found to show a tendency towards attachment onto the outsides of sediment grains, much as with living and fossil epilithic bacteria (Fig. 3b; Wacey et al. Reference Wacey, Kilburn, Saunders, Cliff and Brasier2011b). Another substrate-related feature is that of microborings into specific materials, such as found within iron sulphide grains (Fig. 3c; Wacey et al. Reference Wacey, Saunders, Brasier and Kilburn2011a), or within volcanic glass (Fig. 3d; Furnes et al. Reference Furnes, Banerjee, Staudigel, Muehlenbachs, McLoughlin, de Wit and Van Kranendonk2007), which also adopt the shape and chemistry of endolithic bacteria (see McLoughlin et al. Reference McLoughlin, Brasier, Wacey, Green and Perry2007 for criteria). Even so, their formation from likely abiogenic phenomena, such as ambient inclusion trails (e.g., Wacey et al. Reference Wacey, Kilburn, McLoughlin, Parnell, Stoakes and Brasier2008) or other forms of etch-pitting, needs to be tested and falsified here. Biological examples, for example, should ideally preserve biology-like chemistry of some kind (e.g., Wacey et al. Reference Wacey, Saunders, Brasier and Kilburn2011a).
Even though the environmental context may seem viable, and cell-like morphologies and biology-like patterns of behaviour may be demonstrated, it is never going to be 100% certain that ancient and remote cell-like structures have been generated biogenically. There is therefore a clear need for yet another test. And it is this fourth test of metabolism-like behaviour (Table 1, criterion IV) that is currently advancing most rapidly within the field of remote life studies.
Metabolism-like behaviour
This line of enquiry will ideally proceed in parallel with the tests outlined above, and the searches can be broken down into four main steps, broadly as follows: chemical signals within cell-like walls; chemical signals within cell surroundings; chemical signals for metabolic cycles (syntrophy); and spatial signals for metabolic tiers and zones.
Chemical signals within the cell-like wall (Table 1, criterion IV-A)
Where candidate cell walls are preserved, it is desirable to test for a chemical composition consistent with a metabolic pathway. Ideally, in earthly fossils, this will include evidence not only for carbonaceous compounds enriched in the light isotope 12C (e.g., House et al. Reference House, Schopf, McKeegan, Coath, Harrison and Stetter2000), but also containing other constructional elements such as hydrogen, oxygen, nitrogen and sulphur or phosphorus (Oehler et al. Reference Oehler, Robert, Mostefaoui, Meibom, Selo and McKay2006). An example of this is evidence for enrichment in nitrogen found within 3.43 Ga cells of the Strelley Pool Formation (Wacey et al. Reference Wacey, Kilburn, Saunders, Cliff and Brasier2011b). Unfortunately, such chemical tests are far from being a safe criterion for cellular organization when used alone (e.g., Schopf et al. Reference Schopf, Kudyatsev, Sugitani and Walter2010). Pseudofossils can also be built from degraded organic matter (Brasier et al. Reference Brasier, Green, Jephcoat, Kleppe, Van Kranendonk, Lindsay, Steele and Grassineau2002; De Gregorio & Sharp, Reference De Gregorio and Sharp2006). This approach therefore needs to be supplemented by other tests, including the search for chemical signals within small mineral grains in the immediate surroundings of candidate cells (Table 1, criterion IV-B), as outlined below.
Chemical signals within cell surroundings (Table 1, criterion IV-B)
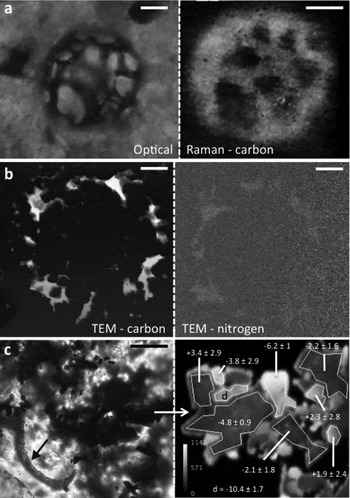
This criterion involves the search for waste products and chemical influences consistent with biology-like metabolism. Rather promising here is the search for very localized and significant patchiness in sulphur isotope values (Wacey et al. Reference Wacey, McLoughlin, Whitehouse and Kilburn2010a, Reference Wacey, Kilburn, Saunders, Cliff and Brasier2011b). Other stable isotopic suites, such as those for nitrogen and iron, are also likely to prove useful (e.g., Anbar Reference Anbar2004; Van Zuilen et al. Reference van Zuilen, Mathew, Wopenka, Lepland, Marti and Arrhenius2005; Archer & Vance Reference Archer and Vance2006). Such analyses now employ suites of accurate and high spatial resolution instrumentation, such as laser Raman spectroscopy (see Schopf et al. Reference Schopf, Kudryavtsev, Agresti, Czaja and Wdowiak2005 for details), transmission electron microscopy (TEM; see Williams & Carter Reference Williams and Carter2009 for details), nano-scale secondary ion mass spectrometry (NanoSIMS; see Kilburn & Wacey Reference Kilburn, Wacey, Seckbach and Tewari2011 for details), and ion microprobes capable of high precision isotopic analysis (see Orphan & House Reference Orphan and House2009 for details). When used in combination (but, ideally, not in isolation), such techniques can provide for relatively robust in situ morphological and chemical evidence about fossil cells. For example, it is now possible to produce chemical maps of morphological features at the micron-scale using laser Raman (Fig. 4a; e.g., Schopf & Kudryavtsev Reference Schopf and Kudryavtsev2005, Reference Schopf and Kudryavtsev2009). This not only tests for the presence of features with biology-like chemistry but can also potentially test for contaminant-like chemistry. Going a step further, it is feasible to map the elemental composition of single putative microfossils on the sub-micron scale (using NanoSIMS and/or TEM; e.g., Oehler et al. Reference Oehler, Robert, Mostefaoui, Meibom, Selo and McKay2006; Wacey et al. Reference Wacey, Kilburn, Saunders, Cliff and Brasier2011b), and then to investigate any interactions between candidate cell walls and the minerals that fossilized them (Fig 4b; Wacey et al. Reference Wacey, Kilburn, Saunders, Cliff and Brasier2011b, Wacey, D., et al.'s Reference Wacey, Menon, Green, Gerstmann, Kong, McLoughlin, Saunders and Brasier2012 private communication). It is also now possible to trace the fractionation of biologically important isotopes such as carbon and sulphur at the micrometre-scale (using ion microprobes), which may reveal which metabolic pathways the candidate microbes employed (Fig. 4c; House et al. Reference House, Schopf, McKeegan, Coath, Harrison and Stetter2000; Ueno et al. Reference Ueno, Isozaki, Yurimoto and Maruyama2001; Philippot et al. Reference Philippot, van Zuilen, Thomazo, Farquhar and Van Kranendonk2007; Wacey et al. Reference Wacey, McLoughlin, Whitehouse and Kilburn2010a).
Examples of high-spatial-resolution chemical mapping of metabolic behaviour. (a) Optical photomicrograph plus laser Raman map of carbon from a microfossil within the ∼1.0 Ga Torridon Group, Scotland. (b) Energy-filtered TEM maps of carbon and nitrogen from one of the cell walls pictured in Fig. 2a, from the 1.9 Ga Gunflint Formation, Canada. (c) Microfossil (arrowed) associated with tiny pyrite grains from the 3.43 Ga Strelley Pool Formation, Australia – right-hand image shows the sulphur isotope composition of the associated pyrite grains from a 12 × 12 μm area. Scale bars are 10 μm for a; 500 nm for b; 20 μm for c.

Chemical signals for metabolic cycles (Table 1, criterion IV-C)
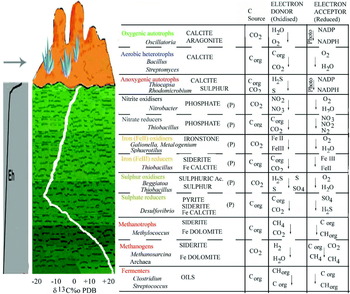
Evidence for a single metabolic pathway, such as that for carbon isotope fractionation, should not, on its own, be enough to confirm biogenicity because simple abiotic processes that fractionate carbon might also be anticipated in a prebiotic world (e.g., Brasier et al. Reference Brasier, Green, Lindsay, McLoughlin, Steele and Stoakes2005). Functioning microbial systems are, today, typically coupled in such a way that a cycle of electron donors and electron acceptors can be recognized (Fig. 5; e.g., Konhauser Reference Konhauser2007). Ideally, therefore, we should be looking for interlinked metabolic pathways, such as those consistent with both carbon fixation (autotrophy) and carbon respiration (heterotrophy), or with sulphate reduction coupled with sulphide oxidation (e.g., Wacey et al. Reference Wacey, McLoughlin, Whitehouse and Kilburn2010a, Reference Wacey, Saunders, Brasier and Kilburn2011a, Reference Wacey, Kilburn, Saunders, Cliff and Brasierb). That at least, is the aim, though it has barely been attempted in the early fossil record as yet.
(Colour online) A diagram showing how modern bacterial groups may form themselves into vertically stacked tiers within a sediment profile. A late Precambrian seafloor is here reconstructed in orange, replete with stromatolitic domes and abiogenic seafloor crystal fans (in blue). The sediment beneath (shown in green) becomes increasingly depleted in oxygen, bringing about a lower relative Eh (roughly sketched at left). Carbon isotopes (white line) measured in ppt PDB will vary but typically tend to reflect the main metabolic pathways, falling downwards in the anaerobic zone, but locally rising with methane pathways. To the side at right are shown some microbial partnerships that might be expected in such a profile today; passing downwards from aerobes, via nitrogen bacteria, iron bacteria and sulphur bacteria, towards methane-bacteria and fermenters. Common minerals resulting from their waste products are shown in capitals. Phosphate minerals (P) can be found through a wide spectrum here. Adapted from numerous sources including Konhauser (Reference Konhauser2007).

Spatial signals for metabolic tiers and zones (Table 1, criterion IV-D)
There is an idealized expectation that evidence for interlinked metabolic pathways may be found together, either stacked into vertically arranged metabolic tiers (Fig. 5), or concentrically arranged in metabolic zones. These tiers and zones are known to result from thermodynamic self-organization in relation to the energy yields of each metabolic pathway, with the greater yields being favoured nearer to the main sediment–water–air interface (e.g., Konhauser Reference Konhauser2007). Such zonations are implicit, for example, within field studies of very ancient sedimentary event beds, and within early diagenetic concretions, but their study in the early fossil record is still very much in its infancy.
Conclusions
The field of early life studies is changing fast. Ten years ago, when one of us (Brasier et al. Reference Brasier, Green, Jephcoat, Kleppe, Van Kranendonk, Lindsay, Steele and Grassineau2002) raised deep questions about biological credentials of the ∼3.46 Ga Apex microfossils (Schopf Reference Schopf1993), two axioms were already well established: that candidate fossils should be supported by a geological context consistent with their great age; and that they should show biology-like morphology. The potential of laser Raman for geochemical mapping was also emerging at this time (e.g., Schopf et al. Reference Schopf, Kudryavtsev, Agresti, Wdowiak and Czaja2002), as were some of its shortcomings (Brasier et al. Reference Brasier, Green, Jephcoat, Kleppe, Van Kranendonk, Lindsay, Steele and Grassineau2002; Pasteris & Wopenka Reference Pasteris and Wopenka2003). Two further caveats were also introduced in 2002 as well: the need to pit cell candidates against the morphospace of comparable abiogenic systems (Brasier et al. Reference Brasier, Green, Jephcoat, Kleppe, Van Kranendonk, Lindsay, Steele and Grassineau2002; Garcia-Ruiz et al. Reference Garcia-Ruiz, Hyde, Carnerup, Christy, Van Kranendonk and Welham2003); and the need to admit the null hypothesis of an abiogenic origin, especially for fossils older than 3 Ga. (Brasier et al. Reference Brasier, Green, Jephcoat, Kleppe, Van Kranendonk, Lindsay, Steele and Grassineau2002, Reference Brasier, McLoughlin, Green and Wacey2006).
Since that time, much has been learned about metabolic pathways within living microbial systems, together with attendant biomarkers, isotopic fractionations and other biosignals (e.g., Konhauser Reference Konhauser2007; Knoll et al. Reference Knoll, Canfield and Konhauser2012). This new knowledge has been accompanied by a revolution in our capacities to resolve morphological structures, and associated metabolic signals at very high, micrometre to nanometre scales, even in some of the most ancient and difficult sediments. These new advances include NanoSIMS (e.g., Kilburn & Wacey Reference Kilburn, Wacey, Seckbach and Tewari2011; Oehler et al. Reference Oehler, Robert, Mostefaoui, Meibom, Selo and McKay2006, Reference Oehler, Robert, Walter, Sugitani, Allwood, Meibom, Mostefaoui, Selo, Thomen and Gibson2009, Reference Oehler, Robert, Walter, Sugitani, Meibom, Mostefaoui and Gibson2010; Wacey et al. Reference Wacey, Kilburn, McLoughlin, Parnell, Stoakes and Brasier2008, Reference Wacey, McLoughlin, Whitehouse and Kilburn2010a, Reference Wacey, Saunders, Brasier and Kilburn2011a, Reference Wacey, Kilburn, Saunders, Cliff and Brasierb), focused ion beam (FIB) sample preparation coupled with TEM (e.g., Kempe et al. Reference Kempe, Wirth, Altermann, Stark, Schopf and Heckl2005; Wacey et al. Reference Wacey, Saunders, Brasier and Kilburn2011a, Reference Wacey, Kilburn, Saunders, Cliff and Brasierb, Wacey, D., et al.'s Reference Wacey, Menon, Green, Gerstmann, Kong, McLoughlin, Saunders and Brasier2012 private communication) and synchrotron mapping (e.g., Donoghue et al. Reference Donoghue, Bengtson, Dong, Gostling, Huldtgren, Cunningham, Yin, Yue, Peng and Stampanoni2006; Lemelle et al. Reference Lemelle, Labrot, Salome, Simionovici, Viso and Westall2008; Lepot et al. Reference Lepot, Benzerara, Brown and Philippot2008; Templeton & Knowles Reference Templeton and Knowles2009). However, high-resolution geochemical analysis will never be sufficient on its own. Geochemical techniques must always be accompanied by geological mapping coupled to extensive and detailed petrography, otherwise the context for interesting signals will be seriously misconstrued. There is likewise a need for more experimental and computational studies of those pseudofossil structures that arise naturally within complex physico-chemical systems, plus a need for computational image analysis of biological versus abiological populations. Only when we have such a battery of information, can we be confident in agreeing on signs of life that are remote in space and time.