

INTRODUCTION
Demographic shifts in the ethnoracial profile of the East Bay have raised concerns about uneven access to public services along the fault lines of language. On May 8, 2001, in an effort to facilitate limited English speakers’ access to critical municipal service, Oakland—the largest municipal of Alameda County, California—became the first American city to implement a bilingual employment policy in public administration via the passage of the Equal Access to Services Ordinance (EAO) (Oakland City Council 2001). The legislation mandates that important public administration documents be translated and bilingual staff be hired in public contact positions for languages reaching a minimum population threshold. Prior to this date, comparable legal statutes had been operative at the state-level and, broadly so, for federal government. For example, California’s Dymally-Alatorre Bilingual Services Act (DABSA) was passed in 1973 to urge state and local public agencies serving a sufficient number of limited English-speaking persons to hire bilingual staff.
Since the passage of the act, political controversy regarding the implementation (and lack thereof) of EAO policy has arisen from both inside and outside the City of Oakland administration. One political camp (“discriminatory non-enforcement”) questions the effectiveness of municipal efforts in implementing EAO policy, while the other political camp (“discriminatory enforcement”) asserts that the implementation of EAO policy has resulted in an uneven loss of jobs for monolingual English workers. This study concerns itself with identifying the labor market effects of implementing the bilingual employment policy on Alameda County workers. In particular, this study evaluates the labor market impact such policy has on the employment profiles of: 1) Spanish and Chinese bilingual speakers—the intended targets of the policy; and 2) Black monolingual English speakers—the unintended targets of the policy.
Using IPUMS-USA data from the 5% 2000 Census and the 1% 2005–2011 American Community Survey, this study conducts a trend analysis to examine the intended and unintended changes in ethnoracial segmentation in several labor market outcomes pertinent to bilingual employment policy implementation with a special focus on how the policy affected Black and Brown people. Specifically, within this study, the likelihood of having jobs with local government employers, public contact jobs within local government, and public administration jobs within local government is considered to be a function of period-dependent discrepancies by ethnoraciality—measured here as racial group membership, Latino ethnicity, and English language proficiency—before and after 2001. Results are adjusted for by ethnoracial and period differences in sociodemographic, human capital, and residential characteristics. This study raises a basic question: Do new policies intended to improve the access of limited English speakers to public services (the intended consequences) have a negative impact on Black public sector employment (the unintended consequences)? Before the data, methods, and results of the study are presented, primary and historical data sources are employed to characterize the labor market and political contexts surrounding the EAO policy implementation controversy and to frame the hypotheses that guide the analysis of the demographic data.
Bilingual Employment Policy in Oakland, CA
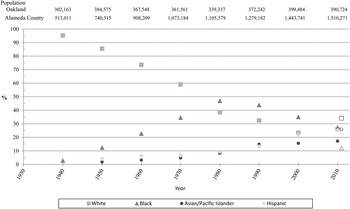
The bilingual employment policy implemented by Oakland can be understood as informed by demographic shifts in the ethnoracial profile of the East Bay that have shifted Oakland, CA from a Black Power capital to a multiracial mecca (Joseph Reference Joseph2006; Singer Reference Singer2007; Spencer Reference Spencer, Woodard and Theoharis2005). Oakland, today, is a minority majority city (Kaufmann Reference Kaufmann2007), where Blacks are still the largest minority group and non-Black minorities occupy a rapidly increasing share of the population (Figure 1). Similar trends apply for Alameda County—the county where Oakland is located and the location of the analysis for this paper—such that in 2010, no one ethnoracial group comprised a majority of Alameda County. In each decade since 1950 (except for the 1960s), Oakland’s Latino community grew between 33% and 78%. Similarly, Oakland’s Asian community grew between 55% and 97%. Moreover, both the proportion and number of foreign-born residents living in Oakland more than doubled in the decades following the civil rights movement (U.S. Bureau of the Census 2014). Meanwhile, Blacks’ proportion of the population and absolute size peaked during this period and has since witnessed modest declines. Census data shows that in 2010, the period following the implementation of EAO policy, 27.3% of Oakland residents were Black, 25.4% were Latino (of any race), 17.2% were Asian or Pacific Islander, and 25.9% were White (U.S. Bureau of the Census 2014). Comparable figures for Alameda County show that 12.2% of Alameda County residents were Black, 22.5% were Latino (of any race), 25.9% were Asian or Pacific Islander, and 34.1% were White (U.S. Bureau of the Census 2014).
Race and Ethnicity Population in Oakland, 1940–2010
Source: Bay Area Census, Historical Census Data, Available at: http://www.bayareacensus.ca.gov/cities/oakland.htm and http://www.bayareacensus.ca.gov/counties/Alamedacounty.htm (accessed: 30 May 2014)
Notes: Comparable data for Alameda County shown in unfilled markers for year 2010.

As a “Model City,” the very diversity of Oakland citizenry is considered a welcoming feature to potential residents and businesses of the area (City of Oakland 2010). Diversity, however, also presents a challenge to sociopolitical leaders. As former Mayor Ronald Dellums states: “A Model City is a coherent, cohesive city, anchored in a vibrant economy, where its citizenry is healthy, well-educated, well-trained, well-informed and capable of effective interactions with the civic, economic, social and cultural institutions of our community” (City of Oakland 2010, emphasis added by author). In an evaluation of the demographic shifts that had occurred in Oakland since the 2000 Census, the City of Oakland administration believed it was not living up to its claims to be a Model City, as it was constantly fielding a number of complaints concerning uneven access to public amenities by its limited English-speaking residents.
Oakland’s Equal Access to Services Ordinance was implemented to alleviate the challenges limited English-speaking residents reported facing when attempting to access basic municipal services, such as paying a parking ticket, phoning in an emergency, and turning on their utilities. The idea behind this policy was that having a larger share of bilingual employees of the City of Oakland would alleviate the distress limited English-speaking residents faced as they navigated public amenities and services. The ordinance draws upon the language of the 1973 DABSA, which urges state and local public agencies directly involved in furnishing information or rendering services to a largely non-English speaking population to translate written outreach documents into multiple languages and hire bilingual staff. Footnote 1
However, Oakland’s bilingual employment policy is more specific than those implemented in state and federal jurisdictions. To set goals for hiring and department-specific plans of action, the language of the policy draws upon data from the 2000 Census and the city’s employment records. Footnote 2 For example, Oakland’s EAO stipulates that any language shared by more than 10,000 limited-English proficiency residents be incorporated into the ordinance’s bilingual requirements. Additionally, the ordinance defines the type of positions for which bilingual staff should be hired. In the original version of Oakland’s EAO, a “public contact position” is defined as a “position, whether clerical, service, professional, or of a sworn nature, that emphasizes greeting, meeting, contact, or provision of information and/or services to the public in the performance of the duties of that position” (Oakland City Council 2001). Footnote 3 Moreover, later revisions of the ordinance created a threshold by which to characterize a position as “public contact.” An ad hoc committee of City Administration personnel defined a “public contact position” as “a position who serves the public 50% or more of the time whether in person, by phone or through correspondence” (Oakland City Council 2001). Consequently, the 50% threshold eliminated a number of classifications from being considered, including a significant number of personnel in administrative, management and executive level positions, and staff in field inspection classifications (City Administrator’s Office-Equal Opportunity Programs Division 2006).
Criteria to measure that the ordinance’s mandates have been sufficiently met assert that the proportion of public contact positions employed by bilingual workers should parallel the proportion of the city’s general population that speak a particular language. In 2000, 11% of Oakland residents spoke Spanish and 8.5% spoke Cantonese and/or Mandarin. Accordingly, the ordinance’s criteria suggest that 11% of public contact employees should speak both Spanish and English proficiently, and 8.5% should speak both Chinese and English proficiently. To guard against unfair firing practices, Oakland’s bilingual employment policy, like DABSA, maintains that existing employees are not to be dismissed in order to fulfill the law’s mandates. Rather, public agencies must only fill positions made vacant by retirement or normal attrition. Footnote 4
The Labor Market Context of Alameda County, CA
Due to the hiring constraints articulated in Oakland’s EAO, the larger labor market context wherein the bilingual employment policy is implemented must also be considered. At the start of the twenty-first century, the East Bay had undergone and was undergoing profound demographic and economic changes. California’s “Second Gold Rush” (Lotchin Reference Lotchin2003) brought an influx of limited-English speaking migrants and immigrants into the ports and hills of the East Bay. To revive the economic lure of Oakland, political leaders therein embraced urban renewal efforts to revive the downtown area after the flight of Whites to the East Bay suburbs in the 1960s and 1970s (Bailey Reference Bailey2005). For instance, Jerry Brown’s 10K project aimed to bring 10,000 people into downtown Oakland by 2010. The mayor focused efforts on new condominium and apartments developments with the hope that businesses and cultural entertainment would follow the people (Elinson Reference Elinson2010).
Former Mayor Jerry Brown’s commitment to revitalize through new housing development did bring a modest influx of small businesses and upwardly-mobile residents into certain sections of downtown Oakland. However, the gradual and eventual collapse of the vibrant 1990s housing market led to vacant units and large budget deficits to the city’s next mayor, Ronald Dellums, since population growth contracted and credit became harder to approve. As the first decade of the new millennium closed, vacancy rates in Oakland were two and half times those of the millennium (Census 2007), and unemployment rates remained well above the national average (State of California 2010).
Arguably, these larger social and economic forces prime and shape the perspectives city residents have about the (lack of) EAO implementation. While demographic shifts in ethnicity and language certainly inform the need for the EAO, the introduction of language policies for political and civic purposes represents, in some ways, a natural extension of California’s multilingual tradition. For instance, even as English has maintained its dominance as the language of the land, California has always maintained a tradition of multiple languages. As such, to many, the recent surge of immigrants speaking Spanish and one of many Asian languages obliges state and local government agencies to actively seek multilingual employees.
Moreover, the public sector, the concern of this paper, has been a leader in the recognition of non-discrimination employment policies since the Civil Rights era. Accordingly, the public sector has become a key source of equal compensation and professional employment (Grodsky and Pager, Reference Grodsky and Pager2001), allowing entry and expansion of the middle class for many non-Whites, especially for native-born Blacks (Farley and Allen, Reference Farley and Allen1987; Katz and Stern, Reference Katz and Stern2008). At the twentieth century’s end, 19% of Black men and 43% of Black women worked in public or state-related jobs (i.e., jobs that were nominally private but dependent on public funding) and the median income of Black public-sector employees working full time exceeded the income of comparable private-sector employees by 15% for men and 19% for women (Katz and Stern, Reference Katz and Stern2008). Moreover, cities with higher numbers of Blacks in public employment yielded the lowest Black poverty rates while increasing the effectiveness of municipal public assistance programs and solidifying Blacks’ political influence therein (Katz and Stern, Reference Katz and Stern2008; Katz et al., Reference Katz, Stern and Fader2005). Thus, at the crux of the controversy stirred by EAO lies a labor market that has historically been ethnoracially segmented.
The Political Controversy Surrounding EAO Policy
Both the implementation and lack of implementation of EAO policy has ignited a political controversy along Black/Brown fault lines. A variety of political and civic actors have been involved in the controversy spanning two political leaders of Oakland from the period of 2001 (the year of policy implementation) through 2009 (the year of the settling of the last law suit concerning EAO policy). While only the discriminatory enforcement perspective explicitly claims discrimination has occurred on the part of the City of Oakland administration, both sides cite uneven treatment in the city’s efforts to implement the EAO. Primary documents and media accounts of these perspectives are utilized to clarify assertions that will be tested with demographic data from Alameda County, CA. The data, then, is historical in nature and privileges the voices of the political and civic actors to frame the hypotheses that guide the analysis of this paper.
The “Brown” perspective maintains that the City of Oakland administration has failed to properly implement the bilingual employment policy (“discriminatory non-enforcement”). This perspective hinges upon the assertion that a multilingual political administration offers several benefits to local societies, including better incorporation of limited-English speakers into the political and civic milieu. This is a perspective that closely follows those asserted by proponents of bilingual and multilingual education (Baker Reference Baker2011; Benson Reference Benson2002; Cummins Reference Cummins2000; Shohamy Reference Shohamy2012). The language of the EAO places the onus of responsibility for facilitating implementation, compliance, assessment, monitoring, and enforcement of the public policy on the City Administrator (EAO 2001). The City Administrator is mandated to collect and submit annual compliance plans to the City Council evaluating the city’s progress on attaining distinct criteria specified in the ordinance every six months (EAO 2001). Between 2001 and 2009, three persons served as City Administrator: Robert Bobb, Deborah Edgerly, and Dan Lindheim (Rayburn Reference Rayburn2009). From the Brown perspective, both Edgerly and Lindheim established and continued a legacy of non-enforcement, where no special efforts were made to enforce the EAO.
On September 15, 2008, four community groups representing the discriminatory non-enforcement camp—Family Bridges, Inc., Organization of Chinese Americans-East Bay Chapter, The Spanish Speaking Unity Council, and California ACORN—filed a lawsuit against the City of Oakland for failing to fulfill its obligations under the bilingual employment policy (Buitrago and Rodriguez, Reference Buitrago and Rodriguez2008). The nonprofit law firm, Public Advocates, representing the community groups asserted that Oakland public administrators have neglected to supply consistent and complete reports of the city’s progress on implementing the bilingual employment policy since its inception and have yet to submit an annual compliance plan that fulfills the hiring mandates required by the ordinance (Buitrago and Rodriguez, Reference Buitrago and Rodriguez2008). Another lawsuit was filed by the Educational Coalition for Latinos in Oakland (ECHO), the Spanish Speaking Citizens’ Foundation, and ACPO Inc., who were represented by Peter Roos and Mary K. Gillespie (Public Advocates 2011).
Public Advocates and Buitrago maintain that the city has only provided three “incomplete” plans and has failed to provide plans consistently since the passing of the bilingual employment policy. A review of the City of Oakland’s public documents confirms that annual reports were submitted for only three of the seven fiscal years covering the period focused on by the discriminatory non-enforcement lawsuits. In 2011, both lawsuits were settled by the city without admission of liability or fault. The city agreed to pay the plaintiff’s legal fees of $400,000 (Kuruvila Reference Kuruvila2011), implement the EAO, and assist municipal departments in understanding their duty in enacting EAO policy (City of Oakland 2011).
The Public Advocates lawsuit does not allege discrimination explicitly in the city’s implementation of the bilingual employment policy—only that the city has failed to do its due diligence in policy implementation. In fact, Section 2.30.030 of the EAO contends that the article should be interpreted and applied so as to be consistent with Title VII of the Civil Rights Act of 1964, California’s Fair Employment and Housing Act, Americans with Disabilities Act, and any article of the City of Oakland’s Charter. In this sense, the Brown perspective asserts that the City Administrator is not fulfilling legal dues and acting inappropriately by not implementing the EAO. Moreover, the community groups represented by Public Advocates and attorneys Peter Roos and Mary K. Gillespie do adopt the language of civil rights policy to describe the EAO. Adopting a civil rights stance on bilingual employment policies further infers that the lack of dutiful implementation of the policy is not only a form of administrative oversight, but also a form of civil rights negligence (Public Advocates 2011). Language-based discrimination, thus, is implied but not plainly stated.
Meanwhile, the “Black” perspective, which focuses on the disparate impact of bilingual employment policies (“discriminatory enforcement”), maintains that implementing Oakland’s EAO violates prospective employees’ constitutional rights and forces the City Administrator to act in ways that are inconsistent with the city’s charter for non-discrimination on the basis of race. Staff of the Equal Access Task Force (2001) assert that a legal review of the ordinance indicates that implementing bilingual employment policy contradicts equal opportunity provisions of federal, state, and local agencies and fails to be consistent with the local laws it cites originally. Footnote 5
The discriminatory enforcement perspective was captured best by former City Administrator Deborah Edgerly on July 14, 2009, who cited in her wrongful termination lawsuit against the City of Oakland that she refused to accept hiring practices urged by the bilingual employment policy that she considered discriminatory (Rayburn Reference Rayburn2009). Footnote 6 The Black perspective, then, explicitly references discrimination in its arguments. From the discriminatory enforcement perspective, any proportional loss of local government jobs by Blacks is seen as a filter into the traps of unemployment and poverty, for it closes an important door to economic opportunity for historically-disadvantaged Blacks. Recognition of the public sector’s success at providing a stable source of social and economic mobility for Blacks is at the cornerstone of the argument against discriminatory enforcement of bilingual employment policies.
In 2007, the City of Oakland’s Equal Opportunity Programs Division—the civil rights arm of the City of Oakland—challenged the legality of Oakland’s EAO. Yet, the challenge was unsuccessful. The City’s Attorney, John Russo, responded that the ordinance is consistent with California state law, municipal codes, and any other federal or state law. Moreover, the bilingual employment policy does not reference race or national origin directly nor was its passage motivated by race or national origin. Based on legal definitions of discrimination, disparate impact of a policy by ethnoracial group does not constitute a violation of Title VII if a discriminatory requirement is job-related and consistent with business necessity and if other means could not achieve the same end. Footnote 7 Russo (Reference Russo2007) asserts that the bilingual skill requirement that was designed “so that immigrants can have access to government services is undeniably job related and consistent with business necessity” (p. 2; emphasis added by author).
Noteworthy, public policies similar to Oakland’s EAO have been passed and implemented in several other cities since 2001 Footnote 8 and is being considered by governmental entities across the nation (Russo Reference Russo2007). The constitutionality of the bilingual employment policy has yet to be formally challenged. However, the California NAACP proposed bill AB 781, which grants that city, county, or state governmental entities shall not discriminate against an employee or an applicant for employment on the basis of the ability of the employee or applicant to speak a language other than English, unless an ability to speak a language other than English constitutes a bona fide occupational qualification. Footnote 9 California Conference NAACP President, Alice Huffman, says that Blacks of the state are not well-versed in non-English languages and supports changing the law so that public agencies will seek multilingual applicants only when there is a demonstrated need (California State Conference of the NAACP 2009).
On May 7, 2009, the City of Oakland released a bill analysis opposing AB 781 and therein noted that the bill would have no positive impact on Oakland and that the city considers the bill a “direct attack” on the municipal’s innovative policy. The city unanimously passed a resolution directing the City Administrator and the City’s legislative lobbyist to advocate in opposition of the bill. Rather than debate or vote on the bill authored by Republican Assemblyman Kevin Jeffries, the Democratic-dominated judiciary committee altered AB 781 to a two-year bill on May 12, 2009 (Assembly Committee on Judiciary 2009). This decision pushed back discussion for the following calendar year but raised the question of whether there is a need for statewide legislation placing such an impetus on public agencies. A review of California legislation indicates that AB 781, as it was originally written, died on the third reading of the State Senate on November 30, 2010.
HYPOTHESES
This study examines the intended and unintended impacts of the nation’s first local government bilingual employment policy. For instance, do bilingual workers targeted by the policy increase their representation in the types of highlighted occupations by ameliorating ethnoracial disparities in access to public services? Do such targeted workers enjoy broader access to the public administration sector beyond the targeted jobs? Moreover, do any specific ethnoracial groups face added challenges to public contact position or the public administration sector in the years during bilingual employment policy implementation?
This study seeks to satisfy two aims: 1) identify whether, and the extent to which, bilingual employment policy yielded favorable increases in bilingual Spanish and Chinese workers employed in “public contact occupations” within local government public administration (intended consequence); and 2) identify whether, and the extent to which, the bilingual employment policy yielded unfavorable decreases in workers from any other ethnoracial group employed in these same types of jobs (unintended consequence). At primary issue, then, is the evaluation of a labor policy that might, in its implementation, have a push-pull effect on ethnoracial labor market segmentation, where a loss of local government public contact occupations for a specific ethnoracial group within the public administration sector (“targeted jobs) occurs on behalf of Spanish and Chinese-speaking bilinguals (“targeted workers”) – that is, respective losses and gains must co-occur. The satisfaction of these two aims comprises both sides of a zero-sum labor market quandary presented by legal mediations of Oakland’s bilingual employment policy as reflected by the discriminatory enforcement perspective. Footnote 10
The pull effect captures the intended impact of Oakland’s bilingual employment policy. It was anticipated that Spanish/Chinese targeted bilinguals would experience increases within public contact positions in the public administration sector among local government employees. However, it may be that due to heightened calls for bilingual workers by local government employees, a larger number of bilingual workers who speak a wide variety of languages other than English may have applied for local government jobs overall. As such, more diffused effects may be found among local government employees, among public contact positions by local government employees, and among local government employees of the public administration sector workers. As such, three potential hypotheses are considered:
-
1) There has been an increase in targeted Spanish/Chinese bilingual speakers among local government workers after the implementation of Oakland’s bilingual employment policy.
-
2) There has been an increase in targeted Spanish/Chinese bilingual speakers among public contact positions in local government after the implementation of Oakland’s bilingual employment policy.
-
3) There has been an increase in targeted Spanish/Chinese bilingual speakers within the public administration sector among local government employees after the implementation of Oakland’s bilingual employment policy.
The legal debate has focused on the push effect of the EAO on Black monolingual English speakers, as they are the ethnoracial group in Alameda County least versed in Spanish and Chinese. The unintended effect is that there will be a lower representation of Black monolingual English speakers in targeted jobs—public contact positions in the public administration sector offered by local government employees. However, more diffused effects may also be expected if heightened calls for bilingual workers signaled a decreased value of monolingualism among local government employees. As such, three potential hypotheses are considered with this group in mind:
-
4) Black monolingual English workers have transferred from local government employers to non-local government employers after the implementation of Oakland’s bilingual employment policy.
-
5) Among local government employers, Black monolingual English workers have higher attrition rates from public contact occupations than targeted bilingual workers.
-
6) Among local government employers, Black monolingual English workers have higher attrition rates from the public administration sector than targeted bilingual workers.
DATA
As there is no publicly available administrative data from the City of Oakland able to address the concerns of this paper, this study extracts data about California residents from the Integrated Public Use Microdata Series—USA (IPUMS-USA) (Ruggles et al., Reference Ruggles, Trent Alexander, Genadek, Goeken, Schroeder and Sobek2010). The 5% Census sample and the 2005–2011 American Community Survey are employed to examine the labor market impact of the EAO passed in Oakland, CA on May 8, 2001. The sample focuses on working age adults from eighteen to fifty-nine years old because workers in this age range mostly are not eligible for retirement, which is an admissible reason for attrition inequalities according to the EAO policy. Specifically, the analysis examines the changing ethnoracial distributions of local government employees within targeted occupations and industries between 2000 and 2005–2011.
Alameda County and The City of Oakland
Given that the smallest identifiable geographical unit for place of work variables available for public use census and census-related data is the Super Public Use Microdata Areas (Super PUMAs), the analysis herein focuses on workers in the county where the City of Oakland is located, Alameda County. PUMAs, a smaller geographic unit that approximates parts of cities, are used to identify Oakland residents. Because City of Oakland residents make up only 25% of the labor force within Alameda County (Ruggles et al., Reference Ruggles, Trent Alexander, Genadek, Goeken, Schroeder and Sobek2010), time of commute is also used to identify persons with the shortest commute time, which are presumably workers who reside in Alameda County and near the City of Oakland. Oakland residency and time of commute, then, are included to provide a better specification of residential factors that may shape occupational and industry characteristics of interest.
Of the fourteen incorporated cities within Alameda County, the City of Oakland has the largest full-time payroll at approximately $34.8 million (Census of Government Employment 2007). Among all local government employees, the City of Oakland’s payroll is only second to that of the Alameda County government. The City of Oakland government doles out $66.7 million to its full time employees annually. Moreover, the City of Oakland employs over 41% of all city government employees working in Alameda County (Census of Government Employment 2007). Accordingly, it can be expected that just about two-fifths of Alameda County workers evaluated in this study actually work for the City of Oakland.
A focus on Alameda County workers, instead of Oakland workers, is also warranted due to sample sizes. Despite the relative size of the City of Oakland’s government, there are less than 5,200 full-time equivalent employees working for Oakland’s city government. Accordingly, even if Oakland workers could be identified, the Census’s 5% sample design could at best identify 270 Oakland workers. While an evaluation of Alameda County workers reduces the likelihood of detecting effects of municipal-level public policy, it also provides a greater likelihood of specifying effects that are unique to race, language, and English proficiency, simultaneously.
Dependent Variable
Employment in city government comprises only 20.5% of all local government employees working in Alameda County. Other types of local government employees include school districts (41.6%), special districts such as city housing authorities and utility districts (19.2%), and Alameda County itself (18.6%). Employment in city government can be approximated using IPUMS-USA data with the public administration industry classification. Employment in targeted public contact positions can be approximated using IPUMS-USA data with a dichotomization of the occupation classification variable by pertinent characteristics. As such, a cross-classification of industry and occupation classifications identifies the positions of interest in this study—public contact occupations in Alameda County public administration.
To capture the interrelationships between employment restructuring within and outside the local public sector, this study utilizes three dependent variables: 1) working for a local government employee; 2) working in the public administration sector; and 3) working in public contact positions. The ultimate outcome of interest—targeted, public contact positions in Alameda County city government—is identified by successively restricting the sample of interest. The first set of analyses focuses only on Alameda County workers. Then, the analysis focuses on local government workers in Alameda County. Last, the analysis focuses on local government workers in public administration (i.e., city government).
To assess the impact of EAO policy on attrition from local government, class of worker status is assessed for all Alameda County workers. A respondent is considered to be working for a local government employee if either city or county employers employ the respondent. As the Census does not distinguish between city, county, and other types of local government employees, this variable provides the most conservative estimate of the labor market consequences of Oakland’s EAO.
To assess the impact of EAO policy on attrition from public administration, further classification of local government employees by the North American Industry Classification Scheme (NAICS) is made. Industry classification serves to isolate the probability of working in the municipal- and county-based public administration sector in contrast to working in the largely non-public administration sectors of special and school districts. In the sample of eighteen to fifty-nine year olds examined here, nearly 27% of local government employees work in public administration (NAICS codes: 92000–92999). Individuals who work for employers that provide services for the public administration sector are not classified as working for the public administration sector. Sixteen city agencies and departments were targeted to hire sufficient bilingual staff and report on the progress of EAO implementation. The EAO policy specifies the following city agency and departments: Community and Economic Development Agency, City Administrator, City Attorney, City Clerk, City Council, Finance and Management, Fire Department, Human Services, Library, Mayor, Museum, Parks and Recreation, Police Department, Port of Oakland, and Public Works.
To assess the impact of EAO policy on attrition from public contact positions—the crux of the argument between those who debate the implications of bilingual staff—the Standard Occupation Classification system (SOC) identifies occupations considered to include a fair amount of contact with the public. In consideration of which occupations should be classified as yielding public contact positions, the exact job title of local government employees was examined to determine whether it fit the types of jobs explicitly specified in EAO agenda reports. The following occupations have been classified as “public contact”: Community and Social Service; Legal, Education Training and Library; Arts, Design, and Entertainment; Healthcare Practitioner and Technical; Healthcare Support; Protective Service; Food Preparation and Service; Personal Care and Service; Sales and Sales-Related Service; Office and Administration; and Transportation and Material Moving. The simultaneous consideration of individuals who are employed in the public administration sector and who are within public contact occupations provides the central focus sample of the analysis presented herein.
Independent Variables
An indicator for respondents surveyed between 2005 and 2011 assesses the labor market effects of EAO policy. Small sample sizes preclude assessments of the post-EAO effect by year. Positive coefficients for this variable indicate a gain in jobs during the 2005–2011 period. This study differentiates labor market outcomes by ethnoraciality, as indicated by race and ethnicity (Black non-Latino, White non-Latino, Latino, or Asian and Pacific Islander non-Latino) and primary language spoken in the home (English, Spanish, Chinese (Cantonese or Mandarin), or Other Language). Respondents are considered monolingual English speakers if they report speaking only English in the household. Respondents are considered bilingual if they report speaking a non-English language primarily at home and speak English very well, well, or not well.
Dummy indicators for the following mutually exclusive ethnoracial categories are made: Black monolingual English (reference category); White monolingual English; Latino monolingual English; Asian monolingual English; Spanish/Chinese Bilingual; and Other Bilingual. Respondents who report speaking English not very well or not at all are excluded from the analysis. American Indian and Alaska Natives are excluded from the analysis due to small sample sizes. Positive coefficients for ethnoracial groups indicate they are more likely to hold a specific job type than Black monolinguals.
A number of sociodemographic characteristics have been found to be linked to the likelihood of working in local government, public contact positions, and public administration. To address possible confounders of the relationships of interest here, the following attributes are accounted for: age, gender, educational status, residential mobility, geographic location, time of commute, and marital status. Age is centered at eighteen and transformed to represent decades. All samples exclude working-age respondents who are less than eighteen. Gender is assessed with a dummy indicator for identifying as male (reference: female). Marital status is assessed with a dummy indicator for reporting being married (reference: separated, widowed, divorced, or never married). Educational status is measured using a categorical measure of educational attainment (1 = None, 2 = Grades 1–4, 3 = Grade 5–8, 4 = Grade 9, 5 = Grade 10, 6 = Grade 11, 7 = Grade 12; 8 = 1–3 years of college, 9 = 4+ years of college). Residential factors were assessed with a measure of residential stability (the recentness with which one occupied current residence, where 1 = always lived at this residential unit; 0 = moved to this residential unit), time of commute, and Oakland residence (using PUMAs identifying the City of Oakland).
Methods of Analysis
First, trends in the ethnoracial profile of Alameda County workers are evaluated. Second, trends in the ethnoracial profile of different kinds of local government workers in Alameda County are evaluated. Third, trends in the employment and demographic characteristics of Alameda County workers are compared across the six ethnoracial groups: Black monolingual English speakers, White monolingual English speakers, Latino monolingual English speakers, Asian/Pacific Islander monolingual English speakers, Spanish/Chinese bilingual speakers, and other language bilingual Spanish/Chinese speakers.
Fourth, using weighted logistic regression, ethnoracial differences in attrition from local government jobs are explored. Fifth, using weighted logistic regression, a more detailed examination of attrition patterns from public contact positions for all sectors of the local government and, specifically, for the local government public administration sector is undertaken. Sixth, using weighted logistic regression, an examination of attrition patterns from the public administration sector for all occupations of the local government and, specifically, for public occupations within local government is considered. Seventh and last, using weighted multinomial logistic regression, an examination of attrition patterns from targeted jobs to other sectors of employment in Alameda County is considered.
The central focus of the analysis presented herein is an interaction term of ethnoraciality with the post-EAO dummy indicator. In logistic regression models, a negative post-EAO coefficient alongside a positive interaction term indicates that an ethnoracial group is experiencing attrition from an occupation at a lower rate than Black monolingual English speakers between 2000 and the 2005–2007 period. All models presented adjust for variation that may be due to the aforementioned sociodemographic factors. Probability weights to account for the nesting of multiple persons surveyed in households and non-response patterns (PERWT) is employed in all univariate, bivariate, and multivariate, as is standard with IPUMS-USA data (Ruggles et al., Reference Ruggles, Trent Alexander, Genadek, Goeken, Schroeder and Sobek2010).
RESULTS
Trends in the Ethnoracial Profile of Alameda County Workers
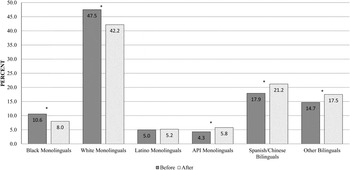
This paper explores whether there have been changes in the ethnoracial profile of the Alameda County labor market that are associated with the passing of the nation’s first-ever municipal-level bilingual employment policy. How has the ethnoracial profile of Alameda County workers changed over time? Figure 2 shows the ethnoracial distribution of Alameda County workers before and after the bilingual employment policy. There has been a decrease in the representation of both Black and White monolingual English speakers, but an increase in the representation of Asian/Pacific Islander monolingual English speakers, Spanish/Chinese bilinguals, and other bilinguals. Black monolingual English speakers comprised over 10% of Alameda County workers before the introduction of the bilingual employment policy. However, after the introduction of Oakland’s bilingual employment policy, Black monolingual English speakers comprised only 8% of Alameda County workers. Similarly, White monolingual English speakers comprised over 47% of Alameda County workers before the bilingual employment policy. After Oakland’s bilingual employment policy was implemented, White monolingual English speakers comprised 42.2% of Alameda County workers. Meanwhile, several ethnoracial groups strengthened their representation among Alameda County workers after the introduction of Oakland’s bilingual employment policy. Specifically, there was a 1.5 percentage point increase in the representation of Asian/Pacific Islander monolingual English speakers, a 3.3 percentage point increase in the representation of targeted (i.e., Spanish/Chinese) bilingual speakers, and a 2.8 percentage point increase in the representation of other bilingual speakers.
Ethnoracial Distributions of Alameda County Workers Before and After the Bilingual Employment Policy
Source: IPUMS-USA Alameda County Local Government Workers, Ages 18–59, N = 69,277
Notes: Change in period-specific distributions shown (2000 vs. 2005–2011). ACS = American Community Survey. Estimates based off of supplemental analysis (available up on request).
* p < 0.05 (two tailed, two-group proportion test).

Overall, Figure 2 tells us that the ethnoracial profile of Alameda County workers did indeed change after the introduction of the bilingual employment policy. However, given that representational changes also occurred to ethnoracial groups not expected to be affected by the policy (e.g., other bilinguals), it is unclear whether the bilingual employment policy itself affected the ethnoracial distribution of Alameda County workers. A closer look must be taken into the occupational structure most affected by the bilingual employment policy.
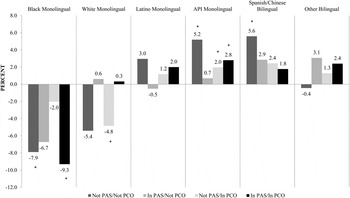
How has the ethnoracial profile of Alameda County workers in local government changed across time? Figure 3 breaks down unadjusted trends in the ethnoracial profile of Alameda County workers (Figure 2) by four job types that capture the intersection of industry sector and occupation type among local government workers, including those workers in targeted jobs. The length of the bars indicate the magnitude of differences in an ethnoracial group’s proportions before and after EAO, where positive values indicate growing density of an ethnoracial group after EAO and negative values indicate declining density of an ethnoracial group after EAO. This bivariate analysis indicates that Black monolingual English speakers experienced declines in all job types within local government.
Change in Ehnoracial Group Distribution by Local Government Job Type
Source: IPUMS-USA Alameda County Local Government Workers, N = 5,694
Notes: Change in period-specific distributions shown (2000 vs. 2005–2007). PAS = Public Administration Sector; PCO = PCO = Public Contact Organizations; Targeted Jobs are In PAS/In PCO. API = Asian/Pacific Islander; Estimates based off of descriptive statistics from Table 1.
* p < 0.05 (two tailed, two-group proportion test).

However, Figure 3 shows that absolute declines in the representation of Black monolingual English workers were largest for targeted jobs. In 2000, they represented 25% of the labor force in targeted jobs; yet, between 2005–2011, they represented less than 16% of the labor force in targeted jobs. There was a 9.3 percentage point decline in the representation of Black monolinguals after the implementation of the bilingual employment policy. No other ethnoracial group experienced declines of such a large magnitude.
Instead, Asian/Pacific Islander monolinguals, Spanish/Chinese bilinguals, and other language bilinguals experienced moderate increases in their representation within and outside of Alameda County’s local government sector. Targeted bilinguals, in fact, are the only ethnoracial group to experience relative increases in their representation across all job types. The magnitude of increase is largest (5.6 percentage points) for local government jobs outside of public administration that are not public contact positions.
Together, Figures 2 and 3 present mixed evidence of shifting racial segmentation in the Alameda County local government. On one hand, Black monolingual English speakers are experiencing substantial declines in jobs targeted by the bilingual employment policy. On the other hand, non-targeted ethnoracial groups (e.g., Asian/Pacific Islander monolingual English speakers) experience moderate increases in their representation in jobs targeted by the bilingual employment policy. Meanwhile, targeted bilinguals seem to have increased their representation across a broad range of local government positions. In sum, there is evidence that shifts in the ethnoracial profile of local government jobs targeted by EAO policy have occurred. Yet, it is not clear whether a pull-push dynamic is occurring as suggested by the aforementioned perspectives.
Changes in Demographic Mechanisms by Ethnoracial Group
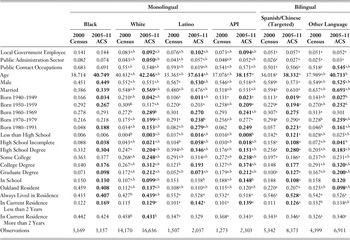
The next section attends to potential demographic mechanisms underlying the shifting ethnoracial profile of Alameda County workers. Do ethnoracial groups differ significantly by key factors related to employment in targeted jobs? How might the changing characteristics of ethnoracial groups contribute to the changing ethnoracial profile of Alameda County workers in targeted and non-targeted jobs? The remainder of this section explores compositional differences in employment and demographic factors between targeted workers and Black monolingual English speakers as possible confounding factors. Table 1 presents descriptive statistics of the six ethnoracial groups working in Alameda County (AC) for each time period of interest. The employment and demographic profiles of Black monolingual English and targeted bilingual employees are compared to other ethnoracial groups.
Descriptive Statistics by Ethnoracial Group by 2000 Census and 2005–2011 ACS Respondents Who Work in Alameda County, N = 69,277

Notes: Means and proportions presented. ACS = American Community Survey. Bolded text indicates that means/proportions in ACS 2005–2011 are significantly different than those for corresponding respondent in 2000 Census (p < 0.05; two-tailed test).
a p < 0.05 (two-tailed test; significantly different from Black monolingual English speakers in corresponding period).
b p < 0.05 (two-tailed test; significantly different from Spanish/Chinese bilingual [targeted] speakers in corresponding period).
Table 1 indicates that substantial ethnoracial differences exist in employment characteristics. For both time periods, Black monolingual English workers are more likely to work for local government employers, within the public administration sector, and in public contact occupations than other ethnoracial groups. Targeted and non-targeted bilingual workers are among the least likely to work for local government employers, within the public administration sector, and in public contact occupations. The one difference between targeted and non-targeted bilinguals that could be important to understanding the ethnoracial dynamics of concern here is related to the distribution of public contact occupations across time. Specifically, there is no change in the proportion of targeted bilingual workers in public contact occupations across time; however, there is a substantial and significant increase in the proportion of non-targeted bilingual workers in public contact occupations from 51.8 to 54.5%.
Furthermore, ethnoracial differences extend to a broad range of demographic characteristics. Black monolingual English workers are nearly three years older than targeted bilingual workers, more likely to be female, less likely to be married more likely to have a high school degree or some college education, less likely to have a graduate degree, twice as likely to live in the City of Oakland, and less likely to have always lived in their current residence. Most of the demographic differences between Black monolingual English-speaking workers and targeted bilingual workers are temporally consistent.
Two exceptions exist to this pattern: Differences in in-school status emerge and differences in residential stability become more concrete after the EAO policy. Specifically, before the EAO policy, about 15% of both Black monolingual English speakers and targeted bilingual speakers working in Alameda County were currently in school. There is a decline in this percentage for both groups; yet, the decline is more severe for targeted bilingual speakers. Similarly, differences in the residential mobility status become more concrete across time. Black monolingual English workers appear to be much less residentially stable after the EAO policy than their targeted bilingual counterparts.
There are significant changes in the demographic profile of Black monolingual English speakers and other ethnoracial groups across time. For instance, all ethnoracial groups are more likely to have graduate degrees and less likely to be in school currently after the EAO policy. However, targeted bilinguals are the only ethnoracial group to not experience a decline in the representation of high school degrees across time. Meanwhile, Black monolingual English speakers are the only ethnoracial group that experiences a decline in the representation of the married across time.
Table 1 indicates that the profiles for the average Black monolingual English worker and the average targeted bilingual worker are substantially different. The remainder of the analysis uses multivariate analysis to examine whether the trend patterns shown in Figures 2 and 3 indeed hold once accounting for temporal and ethnoracial differences in sociodemographic characteristics. The remaining analysis further identifies the specific employment dimensions where temporal changes in ethnoracial segmentation have occurred.
Multivariate Analysis
Local Government Employees
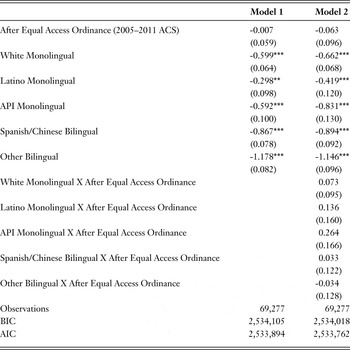
Table 2 presents results to assess Hypotheses 1 and 4: that movement in and out of the local government sector across the study period occurred differentially by ethnoraciality. Model 1 demonstrates the ethnoracial profile of local government workers averaged over the two time periods, while Model 2 demonstrates whether the ethnoracial profile of local government workers changes after the implementation of the bilingual employment policy. Estimates for both models include controls for demographic factors discussed previously (available upon request). Holding demographic factors constant, Model 1 estimates the ethnoracial profile of local government with dummy indicators; the reference category is Black monolingual English speaker. The negative direction of the five dummy indicators for ethnoraciality indicates that Black monolingual English speakers comprise a larger share of local government employees than their demographically similar counterparts of other ethnoracial groups. In 2000, Black monolingual English workers were more likely to work for local government employers than for other types of employers in Alameda County.
Weighted Logistic Coefficients for the Regression of Local Government Employment on Time, Ethnoraciality, and the Differential Effect of Ethnoraciality across Time, Holding Constant Sociodemographic Attributes, 2000 Census and 2005–2011 ACS Respondents Who Work in Alameda County, Ages 18–59, N = 69,277

Notes: ACS = American Community Survey; Raw coefficients shown. Standard errors in parentheses. Reference category for ethnoraciality is Black monolingual English speakers. All models also control for age, male gender, marital status, birth year cohort, educational attainment, in school status, Oakland residency, and residential stability.
*p < 0.05, **p < 0.01, ***p < 0.001 (two-tailed test).
The period term for both Models 1 and 2 is non-significant, which indicates that the proportion of local government employees among Alameda County workers remains consistent between 2000 and 2005–2011. The interaction terms between ethnoracial group membership and period of study added in Model 2 of Table 2 estimate whether there is a temporal shift in the probability of local government employment by ethnoracial group after the implementation of the EAO policy. None of these interaction terms yields significant effects. As such, Black monolingual English workers were no more likely than targeted bilinguals, or any other ethnoracial group, to leave (or come to) local government jobs after the implementation of EAO policy. As such, Hypotheses 1 and 4 are not supported. After the bilingual employment policy, the representation of Black monolingual English speakers in local government jobs did not decrease nor did the representation of targeted bilingual speakers increase.
Public Contact Positions
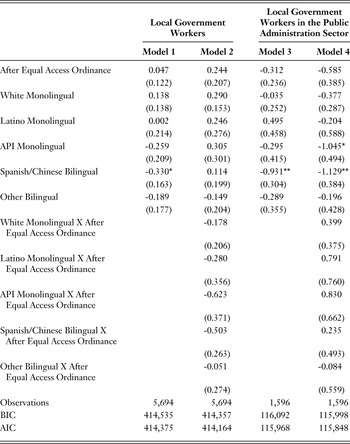
Among local government employees, do Black monolingual English workers have higher attrition rates from public contact occupations than targeted bilingual workers? Table 3 presents results from an analysis to assess Hypotheses 2 and 5, respectively: targeted bilingual local government employees have lower attrition rates from public contact positions after the implementation of EAO policy, while Black monolingual English local government employees have higher attrition rates from these same public contact positions. Two sets of analyses are presented in Table 3: the first, shown in the Models 1 and 2, focuses on all local government workers; and the second, shown in Models 3 and 4, focuses only on local government workers in the public administration sector as dictated by NAICS. Models 1 and 3, respectively, show the ethnoracial profile of employees in public contact positions averaged over the two periods of study, while Models 2 and 4 demonstrate whether the ethnoracial profile of employees in public contact position varies significantly across time.
Weighted Logistic Coefficients for the Regression of Public Contact Position Employment on Time, Ethnoraciality, and the Differential Effect of Ethnoraciality across Time, Holding Constant Sociodemographic Attributes, 2000 Census and 2005–2011 ACS Respondents Who Work in Alameda County, Ages 18–59

Notes: ACS = American Community Survey; Raw coefficients shown. Standard errors in parentheses. Reference category for ethnoraciality is Black monolingual English speakers. All models also control for age, male gender, marital status, birth year cohort, educational attainment, in school status, Oakland residency, and residential stability.
* p < 0.05, **p < 0.01, ***p < 0.001 (two-tailed test).
The non-significant period indicator confirms that there are no temporal changes in the proportion of local government employees in public contact positions. In 2000, few ethnoracial differences existed in the likelihood of working in public contact occupations within local government. Targeted bilinguals are 28% ([1 – exp(-0.330)]x100%) less likely than Black monolingual English speakers to work in public contact occupations within local government (Model 1, Table 3). However, there are no statistically significant changes to the ethnoracial profile of public contact positions across time.
When the sample is restricted to local government workers in the public administration sector, these patterns largely hold. If anything, targeted bilinguals and Asian monolingual English speakers are even less represented in public contact occupations within the public administration sector of the local government than outside the public administration sector of the local government. Within the public administration sector (Model 4, Table 3), the estimated coefficient for the targeted bilingual workers X period interaction term is in the expected direction (positive, large, and counterbalancing the main negative effect). However, the interaction term is not significant. As such, little support is found for Hypotheses 2 and 5—there are no temporal shifts in the ethnoracial profile of public contact occupations within the local government or within the local government public administration sector.
Public Administration Sector
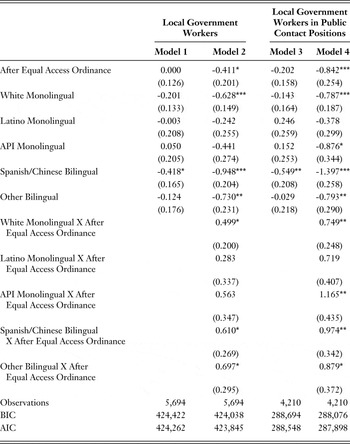
Among local government employees, do Black monolingual English workers have higher attrition rates from the public administration sector than targeted bilingual workers? Table 4 presents the results of analysis to assess Hypotheses 3 and 6, respectively: that targeted bilingual local government employees have lower attrition rates from the public administration sector after the implementation of EAO policy, while Black monolingual English local government employees have higher attrition rates from the public administration sector. Two sets of analyses are presented in Table 4: the first, shown in the Models 1 and 2, focuses on all local government workers; and the second, shown in Models 3 and 4, focuses only on local government workers in the public contact occupations as dictated by SOC. Models 1 and 3 show the ethnoracial profile of employees in the public administration sector averaged over the two periods of study, while Models 2 and 4 demonstrate whether the ethnoracial profile of employees in the public administration sector varies significantly across time.
Weighted Logistic Coefficients for the Regression of Public Administration Sector Employment on Time, Ethnoraciality, and the Differential Effect of Ethnoraciality across Time, Holding Constant Sociodemographic Attributes, 2000 Census and 2005–2011 ACS Respondents Who Work in Alameda County, Ages 18–59

Notes: ACS = American Community Survey; Raw coefficients shown. Standard errors in parentheses. Reference category for ethnoraciality is Black monolingual English speakers. All models also control for age, male gender, marital status, birth year cohort, educational attainment, in school status, Oakland residency, and residential stability.
* p < 0.05, **p < 0.01, ***p < 0.001 (two-tailed test).
The non-significant period indicator in Model 1 indicates that there are no temporal changes in the proportion of local government employees in the public administration sector (Table 4). In 2000, few ethnoracial differences existed in the likelihood of working in the public administration sector within local government. Targeted bilinguals are 34% ([1 – exp(-0.418)]x100%) less likely than Black monolingual English speakers to work in the public administration sector within local government (Model 1, Table 4).
Model 2 of Table 4, however, indicates that there are statistically significant temporal changes to the ethnoracial profile of the public administration sector. First, once temporal variation in the ethnoracial profile of public administration workers are considered, the period term is negative and significant. A negative period terms suggests that the representation of Black monolingual English workers (the reference group) declined after the implementation of the bilingual employment policy.
Second, there are negative and significant main effect terms for White monolingual English speakers, targeted bilingual speakers, and other bilingual speakers coupled with positive and significant interaction terms for these groups. The negative and significant main effect terms suggest that White monolingual English speakers, targeted bilingual speakers, and other bilingual speakers were less represented in public administration in 2000 than Black monolingual English speakers. The interaction terms for White monolingual English, targeted bilingual, and other bilingual speakers, though positive and significant, are smaller in absolute value than the main effects terms for these groups. Together, the interaction and main effects terms suggest a significant degree of equalization in the likelihood of public administration sector employment across ethnoracial group. However, since the absolute value of the interaction term is smaller than the absolute value of the main effects terms, there does not appear to be any increases in the representation of White monolingual English speakers, targeted bilinguals, or other bilinguals.
Similar patterns are found when restricting the sample to local government workers in public contact positions (Models 3 and 4 of Table 4). However, the interaction terms for targeted bilinguals and other bilinguals are larger in absolute value than the main effects terms for these ethnoracial groups (Model 4, Table 4). The interaction terms for these two groups are also larger than the period effect term. As such, it appears that there was an increase in the proportion of targeted bilinguals and other bilinguals in public administration sector after the implementation of the bilingual employment policy.
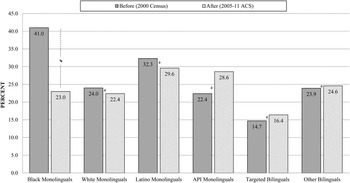
To graphically illustrate the findings from Model 4 of Table 4, predicted probabilities of public administration sector employment among the sample of local government workers in public contact occupations are simulated across ethnoracial groups with covariates set at sample means. Figure 4 provides a graphical depiction of the predicted probabilities of ethnoracial group representation before and after EAO policy. Thus, Figure 4 illustrates adjusted depictions of the trend patterns shown in the darkest bar of Figure 3.
Likelihood of Public Administration Sector Employment Before and After EAO Poicy by Ethnoracial Group
Source: IPUMS-USA Alameda County Local Government Workers in Public Contact Occupations, N = 4,210.
Notes: Predicted percents shown based on weighted logistic coefficients from Model 4 Table 5. All other covariates set to sample means. API = Asian/Pacific Islanders; ACS = American Community Survey.
* p < 0.05 (two tailed test; statistically significant period effect).
a p < 0.05 (two tailed test; significantly different from period effect for Black monolingual English speakers (column 1)).

Holding all else constant, the results indicate an 18 percentage point decline in the representation of Black monolingual English speakers in the public administration sector among local government workers in public contact occupations after the introduction of EAO policy. The change that Black monolingual English speakers experience is statistically distinct from negative changes that White and Latino monolinguals experience and from positive changes that Asian/Pacific Islander monolinguals, targeted bilinguals, and other bilinguals experience. This change is also substantially greater than the 9.3 percentage point decline in the representation of Black monolingual English speakers in the public administration sector among local government workers in public contact positions shown in Figure 3. These patterns suggest that demographic mechanisms do not account for ethnoracial trends in labor market segmentation, rather ethnoracial differences are more pronounced among demographically comparable workers.
In sum, strong support is found for Hypothesis 6: Black monolingual English local government employees are less likely to occupy jobs within the public administration sector after the implementation of EAO policy than before implementation. Meanwhile, limited support is found for Hypothesis 3: targeted bilingual workers experience homeostasis in their public administration sector representation within the local government, and small gains in access to the public administration sector within local government public contact occupations. Overall, Black’s stronghold in public administration appears to be weakening over time.
CONCLUSION
This study examines the ethnoracial redistribution of Alameda County workers to provide a broader context upon which to draw assessments of the impact of bilingual employment policies on labor market segmentation by race, language, and English proficiency. The results indicate that targeted bilingual speakers—those who spoke Spanish/Chinese as well as English well or very well—did experience increases in their representation within the public administration sector of the local government, especially among public contact positions within the local government. The increase in targeted bilingual speakers from 2000 to 2005–2011 made up for their lack of representation in 2000. There were no comparable increases in targeted bilingual speakers in other sectors of the economy. The results also indicate that language-based policies reduced the representation of Black monolingual English speakers in the public administration sector after the implementation of bilingual employment policy. Specifically, such workers are less likely to be represented in public contact occupations within the local government’s public administration sector after the EAO policy than before the EAO policy.
This paper provides an empirical example of the labor market dynamics associated with Black-Brown political tension in contemporary multiracial urban areas (Bobo and Hutchings, Reference Bobo and Hutchings1996; Kaufmann Reference Kaufmann2007). These results are important to consider as they highlight evidence by which Blacks could perceive immigrants as a political and economic threat (McClain et al., Reference McClain, Lyle, Carter, DeFrancesco Soto, Lackey, Cotton, Nunnally, Scotto, Grynaviski and Alan Kendrick2007). In an area where access to public administration is constricted and perceived as a zero-sum process, coalitions organized around bilingual employment policies fell along ethnoracial lines—English-only speaking Blacks versus Latinos and Asians. Moreover, the material and symbolic incentives to public administrative access in this case are ethnoracially group-specific for both sides of the political struggle, not merely individual. The Black/Brown political divide finds some support in evidence on employment outcomes after the bilingual policy implementation. However, the results also suggest that other groups—especially, Asian monolinguals and other bilinguals—may have witnessed some diffused benefits from the policy to an extent as well. These non-targeted ethnoracial groups experienced trends similar to that of targeted bilinguals; yet, their representations in public contact employment within public administration only increased marginally.
There are several limitations to this study. First, the study uses primary language spoken in the home as a measure of bilingualism. However, respondents may be fluent in a non-English language but not speak that language primarily at home. This imprecision in identifying bilinguals in the census and census-related data should weaken the effect of bilingualism as it is currently measured. It is expected that there would be a larger number of persons identified as bilingual Spanish, Chinese, or other language speakers were bilingualism able to be measured more broadly. It is likely that using primary language spoken in the household resulted in conservative estimates of targeted language speakers, as there would be less differences between targeted language speakers and non-targeted language speakers if bilingual speakers who do not speak targeted languages in the homes are included among non-targeted language speakers. It is also likely that the gains in targeted positions experienced by non-Black monolinguals reflect the imprecision of the bilingual measure—namely, some monolinguals are versed in Spanish or Chinese but do not speak these languages at home. Thereby, they are able to meet the bilingual language requirement of targeted positions but are classified in the study as monolinguals.
Second, this study would benefit from disentangling race and ethnicity further. Small samples sizes, for instance, precluded a detailed assessment of Black bilinguals. Moreover, supplementary analysis (available upon request) suggested that Spanish and Chinese bilinguals could be grouped together to evaluate the effect of the bilingual employment policy on targeted groups, as a whole. Nonetheless, there may be ethnoracial variance in the effects of demographic mechanisms on employment characteristics that are distinct by race, language, and English proficiency categories, which may be contributing to the overall patterns uncovered.
In the twenty-first century, the economy has largely settled into a service economy, and the Black middle class (for the most part) has left Oakland in their migration back to the southern United States and to outlying Bay Area neighborhoods. This study suggests that Black workers’ stronghold in service-centered jobs in the Bay Area has weakened. Moreover, this study suggests that language-based policies may have racialized effects on the employability of ethnoracial groups marginalized by monolingualism. For instance, this study clearly shows that Asian monolinguals benefitted from multicultural policies focused on language, while Black monolinguals did not. Future research should assess the impact of language-based policies on the earning potential of targeted and non-targeted workers. Future research should also replicate this study for the municipalities that have implemented similar language-based policies since Oakland. This will provide a clearer picture as to whether the findings illustrated in this study are generalizable to other locales.
ACKNOWLEDGMENT
The author thanks Quincy Thomas Stewart, Rashawn Ray, Fabio Rojas, Aarti Kohli, and Steven Pitts for helpful comments. The author was supported by a Vice Provost’s Postdoctoral Fellowship in the Population Studies Center at the University of Pennsylvania during the writing of this paper. The author was supported by a Social Science Internship at the Chief Justice Earl Warren Institute for Race, Ethnicity, and Diversity at the University of California, Berkeley Boalt School of Law during the collection of data for this paper.