Introduction
Cysticercosis due to Taenia hydatigena metacestode formerly referred to as Cysticercus tenuicollis (Sgroi et al., Reference Sgroi, Varcasia, D'Alessio, Varuzza, Buono, Amoroso, Boufana, Otranto, Fioretti and Veneziano2020) is a widespread tapeworm infection of veterinary importance that infects domestic and wild ruminants. Taenia hydatigena uses canid (primarily dogs) as the definitive hosts which release eggs on pastures where grazing animals upon ingestion become infected. The egg then develops into a metacestode larval stage in the intermediate hosts resulting in a disease condition known as cysticercosis. The prevalence of cysticercosis differs by country and host (Braae et al., Reference Braae, Kabululu, Nørmark, Nejsum, Ngowi and Johansen2015; Scala et al., Reference Scala, Pipia, Dore, Sanna, Tamponi, Marrosu, Bandino, Carmona, Boufana and Varcasia2015; Nguyen et al., Reference Nguyen, Gabriël, Abatih and Dorny2016), and could reach as high as 63.9% in Africa (Wondimu et al., Reference Wondimu, Abera and Hailu2011), 55.5% in Asia (Oryan et al., Reference Oryan, Goorgipour, Moazeni and Shirian2012), 39% in South America (Morais et al., Reference Morais, Vilela, Feitosa, Santos, Gouveia, Athayde and Azevêdo2017) and 14.6% in Europe (Scala et al., Reference Scala, Pipia, Dore, Sanna, Tamponi, Marrosu, Bandino, Carmona, Boufana and Varcasia2015). Although cysticercosis is highly prevalent across the globe, the disease seems to attract less attention probably because it is not zoonotic. Regardless, studies have demonstrated high economic losses (US$65 000–350 000) due to T. hydatigena infection (Wondimu et al., Reference Wondimu, Abera and Hailu2011; Scala et al., Reference Scala, Pipia, Dore, Sanna, Tamponi, Marrosu, Bandino, Carmona, Boufana and Varcasia2015). These losses are mostly incurred through damage to or condemnation of infected visceral and organs that are supposedly meant for human consumption and the high mortality rate in young animals (Scala et al., Reference Scala, Urrai, Varcasia, Nicolussi, Mulas, Goddi, Pipia, Sanna, Genchi and Bandino2016).
Hitherto, comparative studies have demonstrated significant differences between cysticerci from different hosts, such as variations in rostellar hooks morphometry, developmental pattern and cross-infectivity (Varma and Rao, Reference Varma and Rao1973; Varma and Ahluwalia, Reference Varma and Ahluwalia1986, Reference Varma and Ahluwalia1987). Similarly, Abidi et al. (Reference Abidi, Nazami, Khan, Ahmad and Irshadullah1989) reported significant quantitative differences in the biochemical components (glycogen, protein, lipid and DNA fractions) of cysticerci isolated from goats and pigs in the same geographical region. Meanwhile, molecular studies to compare and investigate the genetic population structure to confirm or corroborate these differences are scanty. Where available, the majority of the studies employ partial gene sequences (Boufana et al., Reference Boufana, Scala, Lahmar, Pointing, Craig, Dessì, Zidda, Pipia and Varcasia2015; Cengiz et al., Reference Cengiz, Yucel Tenekeci and Bilgen2019; Muku et al., Reference Muku, Yan, Ohiolei, Saaid, Ahmed, Jia and Fu2020; Alvi et al., Reference Alvi, Ohiolei, Saqib, Li, Muhammad, Tayyab, Qamar, Alvi, Wu, Li, Fu, Yan and Jia2020). Moreover, short DNA fragments have been found to often lack the potential to fully resolve the phylogenetic relationship that exists among some species of cestodes (Kinkar et al., Reference Kinkar, Laurimäe, Simsek, Balkaya, Casulli, Manfredi, Ponce-Gordo, Varcasia, Lavikainen, González, Rehbein, Van der Giessen, Sprong and Saarma2016, Reference Kinkar, Laurimäe, Acosta-Jamett, Andresiuk, Balkaya, Casulli, Gasser, González, Haag, Zait, Irshadullah, Jabbar, Jenkins, Manfredi, Mirhendi, M'rad, Rostami-Nejad, Oudni-M'rad, Pierangeli, Ponce-Gordo, Rehbein, Sharbatkhori, Kia, Simsek, Soriano, Sprong, Šnábel, Umhang, Varcasia and Saarma2018; Ohiolei et al., Reference Ohiolei, Luka, Zhu, Yan, Li, Magaji, Alvi, Wu, Li, Fu and Jia2019). So far, to the best of our knowledge and based on data from GenBank, only a study (Ohiolei et al., Reference Ohiolei, Luka, Zhu, Yan, Li, Magaji, Alvi, Wu, Li, Fu and Jia2019) has employed complete mitochondrial (mt) cox1, nad1 and nad5 genes in investigating the genetic diversity of T. hydatigena and the authors reported a significant nucleotide variation and the existence of distinct haplotypes among T. hydatigena populations from sheep and goats.
Also, recent studies on T. hydatigena isolates from different wild ungulates have observed morphological variations in rostellar hooks morphometry and other cysticerci features with some degree of correlation with the molecular data generated as seen in the distinct phylogenetic clades observed in the tree (Cengiz et al., Reference Cengiz, Yucel Tenekeci and Bilgen2019; Filip et al., Reference Filip, Pyziel, Jeżewski, Myczka, Demiaszkiewicz and Laskowski2019). In light of these observations, it is plausible that investigating the genetic diversity of T. hydatigena using longer mitochondrial DNA (mtDNA) could provide deeper insight into the genetic diversity than what is currently known. Therefore, in the current study, we report the genetic variation, diversity as well as the phylogenetic relationship of T. hydatigena cysticerci and adult worms collected from sheep, dogs and a wild boar in different Chinese provinces and autonomous regions using mitochondrial and nuclear DNA.
Materials and methods
Parasite material and origin
Taenia hydatigena isolates (cysticerci and adult worms) used in this study originated from northern China provinces and autonomous regions: Qinghai (65), Gansu (7), Inner Mongolia (7), Xinjiang (2) and Beijing (1), and were collected from slaughtered sheep, wild boar and domestic dogs from 2012 to 2019. Most of the domestic dogs were raised in small dog farms around slaughterhouses and were sometimes fed with offal (liver, lung, etc.) from slaughtered sheep or yaks from the surrounding slaughterhouses. Adult tapeworms from dogs were collected after oral administration of arecoline hydrobromide. The expelled worms were washed at least three times in saline solution before use. All parasite materials were stored at −80°C until use.
DNA extraction, PCR amplification, sequencing and identification
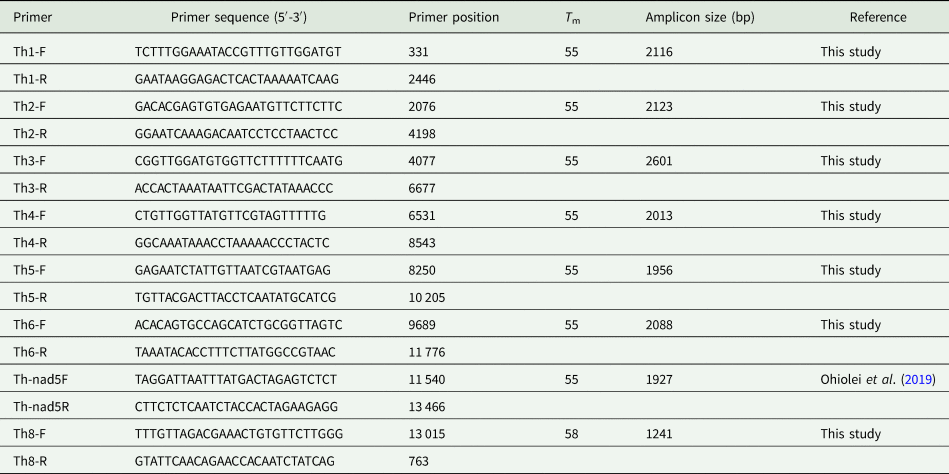
Genomic DNA was extracted from an excised portion of each cysticercus and crushed adult worms using Qiagen Blood and Tissue Kit (Qiagen, Hilden, Germany) according to the manufacturer's instructions. PCR was performed in a 25 μL final reaction mixture containing 12.5 μL Premix Ex Taq™ version 2.0 (Takara Bio, Kusatsu, Japan), 0.5 μL (10 pmol) of each primer, 0.5 μl of genomic DNA extract (c.⩾10 ng) and RNAse-free water up to the final volume of 25 μL. The reaction was as follows: initial denaturation at 95°C for 5 min, followed by 35 cycles of denaturation at 95°C for 30 s, annealing at 55°C for 30 s, and elongation at 72°C for 45–90 s and a final extension at 72°C for 10 min. Amplicons (5 μL) were visualized by electrophoresis in 1.5% (w/v) agarose gels in 1× TAE (40 mm Tris-acetate, 2 mm EDTA, pH 8.5), stained with GelRed® (Biotium, Fremont, USA) and viewed under UV light (ChemiDoc XRS+ system, Bio-Rad, Inc). The remaining PCR products were then sequenced (Beijing Tsingke Biotechnology Co., Ltd., Xi'an, China). The complete nad1 and nad5 genes were amplified using previously described primers (Ohiolei et al., Reference Ohiolei, Luka, Zhu, Yan, Li, Magaji, Alvi, Wu, Li, Fu and Jia2019). Furthermore, the complete mt genome was amplified using eight sets of overlapping primer pairs designed based on T. hydatigena reference mt genome sequences from GenBank (Accession No: NC_012896) (Table 1). The final products of the primers ranged from 1241 to 2601 bp (Table 1). Additionally, about 1494 bp of the nuclear protein-coding gene, phosphoenolpyruvate carboxykinase (pepck) was also amplified using the forward 5′-ATCTGCGACGGTAGCAAGGCCGAA-3′ and reverse 5′-AGCCCATTCAATCACACGGATATT-3′ primers as previously described (Knapp et al., Reference Knapp, Nakao, Yanagida, Okamoto, Saarma, Lavikainen and Ito2011).
List of eight overlapping primer pairs used in amplifying the complete mitochondrial genome of Taenia hydatigena (GenBank accession no.: NC_012896)

T m, melting temperature.
The resulting nucleotide sequences were viewed for correction of any nucleotide misread, followed by alignment in BioEdit v7.2.6 and/or Unipro UGENE v1.29.0 (Hall, Reference Hall1999; Okonechnikov et al., Reference Okonechnikov, Golosova and Fursov2012). The identity of each isolate using the nucleotide sequences was confirmed in a BLAST search (https://blast.ncbi.nlm.nih.gov/Blast.cgi). All sequences from this study were deposited in the GenBank database under the following accession numbers MT776566–MT776666, MT784871–MT784896.
Mitochondrial genome assembly
The sequence reads of the complete mitochondrial genome were assembled stepwise with the help of the DNAstar v7.1 program (Burland, Reference Burland, Misener and Krawetz2000) ensuring that the overlaps were identical. The open reading frames of the protein-coding genes were determined using the echinoderm mt genetic code (Nakao et al., Reference Nakao, Sako, Yokoyama, Fukunaga and Ito2000). Sequences of the protein-coding genes were translated into amino acid sequences using the same genetic code in MEGA X v10.0.5 (Kumar et al., Reference Kumar, Stecher, Li, Knyaz and Tamura2018). Initiation and termination codons were identified by comparing the resulting sequences with the reference mt genome sequence of T. hydatigena (Accession No: NC_012896). Multiple sequence alignment with the reference sequence was used to locate and identify the protein-coding and tRNA genes. Codon usage and nucleotide composition for both haplogroups were analysed using MEGA X v10.0.5 (Kumar et al., Reference Kumar, Stecher, Li, Knyaz and Tamura2018). Relative synonymous codon usage (RSCU) values >1.0 indicate that the corresponding codons are used more frequently than the expected frequency whereas the reverse is true for RSCU values <1.0. Therefore, in the absence of any codon usage bias, the RSCU values would be 1. To examine both haplogroups for nucleotide bias, skew values (−1 to +1) were estimated with the formula: AT skew = (A − T)/(A + T) and GC skew = (G − C)/(G + C) (Perna and Kocher, Reference Perna and Kocher1995).
Population indices
The number of haplotypes and population diversity indices (haplotype diversity and nucleotide diversity) were calculated in DnaSP v6 (Rozas et al., Reference Rozas, Ferrer-Mata, Sanchez-DelBarrio, Guirao Librado, Ramos-Onsins and Sanchez-Gracia2017), while neutrality indices Tajima's D (Tajima, Reference Tajima1989) and Fu's Fs (Fu, Reference Fu1997) and the pairwise fixation index (F ST) were estimated in Arlequin v.3.5.2.2 (Excoffier et al., Reference Excoffier, Laval and Schneider2005). The diversity and neutrality indices and F ST values were also estimated separately for Haplogroups A and B populations.
Phylogeny and network analysis
Median-joining networks were first constructed based on the sequences of the nad1 and nad5 genes for 82 isolates. Following the observation of distinct clusters, 26 isolates were randomly selected for median-joining network construction using the concatenated sequences of the 12 protein-coding genes, the individual protein-coding genes of the complete mt genome and the sequences of nuclear protein-coding gene (pepck). The network construction was achieved with PopART (http://popart.otago.ac.nz). The phylogeny was constructed using the Maximum Likelihood (ML) method with bootstrap settings of 1000 replications in MEGA X (Kumar et al., Reference Kumar, Stecher, Li, Knyaz and Tamura2018). The best-fit model of sequence evolution (TrN + G) (Tamura and Nei, Reference Tamura and Nei1993) was determined by jModelTest based on the Akaike Information Criterion (AIC) (Darriba et al., Reference Darriba, Taboada, Doallo and Posada2012), while the Bayesian phylogeny was carried out with MrBayes v3.1.2 using the 12 protein-coding (10 089 bp) gene sequences. Markov Chain Monte Carlo (MCMC) sampling was used to assess the posterior distribution of parameters with a chain length of 10 000 000 states, and 25% was discarded as burn-in. Parameters were logged every 1000 states. The final consensus tree was displayed using TreeView v.1.6.6. (http://taxonomy.zoology.gla.ac.uk/rod/treeview.html).
Results
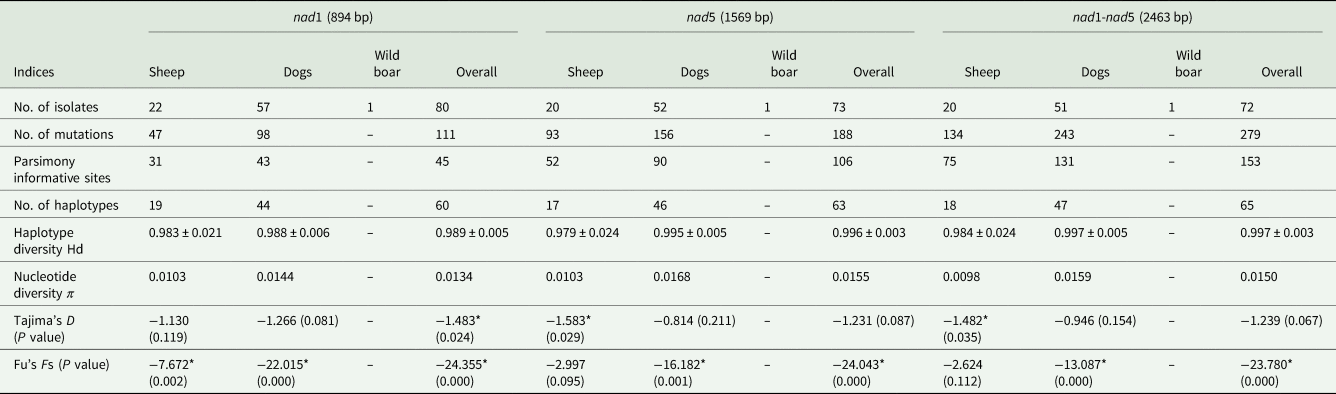
The complete nad1 (894 bp) and nad5 (1569 bp) mitochondrial genes were analysed in a total of 82 T. hydatigena isolates originating from dogs (59), sheep (22) and a wild boar. Out of these isolates, 80 and 73 were successfully amplified for nad1 and nad5 genes, respectively. A very high nucleotide variation was observed for both genes resulting in 111 and 188 mutations with 45 and 106 parsimony informative sites, respectively (Table 2). Overall, 60 and 63 haplotypes were found for the nad1 and nad5 genes, respectively. Further analysis of 72 concatenated nad1-nad5 nucleotide sequences, resulted in 279 mutations with 153 parsimony informative sites and a total of 65 haplotypes (Table 2).
Diversity and neutrality indices for Taenia hydatigena populations from Chinese dogs, sheep and wild boar based on nad1, nad5 and concatenated nad1-nad5 mitochondrial gene sequences

*Significant P value (P < 0.05).
Median-joining network and nucleotide variation based on the nad1 and nad5 mitochondrial genes
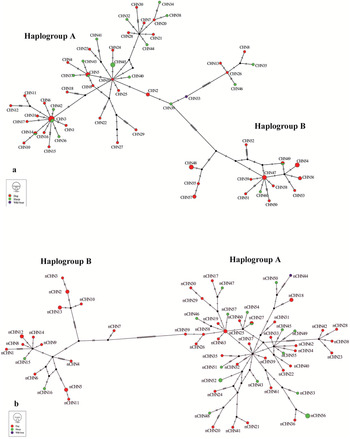
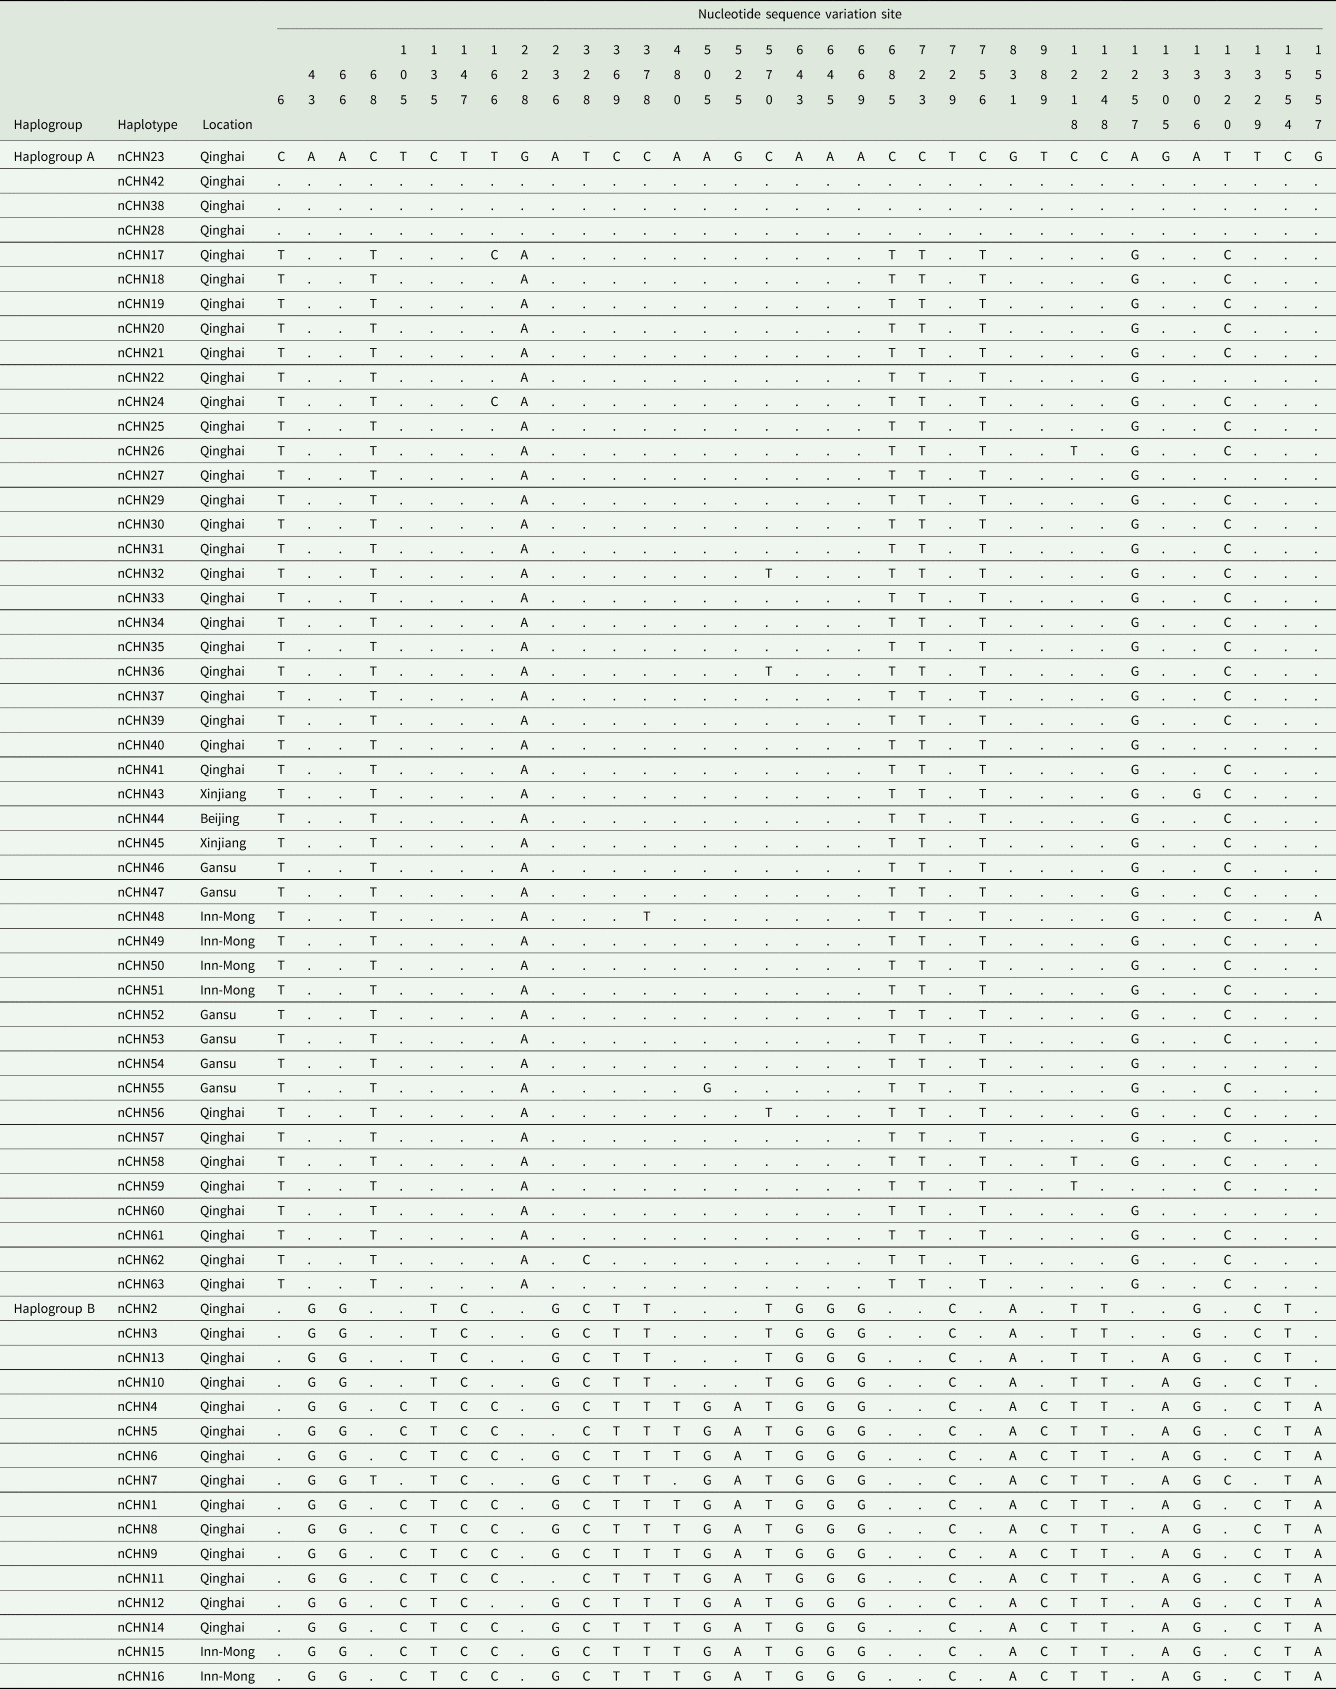
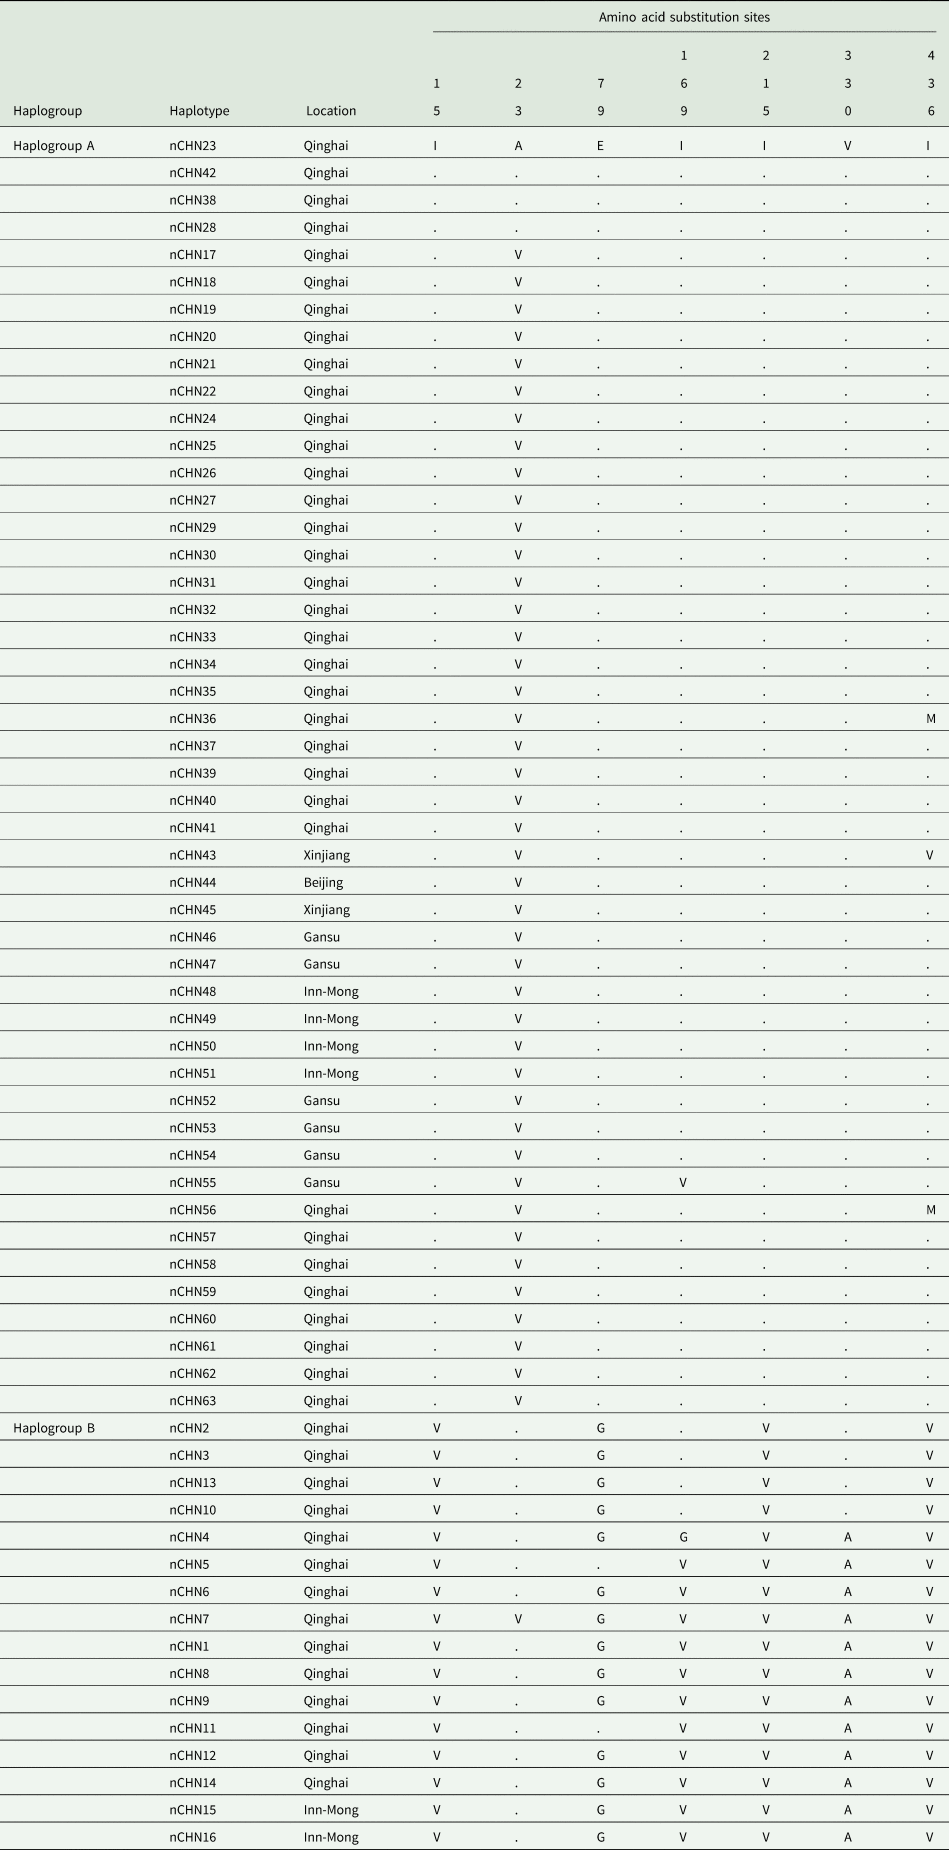
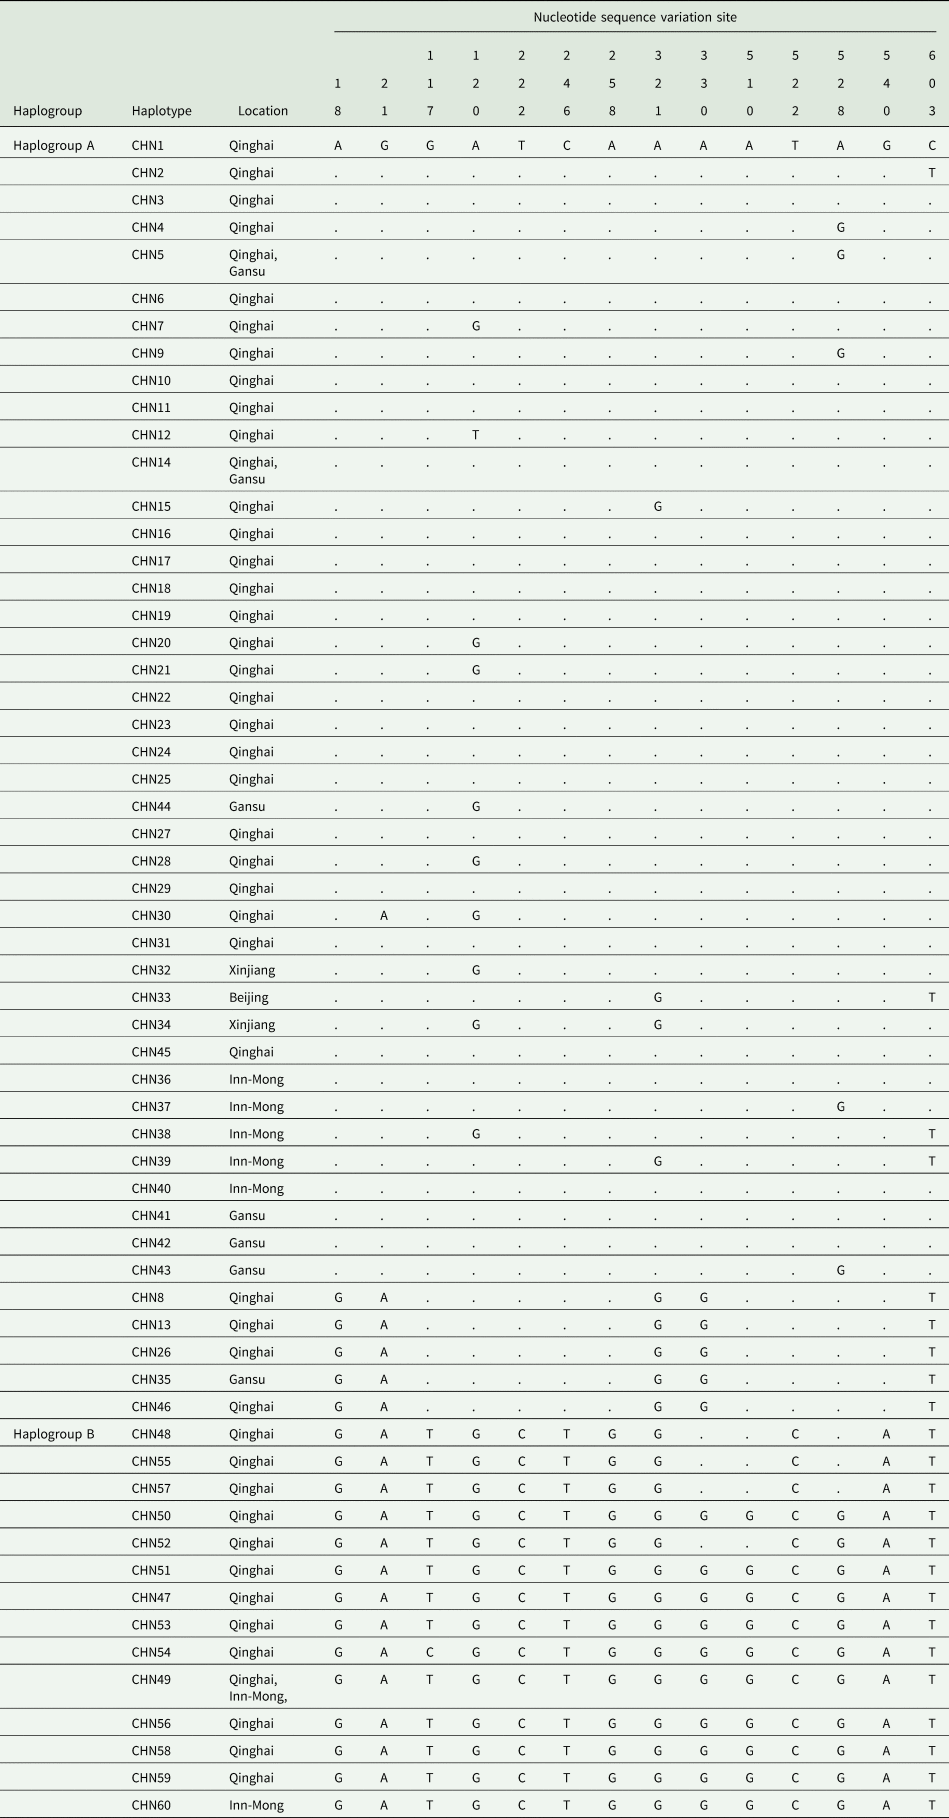
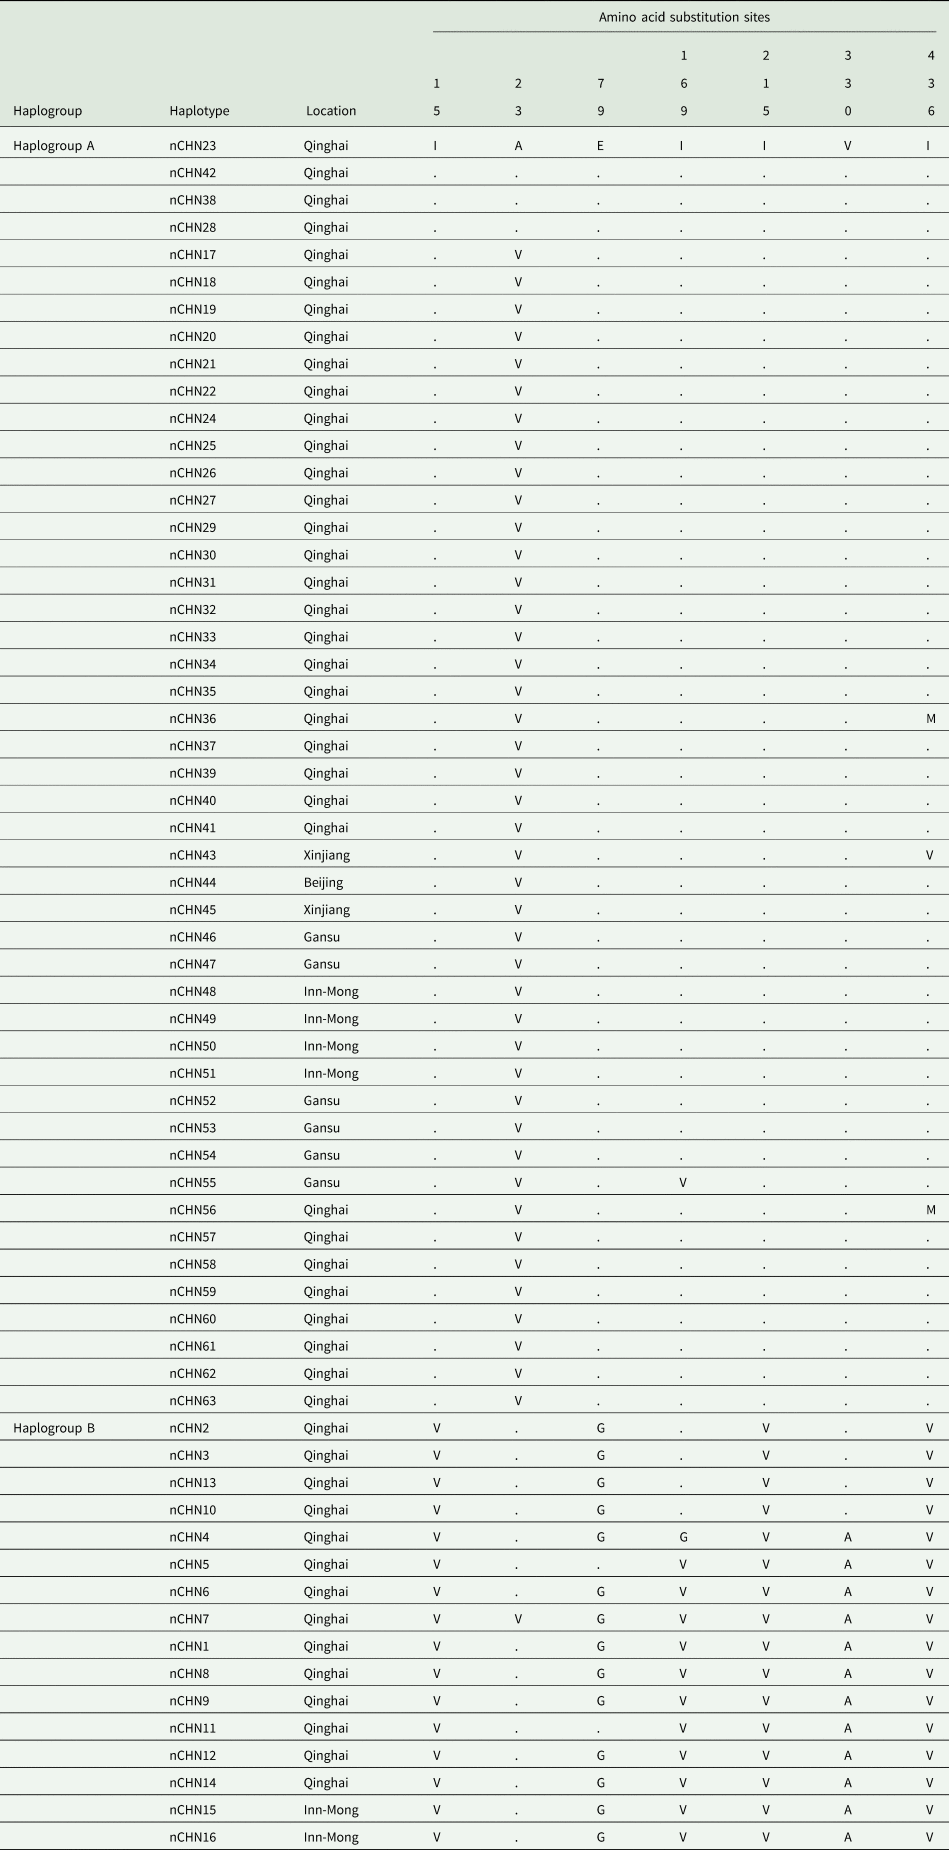
The structure of the median-joining networks revealed two main clusters designated as Haplogroups A and B (Fig. 1a, b). Multiple sequence alignment of the nucleotide sequences of both haplogroups showed synonymous (amino acid unchanged: nad1 and nad5) and non-synonymous (change in amino acid: nad5 only) (Tables 3–5) substitutions at the peculiar polymorphic sites between Haplogroups A and B. Further examination of the nad1 and nad5 gene sequences showed 14 and 35 positions, respectively, that were potentially useful in differentiating both haplogroups, i.e. positions where Haplogroup A differs from B by a specific nucleotide base (Tables 3 and 4).
Median-joining network of Taenia hydatigena populations based on (a) nad1, (b) nad5.

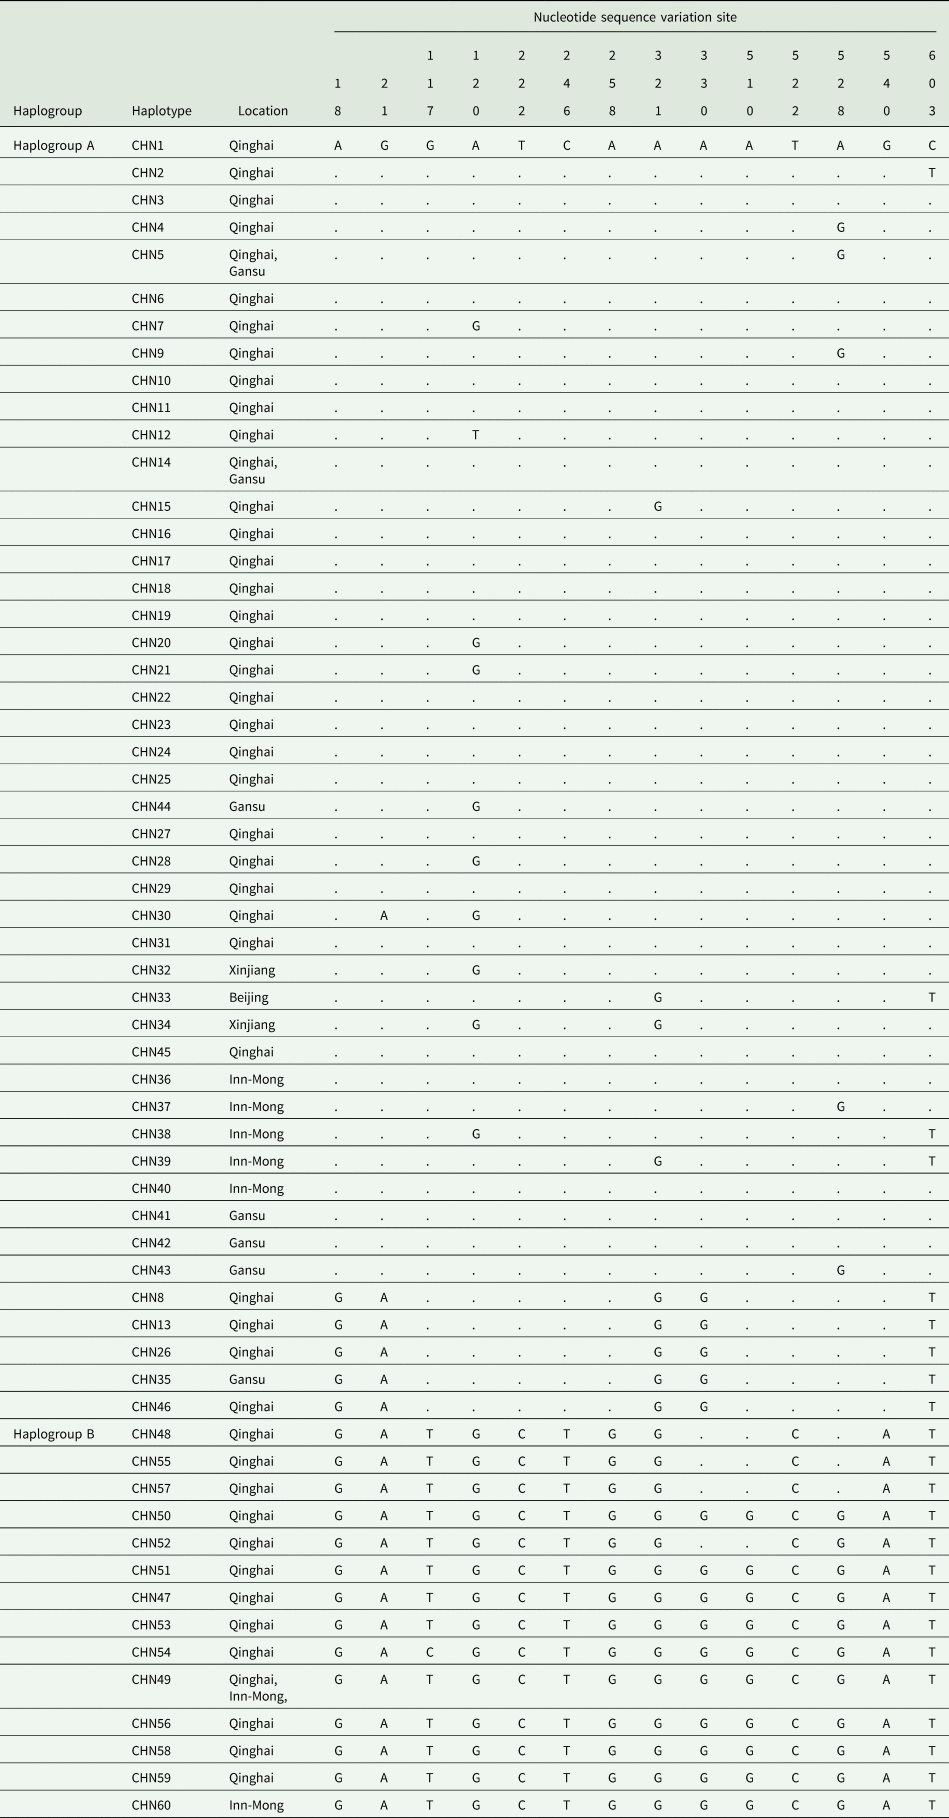
nad1 nucleotide sequence variation of the observed diagnostic sites for Haplogroups A and B
nad5 nucleotide sequence variation of the observed diagnostic sites for Haplogroups A and B
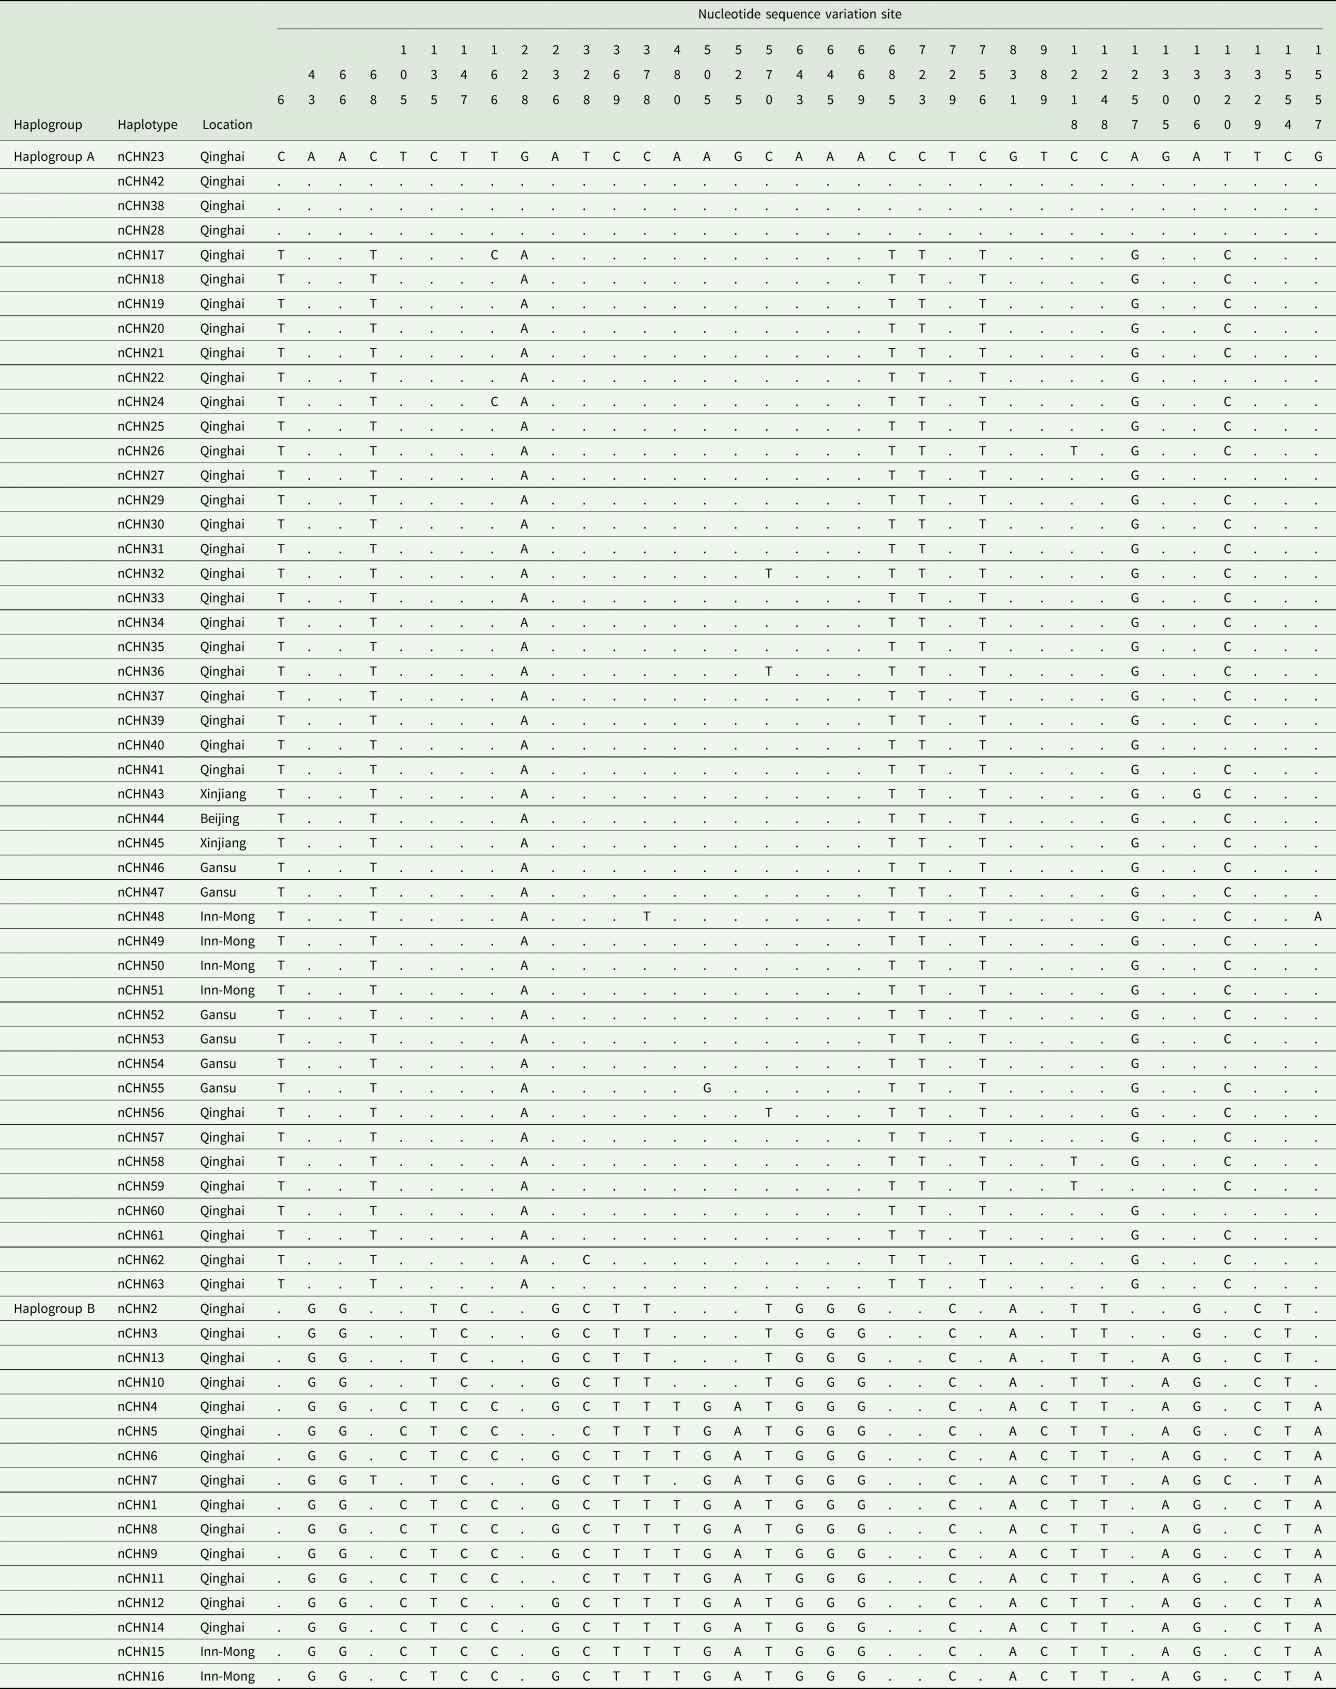
Inn-Mong, Inner Mongolia.
nad5 amino acid substitution for the diagnostic sites of Haplogroups A and B
Out of the 14 defining positions identified for nad1 gene, 6 sites were purely diagnostic (positions 117, 222, 246, 258, 522 and 540) (Table 3). At these positions, Haplogroup A isolates were represented by a particular nucleotide base whereas all Haplogroup B samples were represented by a different base (Table 3). At positions 18, 21, 120, 321 and 603, all isolates in Haplogroup B were occupied by G, A, G, G and T, respectively, whereas were substituted in the majority of Haplogroup A members by A, G, A, A and C, with few members having nucleotide bases characteristic of Haplogroup B. Similarly, in position 510, all Haplogroup A isolates were characterized by A but were substituted with G in most Haplogroup B members. Also, at positions 330 and 528, most Haplogroup A members were characterized by A, while Haplogroup B members were characterized by G. In these two positions, members of Haplogroup A had nucleotide bases peculiar to Haplogroup B and vice versa (Table 3).
Of the 35 defining positions found in nad5 gene sequences, 12 positions (43, 66, 135, 147, 369, 643, 645, 669, 729, 831, 1248 and 1554) were purely diagnostic with peculiar nucleotide bases for both haplogroups (Table 4). Also, at positions 105, 236, 480, 525, 989, 1305 and 1329, all Haplogroup A members were characterized by T, A, A, G, T, G and T, whereas Haplogroup B members were characterized by C, G, T, A, C, A and C, with few members having nucleotide bases peculiar to Haplogroup A. Similarly, at positions 6, 228, 328, 378, 570, 685, 723, 756, 1218, 1257 and 1306, all Haplogroup B members were characterized by C, G, C, T, T, C, C, C, T, A and G, respectively, whereas Haplogroup A was characterized by T, A, T, C, C, T, T, T, C, G and A, respectively, with few members also containing nucleotide bases peculiar to Haplogroup B (Table 4). Furthermore, at positions 68, 166, 505, 1320 and 1557, most members of Haplogroup A were characterized by T, T, A, C and G whereas C, C, G, T and A, respectively, were characteristic of most members of Haplogroup B while some isolates from each haplogroup had nucleotide bases peculiar to the other groups at these five positions (Table 4). Interestingly, for the nad5 gene, some of the nucleotide substitutions peculiar to the haplogroups resulted in specific amino acid changes in seven positions such that two positions (15 and 215) were purely diagnostic (Table 5). Of the changes, Isoleucine (Haplogroup A) was substituted by Valine (Haplogroup B) in 4 of the 7 positions except in some haplotypes where it was replaced with Methionine. Two other positions had Valine changed to Alanine while the last change was from Glutamic acid to Glycine.
Within each haplogroup, some patterns of variation were also observed suggesting subclusters. For example, for nad1 gene, peculiar nucleotide substitutions were observed for haplotypes CHN8, CHN13, CHN26, CHN35 and CHN46 in contrast to other Haplogroup A members (Table 3) and for nad5 gene, at positions 6, 68, 228, 685, 723, 756, 1257 and 1320, the same isolates represented by haplotypes nCHN23, nCHN28, nCHN38 and nCHN42 also showed peculiar nucleotide changes (Table 4). Similarly, for the nad1 gene of the members of Haplogroup B, positions 330, 510 and 528 were occupied by distinct nucleotide bases in haplotypes CHN48, CHN55 and CHN57 compared to other members of the haplogroup (Table 3). While for nad5 gene, positions 105, 166, 480, 505, 525, 989 and 1557 showed specific nucleotide substitutions for haplotypes nCHN2, nCHN3, nCHN10 and nCHN13 (Table 4). The corresponding amino acid change according to the nad5 gene is shown in Table 5.
Neutrality and diversity indices
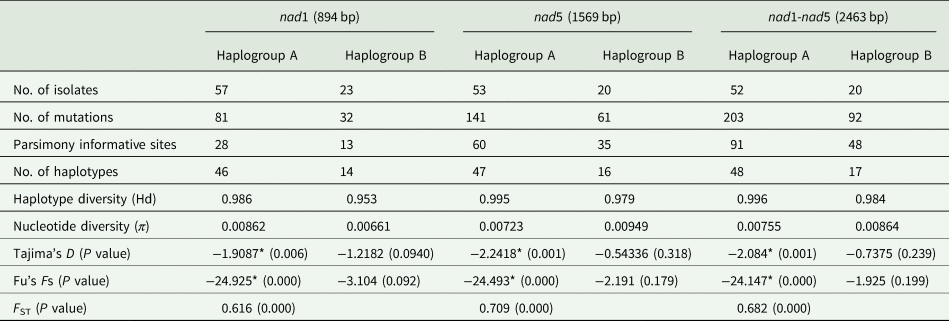
Overall, high haplotype diversity >0.9 with nucleotide diversity of 0.0134 and 0.0155 was observed for the population based on the nad1 and nad5 genes, respectively. Also, Tajima's D was negative and insignificant (nad1 gene) for the individual host population but was only significant for the population from sheep on analysing the nad5 gene. On concatenation of both genes, Tajima's D was also significant for the population from sheep. Conversely, Fu's F was negative and significant except for nad5 and the concatenated nad1-nad5 genes of the population from sheep. Overall, the neutrality indices indicated a deviation from neutrality suggesting population expansion (Table 2). Meanwhile, on comparing the diversity indices for both haplogroups, Haplogroup A demonstrated a significant deviation from neutrality consistent with an expanding population unlike Haplogroup B population (Table 6). Pairwise comparison between the members of both haplogroups resulted in very high F ST values favouring genetic differentiation (Table 6).
Population indices of Taenia hydatigena haplogroups from China based on nad1, nad5 and concatenated nad1-nad5 mitochondrial gene sequences

*Significant P value (P < 0.05)
Complete mitochondrial DNA, nuclear and phylogenetic analysis
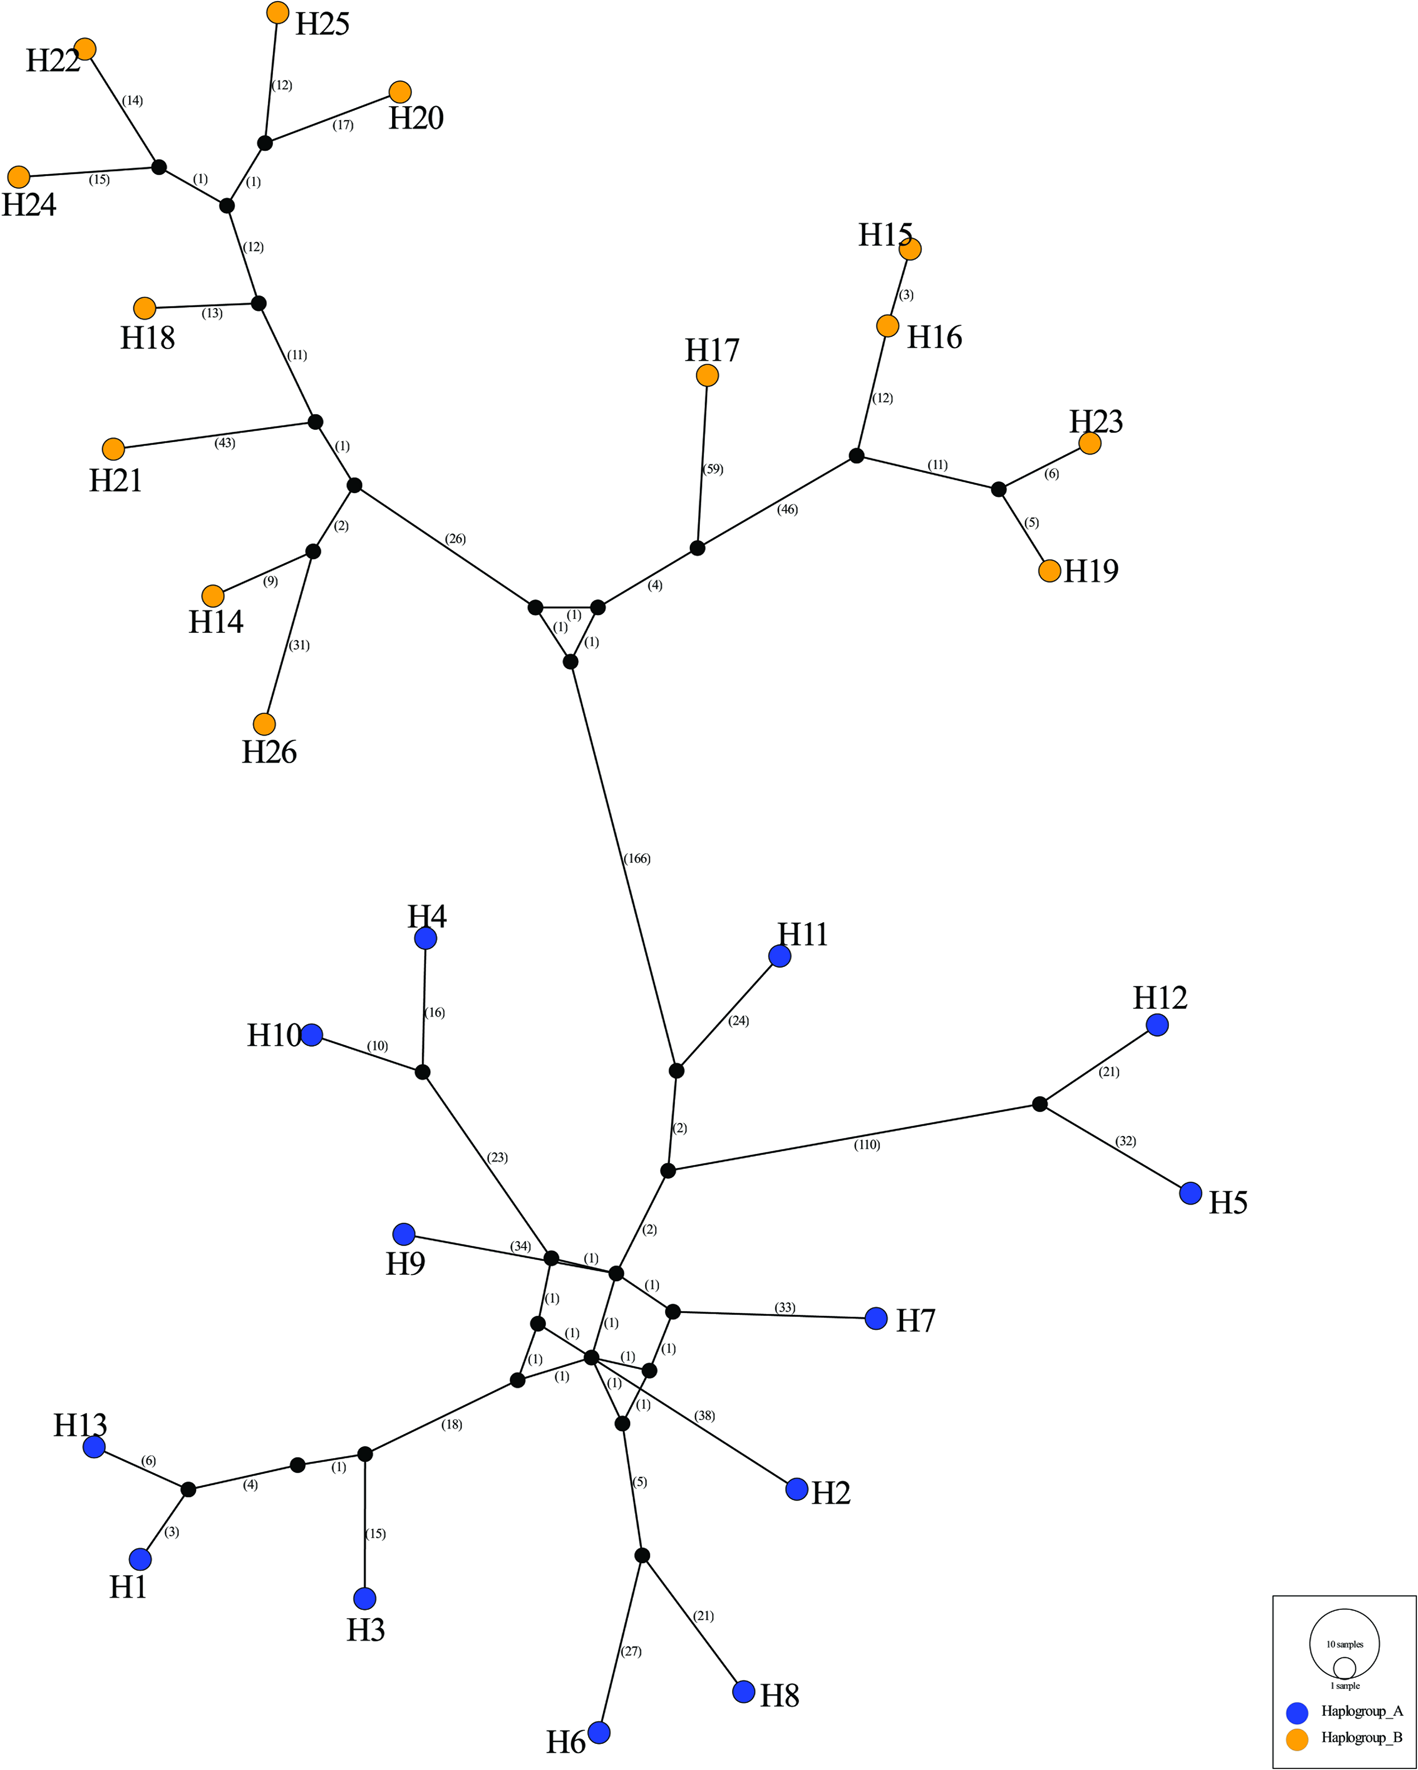
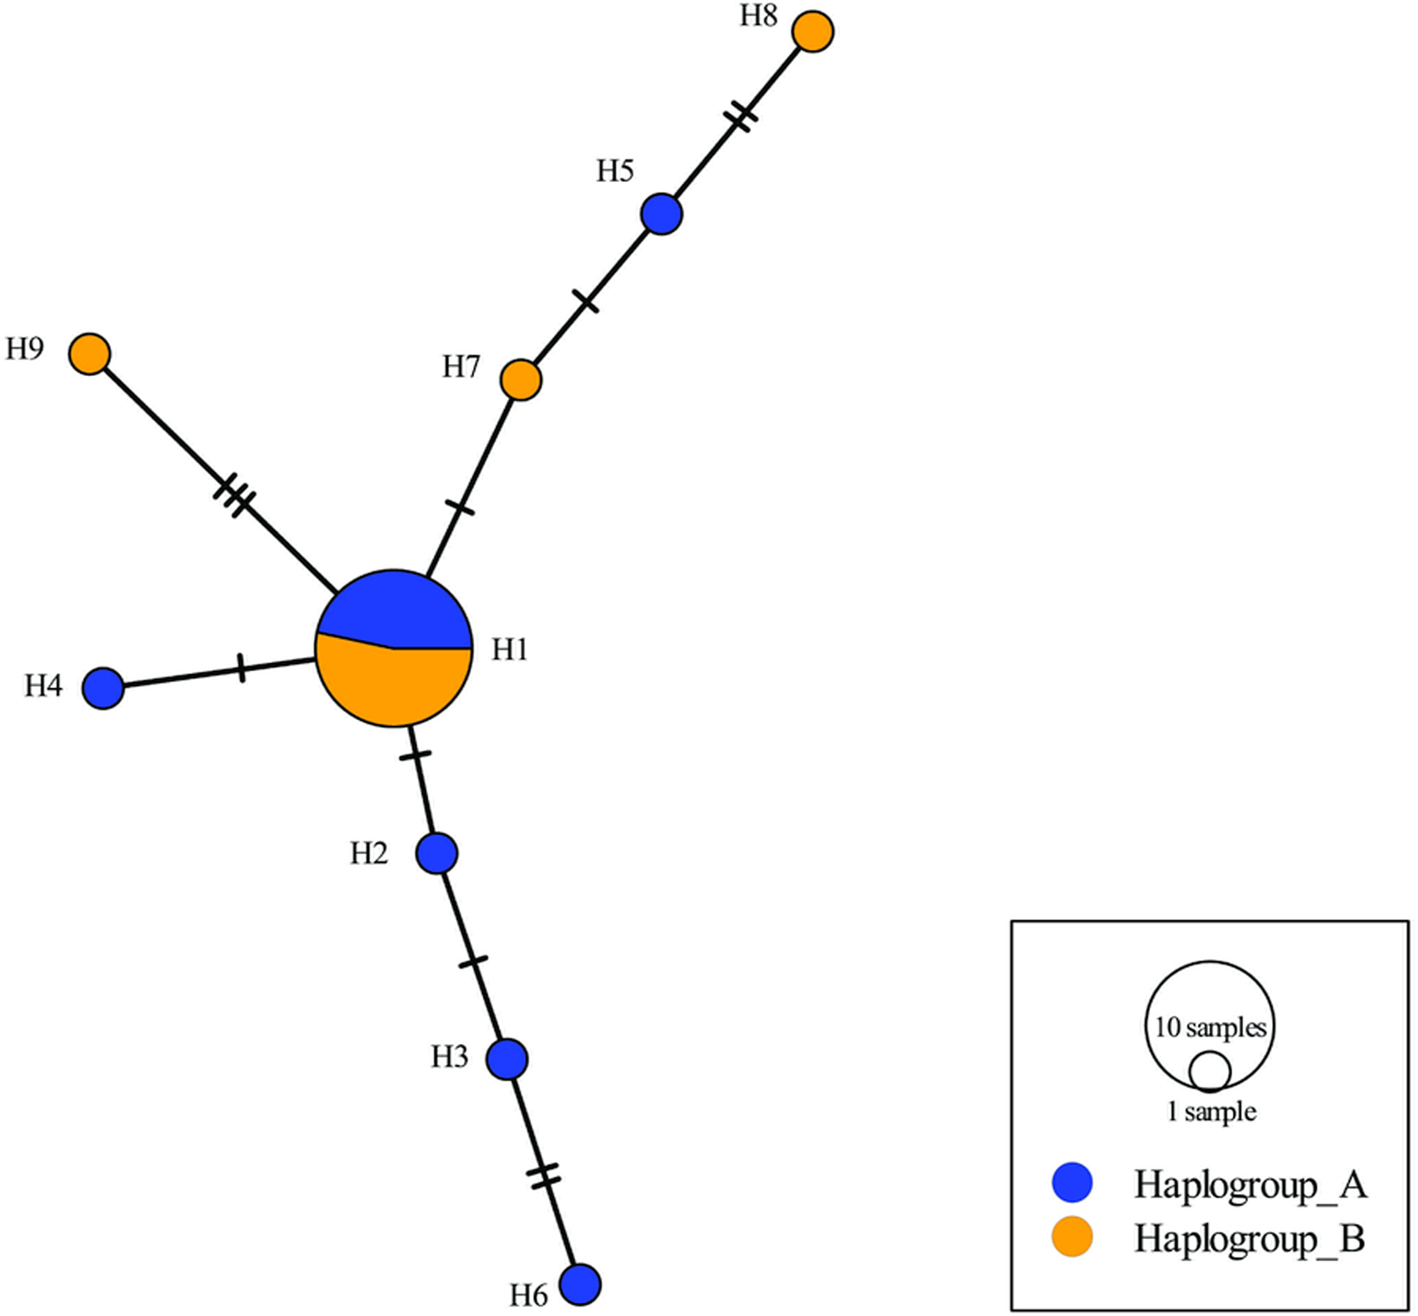
The complete mt genomes of 26 randomly selected isolates representing both haplogroups (13 each) were further amplified to confirm the genetic differences of the haplogroups observed in the nad1 and nad5 genes. A total of 13 485–13 494 bp were realized and the phylogenetic network based on the 12 protein-coding genes demonstrated a total of 166 mutations separating both haplogroups (Fig. 2). Meanwhile, no gene re-arrangement was observed between the mitochondrial genome of both subgroups. The transitions and transversions ratio (Ts/Tv) of the protein-coding genes for Haplogroups A, B and the overall population were 10.592, 10.033 and 12.784, respectively. The codon usage for the 12 protein-coding mitochondrial genes of both haplogroups differs marginally (Supplementary Table 1). The RSCU values indicated a general bias (more frequently used) towards codons having nucleotide U in the third position (Supplementary Table 1). The average nucleotide composition of the protein-coding region of the mitochondrial genome was T 47.94%, C 8.60%, A 22.99%, G 20.47% (Haplogroup A) and T 48.00%, C 8.54%, A 22.93%, G 20.52% (Haplogroup B) (Table 7). For both haplogroups, the AT skew was negative, while the GC skew was positive, indicating asymmetry in nucleotide composition between strands, such that one strand is rich in A and C, and the other in G and T (Table 7).
Median-joining network of the concatenated 12 protein-coding genes confirming the existence of both haplogroups separated by a total of 166 mutations.

Average base composition and related statistics (skewness evaluation) for the 12 mitochondrial protein-coding genes of Haplogroups A and B

Note: Estimation was done using 13 representative sequences for each haplogroup.
The pairwise fixation index (F ST) value between both haplogroups based on the entire mt genome was 0.974. The genetic variation observed between the haplogroups was also evident from the networks constructed by the individual protein-coding genes using the 26 representative isolates (Supplementary Fig. 1a-l). According to the constructed networks, all 12 protein-coding genes successfully differentiated both haplogroups, except the cytb gene where the resolution was poor. Of these genes, the nad4 and nad5 demonstrated the highest number of mutations (22 and 30, respectively) separating both haplogroups. Additionally, the cox1 mitochondrial gene commonly employed in parasite diversity studies showed about 9 mutation steps between both haplogroups (Supplementary Fig. 1i). Based on this gene, the nucleotide diversity was higher for Haplogroup A than B. Also, the observed negative Tajima's D and Fu's Fs were significant for Haplogroups A and B, respectively (Supplementary Table 2).
Meanwhile, analysis of the nuclear protein-coding gene pepck did not show any significant nucleotide variation between the members of both haplogroups suggesting that the haplogroups may not differ in their nuclear makeup (Fig. 3).
Median-joining network of representative Haplogroup A and B members of Taenia hydatigena constructed with the nuclear protein-coding gene pepck.

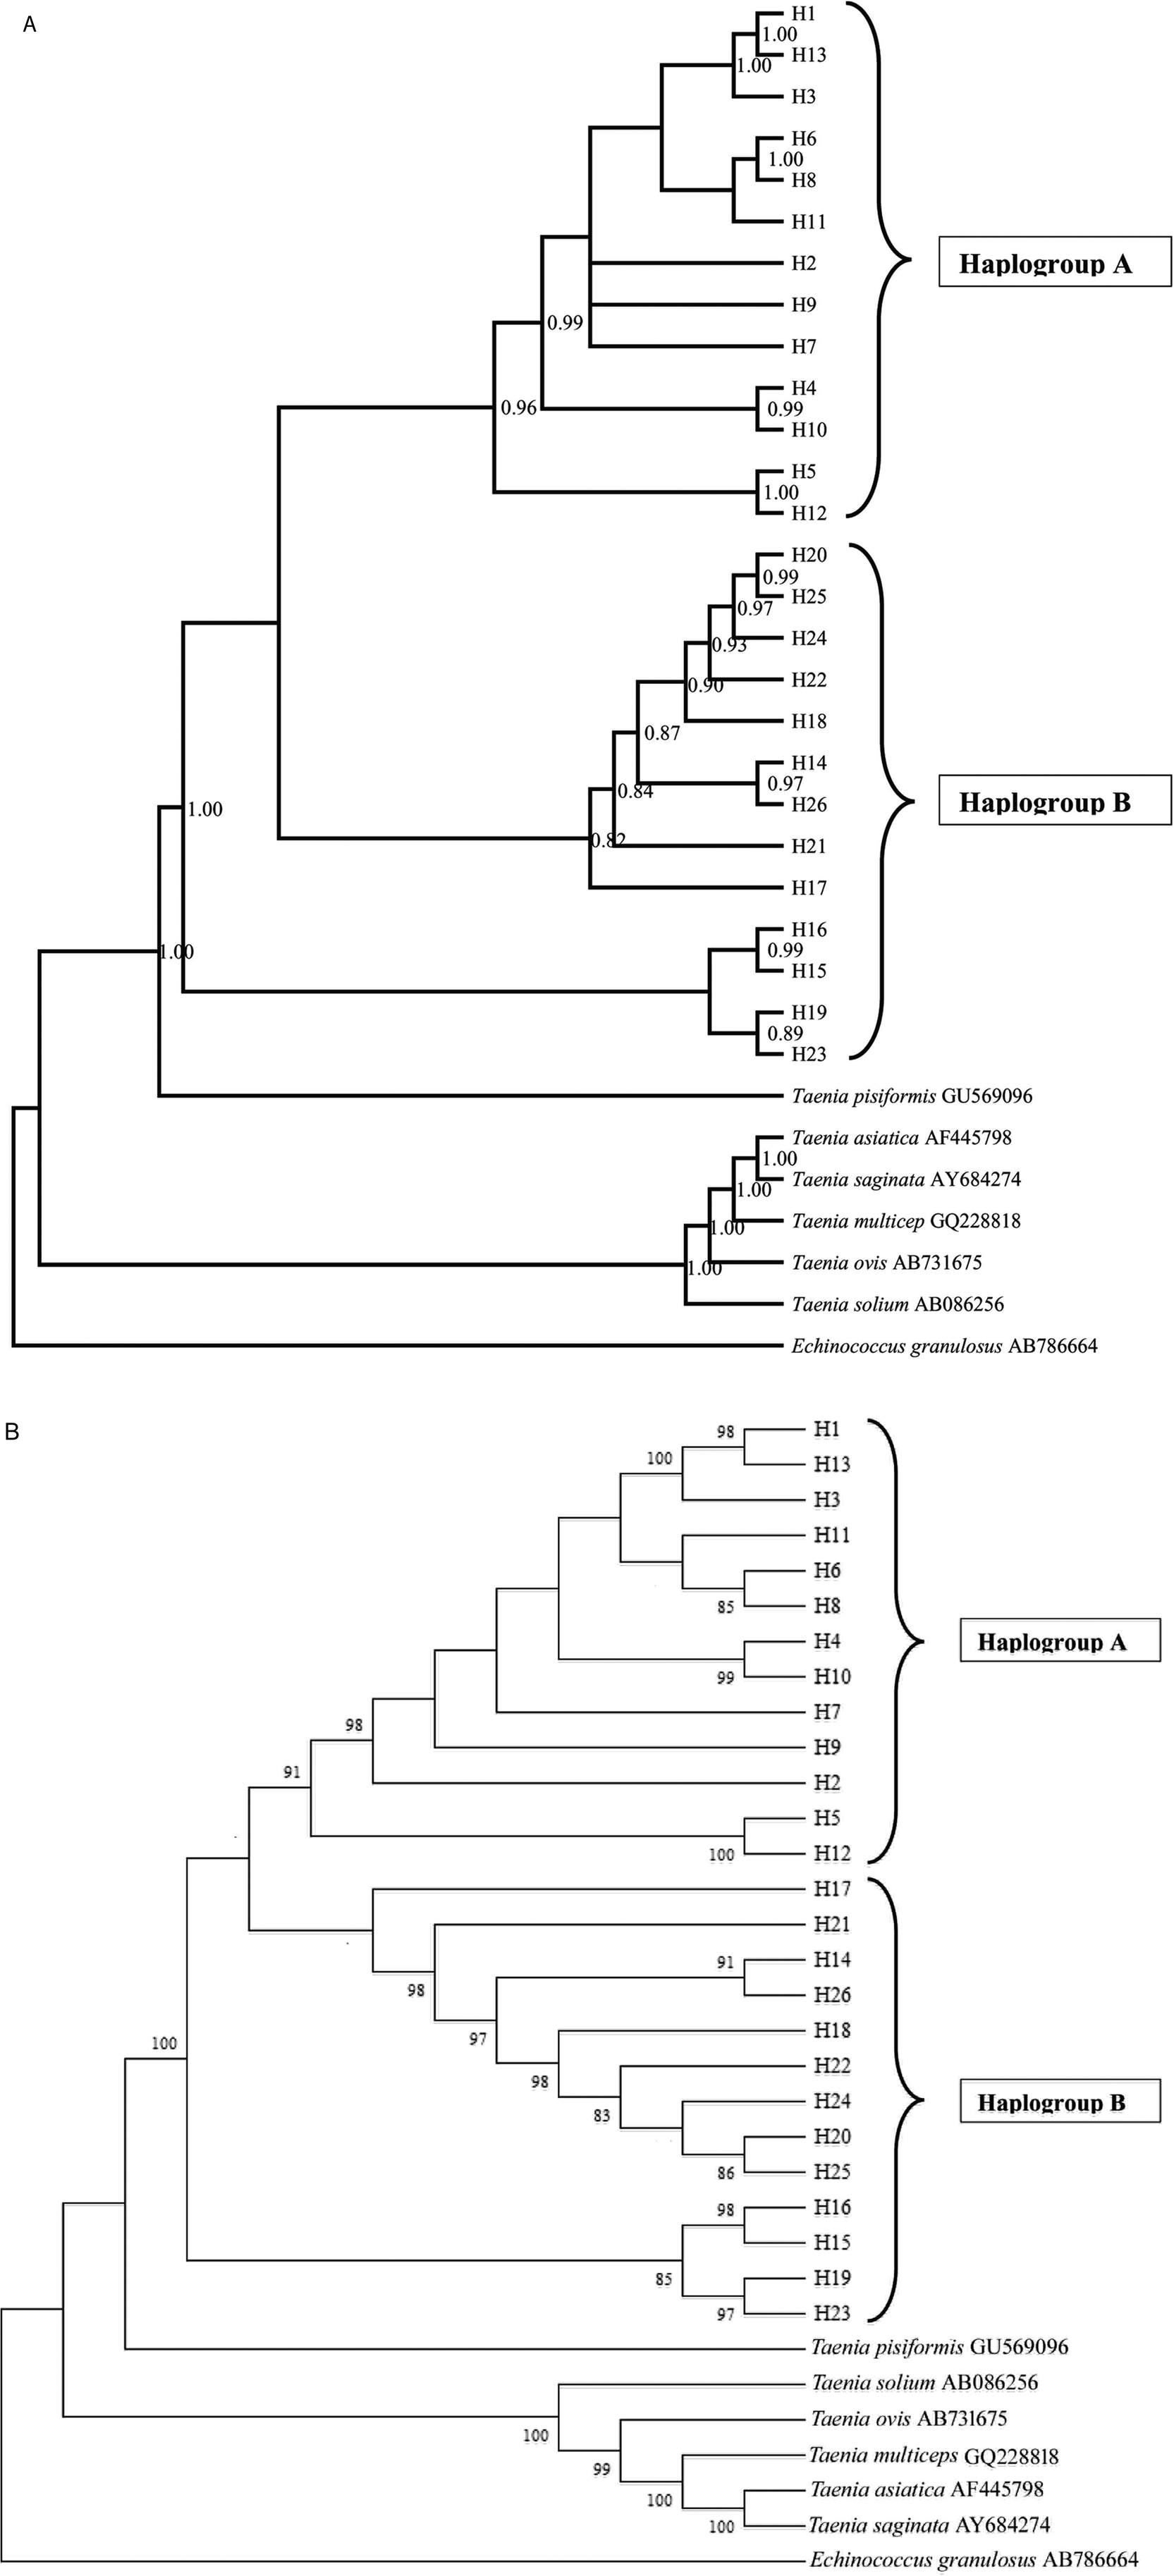
The Bayesian and ML phylogeny constructed by the concatenated sequences of the 12 protein-coding genes of the mt genome clearly showed both haplogroup clusters with high nodal support (Fig. 4a, b). The aberrant haplotypes/variants within each haplogroup were also visible in the tree.
Phylogenetic relationship of Taenia hydatigena haplogroups inferred using the 12 protein-coding mitochondrial gene sequences by Bayesian inference (a) and the Maximum Likelihood (ML) method (b). Echinococcus granulosus (GenBank: AB786664) was used as an outgroup. Nodal support values <80 are not shown.

Discussion
Genetic diversity within the populations of T. hydatigena remains poorly understood. Despite infection with T. hydatigena does not have zoonotic implications, it remains a significant risk to livestock production, and a better understanding of the genetic diversity could potentially be useful for many areas of research including anthelmintic treatment, epidemiology, molecular diagnostics, drug/vaccine development and control.
So far, recent evidence suggests very high genetic variations within T. hydatigena (Ohiolei et al., Reference Ohiolei, Luka, Zhu, Yan, Li, Magaji, Alvi, Wu, Li, Fu and Jia2019). In the present study, molecular investigation of T. hydatigena populations sampled from dogs and sheep in China demonstrated high haplotype diversity and the presence of rare haplotypes as seen in the highly significant negative values of Fu's F as expected from an expanding population. The expanding population of T. hydatigena observed in this study is in tandem with the observations of Boufana et al. (Reference Boufana, Scala, Lahmar, Pointing, Craig, Dessì, Zidda, Pipia and Varcasia2015) in Italy, but is in contrast to that of Nigerian sheep where a bottleneck event has been suggested to have occurred at a point in their evolutionary history (Ohiolei et al., Reference Ohiolei, Luka, Zhu, Yan, Li, Magaji, Alvi, Wu, Li, Fu and Jia2019). Meanwhile, according to Boufana et al. (Reference Boufana, Scala, Lahmar, Pointing, Craig, Dessì, Zidda, Pipia and Varcasia2015), the presence of a central haplotype in a star-like population structure was observed based on partial cox1 genes (324 bp) but the current population structure of T. hydatigena in China based on the different 12 protein-coding mitochondrial genes and the full mt genome sequences presents a more complex configuration with no central haplotype. This presents a challenge regarding the existence of a central or a widespread haplotype for T. hydatigena. However, with the available evidence, the existence of a central or widespread haplotype remains unclear (Kilinc et al., Reference Kilinc, Kesik and Simsek2019; Ohiolei et al., Reference Ohiolei, Luka, Zhu, Yan, Li, Magaji, Alvi, Wu, Li, Fu and Jia2019) and resolving this will require the availability of longer mitochondrial DNA data across different hosts and geographical locations.
The phylogenetic networks of the nad1 and nad5 mitochondrial genes were characterized by two major clusters designated as Haplogroups A and B. Both groups showed very high haplotype diversity with low nucleotide diversity. However, the neutrality indices demonstrated an expanding population for Haplogroup A which presented a complex star-like configuration with significant negative Tajima's D and Fu's F values whereas haplogroup B appeared to be evolving without significant deviation from neutrality. The possible absence of gene flow between both groups, an indication of genetic differentiation, was supported by very high significant F ST values. Meanwhile, under conditions of sympatry, gene flow is said to occur between species/genotypes but the haplogroups in this case, even though allele sharing was possible as they occupy the same geographical region, still show high pairwise differences and maintain distant positions on the mitochondrial phylogeny. However, there were some defining positions (Tables 3 and 4) where nucleotide bases were shared between both groups.
The genetic differences observed between the haplogroups were higher than the existing differences between designated genotypes in the case of other taeniids, e.g. Echinococcus (Bowles et al., Reference Bowles, Blair and McManus1992; Bowles and McManus, Reference Bowles and McManus1993; Laurimäe et al., Reference Laurimäe, Kinkar, Moks, Romig, Omer, Casulli, Umhang, Bagrade, Irshadullah, Sharbatkhori, Mirhendi, Ponce-Gordo, Soriano, Varcasia, Rostami-Nejad, Andresiuk and Saarma2018a, Reference Laurimäe, Kinkar, Romig, Omer, Casulli, Umhang, Gasser, Jabbar, Sharbatkhori, Mirhendi, Ponce-Gordo, Lazzarini, Soriano, Varcasia, Rostami Nejad, Andresiuk, Maravilla, González, Dybicz, Gawor, Šarkūnas, Šnábel, Kuzmina and Saarma2018b). In Echinococcus, the genetic differences is strongly supported by the transmission pattern or preference to certain intermediate hosts involved in the transmission or geography. In this study, although not many host types were investigated, it was observed that Haplogroup B was constituted majorly by T. hydatigena isolates from dogs with only two sheep isolates observed among the cluster while the majority of sheep isolates were found in Haplogroup A, suggesting that members of Haplogroup B may be poorly adapted to sheep. Also, no distinct pattern was observed in terms of the geographical distribution across China as Haplogroups A and B were both found in the same provinces and autonomous regions located either in north-western or other northern regions of China. However, it will be important to know if the current genetic diversity exists outside China. While our investigation acknowledges some limitations in terms of host types and geographical coverage, recent data from wild boars, moose, red deer (Cengiz et al., Reference Cengiz, Yucel Tenekeci and Bilgen2019; Filip et al., Reference Filip, Pyziel, Jeżewski, Myczka, Demiaszkiewicz and Laskowski2019), sheep and goats (Kilinc et al., Reference Kilinc, Kesik and Simsek2019; Ohiolei et al., Reference Ohiolei, Luka, Zhu, Yan, Li, Magaji, Alvi, Wu, Li, Fu and Jia2019; Sarvi et al., Reference Sarvi, Ebrahimi Behrestaghi, Alizadeh, Abdollah Hosseini, Gohardieh, Bastani, Yazdani Charati, Daryani, Amouei, Spotin and Gholami2020) from other countries, have reported very high genetic variation within T. hydatigena populations than previously thought. Therefore, more investigations across the globe using longer mtDNA, e.g. concatenated nad1-nad5 and nad4-nad5 genes may further help understand the phylogenetic relationship and genetic diversity within T. hydatigena populations across different geographical locations.
Previously, evidence of differences between the morphology and biochemical components of cystic fluids of T. hydatigena larval stages from different hosts has suggested the possibility of high genetic diversity among T. hydatigena that could be similar to that of Echinococcus spp. (Varma and Rao, Reference Varma and Rao1973; Varma and Ahluwalia, Reference Varma and Ahluwalia1986, Reference Varma and Ahluwalia1987; Abidi et al., Reference Abidi, Nazami, Khan, Ahmad and Irshadullah1989). In this study, the pairwise fixation index observed between T. hydatigena Haplogroup A and B populations based on the nad1 (F ST = 0.617), nad5 (F ST = 0.712), concatenated nad1-nad5 (0.688) gene sequences and the complete mt genome sequences (0.974) was higher compared with the pairwise fixation index (F ST = 0.680) between E. canadensis G6 and G7 genotypes estimated using the complete mt genome sequences (Laurimäe et al., Reference Laurimäe, Kinkar, Romig, Omer, Casulli, Umhang, Gasser, Jabbar, Sharbatkhori, Mirhendi, Ponce-Gordo, Lazzarini, Soriano, Varcasia, Rostami Nejad, Andresiuk, Maravilla, González, Dybicz, Gawor, Šarkūnas, Šnábel, Kuzmina and Saarma2018b). The nucleotide sequence variation of the 12 protein-coding genes within T. hydatigena was significantly higher than the sequence variation exhibited between some genotypes within E. granulosus complex. For example, between E. canadensis genotypes G6 and G7, about 20 point mutations were reported based on the 12 protein-coding genes (Ohiolei et al., Reference Ohiolei, Li, Yan, Fu and Jia2020) and about 28 based on the entire mt genome (Laurimäe et al., Reference Laurimäe, Kinkar, Romig, Omer, Casulli, Umhang, Gasser, Jabbar, Sharbatkhori, Mirhendi, Ponce-Gordo, Lazzarini, Soriano, Varcasia, Rostami Nejad, Andresiuk, Maravilla, González, Dybicz, Gawor, Šarkūnas, Šnábel, Kuzmina and Saarma2018b), but in the case of T. hydatigena as seen in this study, 166 point mutations were observed which suggests the possible existence of variants with different mitochondrial lineages. This was also supported by the high F ST values and nodal support based on the Bayesian and ML phylogeny that divided both haplogroups into distinct clusters. However, evidence from the different mitochondrial genes and the complete mt genome networks points to the existence of some aberrant haplotypes within each haplogroup cluster suggesting more divergent haplotypes within each haplogroup. Meanwhile, a Ts/Tv ratio plotted against the genetic distance (Supplementary Fig. 2) confirms that the sequences have not experienced substitution saturation (i.e. transitions consistently outnumbering transversions) which otherwise could have accounted for the more divergent members. Regardless, the available data confirm the existence of a high genetic diversity within T. hydatigena that warrant further attention.
In conclusion, according to the median-joining network, supported by Bayesian and ML phylogeny and other statistical indices, two main T. hydatigena haplogroups were identified and differentiated by nad1-nad5 mitochondrial genes. Also, both haplogroups were distinguishable by 11/12 of the protein-coding genes except the cytochrome b gene. Notwithstanding, based on the mt genome analysis, we conclude that T. hydatigena population in China comprises highly diverse variants of different mitochondrial lineages suggesting the need for further investigation to determine if major haplotype/haplogroup division is possible.
Supplementary material
The supplementary material for this article can be found at https://doi.org/10.1017/S003118202000205X.
Financial support
This study was supported by the National Key Research and Development Program of China (2018YFC1602504, 2017YFD0501301), and Central Public-interest Scientific Institution Basal Research Fund (1610312020016).
Conflict of interest
None.
Ethical standards
Not applicable.