





1 Introduction
Strain is an important fluid motion in turbulence for many different reasons. First and foremost, local strain is associated with the kinetic energy dissipation rate,
 $\unicode[STIX]{x1D700}$
, which is given by
 $\unicode[STIX]{x1D700}=2\unicode[STIX]{x1D708}\unicode[STIX]{x1D61A}_{ij}\unicode[STIX]{x1D61A}_{ij}$
. Here,
 $\unicode[STIX]{x1D708}$
is the kinematic viscosity and
 $\unicode[STIX]{x1D64E}$
is the strain-rate tensor, which is the symmetric part of the velocity gradient tensor. The energy dissipation rate is one of the key physical quantities in a turbulent flow, as its mean value,
 $\unicode[STIX]{x1D700}_{mean}$
, is the net rate of energy transfer from the large to the small scales. Furthermore, it determines the Kolmogorov length scale,
 $\unicode[STIX]{x1D702}=(\unicode[STIX]{x1D708}^{3}/\unicode[STIX]{x1D700}_{mean})^{1/4}$
, and the Kolmogorov velocity scale,
 $u_{\unicode[STIX]{x1D702}}=(\unicode[STIX]{x1D700}_{mean}\unicode[STIX]{x1D708})^{1/4}$
, which characterize the small-scale fluid motions. Secondly, strain acts on vorticity,
 $\unicode[STIX]{x1D74E}$
, causing vorticity stretching or compression according to the vorticity equation:
 $$\begin{eqnarray}\frac{\text{D}\unicode[STIX]{x1D74E}}{\text{D}t}=\unicode[STIX]{x1D64E}\unicode[STIX]{x1D74E}+\unicode[STIX]{x1D708}\unicode[STIX]{x1D6FB}^{2}\unicode[STIX]{x1D74E}.\end{eqnarray}$$
Specifically, the stretching of vorticity by the strain-rate tensor is the production mechanism of enstrophy,
 $\unicode[STIX]{x1D714}^{2}$
. Moreover, significant production of enstrophy and dissipation occur in strain-dominated regions of the flow (Tsinober, Ortenberg & Shtilman Reference Tsinober, Ortenberg and Shtilman1999; Tsinober Reference Tsinober, Hunt and Vassilicos2000). Because, vorticity and strain are not fully independent, their interaction is nonlinear (e.g. Lüthi, Tsinober & Kinzelbach Reference Lüthi, Tsinober and Kinzelbach2005). Thirdly, strain is involved in the dispersion of passive tracers and scalars. For instance, strain leads to stretching of material lines similarly to vorticity stretching (Guala et al.
Reference Guala, Lüthi, Liberzon, Tsinober and Kinzelbach2005), influences the scalar dissipation rate (Kothnur & Clemens Reference Kothnur and Clemens2005) and plays a role in flame extinction (Peters & Williams Reference Peters and Williams1983). Additionally, strain has attracted attention because of its multi-scale character. For instance, strain is linked to dissipation, hence it is associated with the small-scale motions in the flow. At the same time, it is influenced by fluid motions at larger scales, since the evolution of the strain-rate tensor involves the pressure Hessian, which is non-local (Ohkitani & Kishiba Reference Ohkitani and Kishiba1995; Hamlington, Schumacher & Dahm Reference Hamlington, Schumacher and Dahm2008). The strain field may thus provide clues as to the nature of the scale interactions that exist in turbulent flows, which remains an unresolved issue. A related issue is the use of the larger-scale strain to estimate the sub-grid-scale stresses in large-eddy simulations (LES) (Meneveau & Katz Reference Meneveau and Katz2000), which requires knowledge of the relationships between small- and large-scale straining motions in turbulence. A fifth and final reason highlighting the importance of strain is that certain (small-scale) flow properties appear universal across different flows, when they are evaluated with respect to the local principal straining axes. In this case, strain provides a local frame of reference. Universality of turbulence is of theoretical interest, but also highly relevant to the development of generally applicable LES turbulence models. The apparent universal properties are discussed in more detail next.
A well-known feature of small-scale turbulence is the preferential alignment of the vorticity vector with the direction of intermediate principal strain. This behaviour has been observed in a broad range of turbulent flows, as well as across Reynolds numbers (e.g. Ashurst et al.
Reference Ashurst, Kerstein, Kerr and Gibson1987; Tsinober, Kit & Dracos Reference Tsinober, Kit and Dracos1992; Vincent & Meneguzzi Reference Vincent and Meneguzzi1994; Kholmyansky, Tsinober & Yorish Reference Kholmyansky, Tsinober and Yorish2001; Lüthi et al.
Reference Lüthi, Tsinober and Kinzelbach2005). These flows include isotropic turbulence, turbulent shear flow, turbulent boundary layers and atmospheric turbulence. The orientation of the vorticity vector,
 $\unicode[STIX]{x1D74E}$
, relative to the directions of principal strain has received considerable attention, because it determines the contribution of each principal strain rate to vorticity stretching (Betchov Reference Betchov1956; Ashurst et al.
Reference Ashurst, Kerstein, Kerr and Gibson1987). This can be seen by rewriting the stretching term in the enstrophy equation (i.e.
 $\unicode[STIX]{x1D74E}^{\text{T}}\unicode[STIX]{x1D64E}\unicode[STIX]{x1D74E}$
) as
 $\unicode[STIX]{x1D714}^{2}\unicode[STIX]{x1D70E}_{i}(\cos (\unicode[STIX]{x1D703}_{i}))^{2}$
, where
 $\unicode[STIX]{x1D70E}_{i}$
are the principal strain rates, i.e. eigenvalues of
 $\unicode[STIX]{x1D64E}$
, and
 $\unicode[STIX]{x1D703}_{i}$
are the angles between the vorticity vector,
 $\unicode[STIX]{x1D74E}$
, and the directions of principal strain, i.e. the eigenvectors
 $\unicode[STIX]{x1D740}_{i}$
of the strain-rate tensor
 $\unicode[STIX]{x1D64E}$
. Subsequently, the eigenvectors
 $\unicode[STIX]{x1D740}_{i}$
were frequently used as a frame of reference in Lagrangian or pointwise studies of strain–vorticity interaction and material line stretching (e.g. Dresselhaus & Tabor Reference Dresselhaus and Tabor1991; Nomura & Post Reference Nomura and Post1998; Guala et al.
Reference Guala, Lüthi, Liberzon, Tsinober and Kinzelbach2005). While vorticity aligns with the intermediate principal strain at small scales, it preferentially aligns with the most stretching principal strain at larger scales (Ishihara, Yamazaki & Kaneda Reference Ishihara, Yamazaki, Kaneda, Kambe, Nakano and Miyauchi2001; Hamlington et al.
Reference Hamlington, Schumacher and Dahm2008; Leung, Swaminathan & Davidson Reference Leung, Swaminathan and Davidson2012; Fiscaletti et al.
Reference Fiscaletti, Elsinga, Attili, Bisetti and Buxton2016). Because these studies did not consider Reynolds number variations, it remains unclear at what scale this cross-over in the alignment appears.
Another universal feature of the strain-rate tensor is related to its invariants, which are measures for the energy dissipation rate and provide information on the local generalized flow topology (Soria et al.
Reference Soria, Sondergaard, Cantwell, Chong and Perry1994). In particular, the shape of the joint probability density function (p.d.f.) of the invariants appears similar for different turbulent flows, such as mixing layers, isotropic and wall-bounded turbulence (Soria et al.
Reference Soria, Sondergaard, Cantwell, Chong and Perry1994; Blackburn, Mansour & Cantwell Reference Blackburn, Mansour and Cantwell1996; Chong et al.
Reference Chong, Soria, Perry, Chacin, Cantwell and Na1998; Ooi et al.
Reference Ooi, Martin, Soria and Chong1999). It is identical to the universality observed in the joint-p.d.f. of the invariants of the velocity gradient tensor. The invariants are computed directly from the eigenvalues of the respective tensor, that is, the principal strain rates in the case of
 $\unicode[STIX]{x1D64E}$
(Chong, Perry & Cantwell Reference Chong, Perry and Cantwell1990).
The mentioned universal features appear when using the eigenvectors of the strain-rate tensor as a frame of reference, either explicitly to determine the orientation of vorticity or implicitly when computing the corresponding eigenvalues and tensor invariants. It suggests that the eigenvectors of the local strain-rate tensor define a natural basis to study turbulent motions. This idea was exploited by Elsinga & Marusic (Reference Elsinga and Marusic2010), who evaluated the average velocity field in this local reference frame, also known as the strain eigenframe (for a detailed description of the methodology see § 2.1 below). Their results showed a shear layer coincident with stretched vortices, which separated two large-scale nearly uniform flow regions (see also figure 1). The resulting flow pattern was similar for wall-bounded turbulence and homogeneous isotropic turbulence. Furthermore, such a flow structure was shown to be consistent with known properties of small-scale turbulence like the alignment of vorticity with the intermediate principal straining direction, the teardrop shape of the joint-p.d.f. of the velocity gradient tensor invariants, the sheet-like shape of intense dissipation and the tube-like shape of vortices (see also § 2.3). Moreover, this average shear layer structure contains large- and small-scale turbulent motions simultaneously (Wei et al.
Reference Wei, Elsinga, Brethouwer, Schlatter and Johansson2014), with relative amplitudes consistent with the well-known
 $k^{-5/3}$
energy spectrum scaling in actual turbulent flow (Elsinga & Marusic Reference Elsinga and Marusic2016). Additionally, the
 $k^{-5/3}$
spectrum scaling appears when considering isotropic as well as anisotropic flow conditions, i.e. in isotropic and most of the anisotropic intersections of the same shear layer structure. These results reflect the multi-scale character of turbulent strain field.
Like the Burgers vortex, the average shear layer structure can be considered as a model to illustrate the theory of turbulence (Burgers Reference Burgers1948). However, the average shear layer structure differs from the Burgers vortex in that it takes into account the spatial organization and the environment of the vortices as obtained from the analysis of actual turbulent flow. In fact the shear layer structure represents the average flow associated with strain. The environment of the vortices is particularly relevant when examining multi-scale aspects of turbulence. The Burgers vortex appears most successful in the analysis of vortex cores (e.g. Jimenez et al. Reference Jimenez, Wray, Saffman and Rogallo1993), but does not capture the environment, i.e. larger scales, accurately (Pirozzoli Reference Pirozzoli2012). In particular, the strain acting on a Burgers vortex is constant, which strongly contrasts with the complex strain field observed in turbulent flows, which the average shear layer structure is able to capture. Furthermore, the analysis of average flow patterns may benefit turbulence model development. For example, Lawson & Dawson (Reference Lawson and Dawson2015) showed that the directions of principal strain and the eigenvectors of the pressure Hessian misalign in the shear layer structure, which affects the velocity gradient dynamics. This effect is not well captured by certain turbulence models, as explained in their paper.
Shear layer structures have also been observed as characteristic features of instantaneous turbulent flows (Schwarz Reference Schwarz1990; Meinhart & Adrian Reference Meinhart and Adrian1995; Ishihara, Kaneda & Hunt Reference Ishihara, Kaneda and Hunt2013; Hunt et al.
Reference Hunt, Ishihara, Worth and Kaneda2014; Eisma et al.
Reference Eisma, Westerweel, Ooms and Elsinga2015). Such instantaneous shear layers are non-uniformly distributed in space and, similar to the average shear layer structure, they contain intense vorticity and dissipation and they bound large-scale flow regions. The intense dissipation in the instantaneous shear layers contributes importantly to the overall dissipation of kinetic energy in the flow, which is why these layers are considered significant. Moreover, the intermittent and highly dissipative small-scale structures are essential features in some of the universal scaling laws proposed for turbulence (She & Leveque Reference She and Leveque1994). The existence of shear layers is consistent with intense vortices being clustered on the border of large-scale velocity eddies (Jimenez et al.
Reference Jimenez, Wray, Saffman and Rogallo1993; Moisy & Jimenez Reference Moisy and Jimenez2004) and the alignment of nearby vortices (Vincent & Meneguzzi Reference Vincent and Meneguzzi1994). However, these observations were made at relatively low Reynolds number based on the Taylor micro-scale (
 $Re_{\unicode[STIX]{x1D706}}<170$
), where the turbulent scales are not well separated. Ishihara et al. (Reference Ishihara, Kaneda and Hunt2013) examined one such instantaneous shear layer in direct numerical simulation (DNS) of homogeneous isotropic turbulence at high Reynolds number. Their Reynolds number based on the Taylor micro-scale
 $Re_{\unicode[STIX]{x1D706}}$
was 1131, which resulted in a clear separation of scales. The thickness of this layer was approximately 4–
 $5\unicode[STIX]{x1D706}_{T}$
, where
 $\unicode[STIX]{x1D706}_{T}$
is the Taylor micro-scale, while the length of the layer was comparable to the integral length scale,
 $L$
. The core diameter of the vortical structures within the layer was
 ${\sim}10\unicode[STIX]{x1D702}$
, consistent with other numerical and experimental studies of intense vortices (Jimenez et al.
Reference Jimenez, Wray, Saffman and Rogallo1993; Tanahashi et al.
Reference Tanahashi, Kang, Miyamoto, Shiokawa and Miyauchi2004; Ganapathisubramani, Lakshminarasimhan & Clemens Reference Ganapathisubramani, Lakshminarasimhan and Clemens2008). Furthermore, a visual comparison of this high Reynolds number instantaneous shear layer with the vortical structures at lower Reynolds number (
 $Re_{\unicode[STIX]{x1D706}}=94$
) suggested a transition in the forms of the vortical structure at some intermediate
 $Re_{\unicode[STIX]{x1D706}}$
(Ishihara et al.
Reference Ishihara, Kaneda and Hunt2013). A further statistical analysis is needed to establish the Reynolds number dependence of the shear layer dimensions, and detail possible Reynolds number transitions in flow structure.
Here, we perform a comprehensive scaling analysis of the average shear layer structure in the strain eigenframe, which aims to address the questions related to the Reynolds number dependence of flow structure. These shear layer structures represent the velocity field associated with the local strain. The work is motivated by the importance of local strain in understanding several physical processes in turbulent flow, the potential universality of the results in the strain eigenframe, and the similarity between the average shear layer structure and the instantaneous flow structure, as discussed above.
The average flow fields in the strain eigenframe are computed for
 $Re_{\unicode[STIX]{x1D706}}=34.6$
up to 1131 using existing DNS of homogeneous isotropic turbulence (§ 2). As such, it extends a similar analysis by Wei et al. (Reference Wei, Elsinga, Brethouwer, Schlatter and Johansson2014) for inhomogeneous, anisotropic wall-bounded turbulence by (i) considering a different turbulent flow and (ii) considerably expanding the Reynolds number range, hence scale separation. The flow velocity associated with the local strain is examined at different turbulent length scales (§ 3.1). The comparison with the results obtained by Wei et al. (Reference Wei, Elsinga, Brethouwer, Schlatter and Johansson2014) allows assessing of the similarity in the Reynolds number scaling between the different flows, which may reveal quantitative universality (compared to the qualitative similarity in flow pattern observed before, Elsinga & Marusic Reference Elsinga and Marusic2010). Furthermore, the scaling of vorticity and dissipation within the shear layer is considered (§§ 3.2–3.3), from which a coherence length for the small scales is defined. It is shown that vorticity is coherent over much larger distances than the typical vortex core diameters of
 ${\sim}10\unicode[STIX]{x1D702}$
. Following Hamlington et al. (Reference Hamlington, Schumacher and Dahm2008) the velocity in the strain eigenframe is decomposed in a local and a non-local component, where the former is the velocity induced by the shear layer vorticity (§ 3.4). The results reveal the turbulent motions at different scales and their interaction. Based on the scaling results, we identify Reynolds number transitions (§ 3.5). The comparison between the average and the instantaneous shear layer at
 $Re_{\unicode[STIX]{x1D706}}=1131$
(Ishihara et al.
Reference Ishihara, Kaneda and Hunt2013) is discussed in § 3.6 resulting in a conceptual picture for the structure of turbulence in the low and high Reynolds number regime. Furthermore, the Reynolds number dependence of the cross-over in vorticity alignment with the intermediate principal strain (at small scales) and the most stretching strain (at larger scales) is determined (§ 4). Finally, we assess the large- and small-scale motions in the average shear layer structure when conditioned on intense or extreme dissipation (§ 5). We expect these results to improve our understanding of the turbulent motions associated with the local strain and to help advance turbulence modelling.
2 Analysis of flow patterns in principal strain coordinates
2.1 Methodology
The method for obtaining the average flow structure in the local frame of reference, i.e. the strain eigenframe, was introduced in Elsinga & Marusic (Reference Elsinga and Marusic2010). Here, we briefly summarize the approach. The axes of the eigenframe are set by the eigenvectors of the local strain-rate tensor
 $\unicode[STIX]{x1D64E}=(\unicode[STIX]{x1D63C}^{\text{T}}+\unicode[STIX]{x1D63C})/2$
, which is the symmetric part of the velocity gradient tensor
 $\unicode[STIX]{x1D63C}$
. The eigenvectors of the strain-rate tensor,
 $\unicode[STIX]{x1D740}_{i}$
, are orthogonal and they correspond to the principal straining directions. Here,
 $\unicode[STIX]{x1D740}_{1}$
,
 $\unicode[STIX]{x1D740}_{2}$
and
 $\unicode[STIX]{x1D740}_{3}$
denote the most stretching, the intermediate and the most compressive straining directions, respectively. It is important to note that the eigenvectors
 $\unicode[STIX]{x1D740}_{i}$
have no well-defined positive direction due to the symmetry of
 $\unicode[STIX]{x1D64E}$
(i.e. in terms of the strain field there is no distinction between
 $\unicode[STIX]{x1D740}_{i}$
and
 $-\unicode[STIX]{x1D740}_{i}$
). Because
 $\unicode[STIX]{x1D740}_{2}$
preferentially aligns with the vorticity vector
 $\unicode[STIX]{x1D74E}$
(Ashurst et al.
Reference Ashurst, Kerstein, Kerr and Gibson1987), we choose the positive
 $\unicode[STIX]{x1D740}_{2}$
direction such that its inner product with the vorticity vector is positive. As in Elsinga & Marusic (Reference Elsinga and Marusic2010), the positive
 $\unicode[STIX]{x1D740}_{3}$
direction is arbitrarily selected, while the
 $\unicode[STIX]{x1D740}_{1}$
direction is adjusted to maintain a right-handed coordinate system. The resulting
 $\unicode[STIX]{x1D740}_{1}$
,
 $\unicode[STIX]{x1D740}_{2}$
and
 $\unicode[STIX]{x1D740}_{3}$
define the axes of a local frame of reference, which is referred to as the strain eigenframe.
Then the flow field surrounding a point
 $P$
is mapped onto the local strain eigenframe, which is determined from the strain-rate tensor
 $\unicode[STIX]{x1D64E}$
at
 $P$
as explained above. The mapping is performed by interpolating the flow velocity on a uniform rectangular grid centred on
 $P$
with coordinates (
 $\unicode[STIX]{x1D709}_{1}$
,
 $\unicode[STIX]{x1D709}_{2}$
,
 $\unicode[STIX]{x1D709}_{3}$
) along the corresponding
 $\unicode[STIX]{x1D740}_{i}$
directions. Finally, the resampled velocity fields on (
 $\unicode[STIX]{x1D709}_{1}$
,
 $\unicode[STIX]{x1D709}_{2}$
,
 $\unicode[STIX]{x1D709}_{3}$
) are averaged over all data points considered. The resulting flow field represents the average flow around the origin (
 $(\unicode[STIX]{x1D709}_{1},\unicode[STIX]{x1D709}_{2},\unicode[STIX]{x1D709}_{3})=\mathbf{0}$
) as seen when the observer is aligned with the local principal strain axes. The velocity components in this frame of reference are denoted by
 $u_{1}$
,
 $u_{2}$
and
 $u_{3}$
. In this paper we initially consider the unconditional average, that is, the averaging is performed considering all points in the flow. However, in § 5 a conditional averaging based on the dissipation magnitude is introduced.
2.2 DNS data sets of homogenous isotropic turbulence
Eight existing direct numerical simulations of forced homogeneous isotropic turbulence are analysed, in which the Reynolds number based on the Taylor micro-scale
 $Re_{\unicode[STIX]{x1D706}}$
varies between 34.6 and 1131. The lowest Reynolds numbers (
 $Re_{\unicode[STIX]{x1D706}}=34.6$
–177) were computed using the same numerical scheme as in Valente, da Silva & Pinho (Reference Valente, da Silva and Pinho2014). However, we consider a Newtonian fluid instead of the viscoelastic fluids in their paper. The data set at
 $Re_{\unicode[STIX]{x1D706}}=433$
is from the Johns Hopkins University turbulence database (Li et al.
Reference Li, Perlman, Wan, Yang, Meneveau, Burns, Chen, Szalay and Eyink2008). Finally, the
 $Re_{\unicode[STIX]{x1D706}}=257$
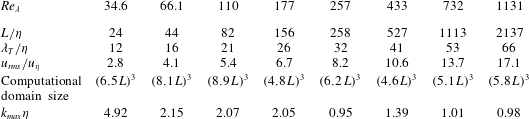
, 732 and 1131 cases are from Kaneda et al. (Reference Kaneda, Ishihara, Yokokawa, Itakura and Uno2003), Ishihara et al. (Reference Ishihara, Kaneda, Yokokawa, Itakura and Uno2007). Table 1 provides an overview of the relevant length and velocity scales in these flows. For comparison, in the study of wall-bounded turbulence by Wei et al. (Reference Wei, Elsinga, Brethouwer, Schlatter and Johansson2014) the ratio of the Taylor and Kolmogorov length scales,
 $\unicode[STIX]{x1D706}_{T}/\unicode[STIX]{x1D702}$
, varied between 20 and 26. The present data extend this range considerably as can be seen from the table.
Overview of length and velocity scales in the DNS data sets, where
 $L$
is the integral length scale,
 $\unicode[STIX]{x1D706}_{T}$
is the Taylor length scale,
 $\unicode[STIX]{x1D702}$
is the Kolmogorov length scale,
 $u_{rms}$
is the root-mean-square (r.m.s.) velocity and
 $u_{\unicode[STIX]{x1D702}}$
is the Kolmogorov velocity scale. The maximum wavenumber retained in the simulations is given by
 $k_{max}$
. The DNS at
 $Re_{\unicode[STIX]{x1D706}}=34.6$
–177 is from Valente et al. (Reference Valente, da Silva and Pinho2014). The data at
 $Re_{\unicode[STIX]{x1D706}}=433$
are from Li et al. (Reference Li, Perlman, Wan, Yang, Meneveau, Burns, Chen, Szalay and Eyink2008), while the data at
 $Re_{\unicode[STIX]{x1D706}}=257$
, 732 and 1131 are from Kaneda et al. (Reference Kaneda, Ishihara, Yokokawa, Itakura and Uno2003), Ishihara et al. (Reference Ishihara, Kaneda, Yokokawa, Itakura and Uno2007).
Average velocity field in the strain eigenframe for
 $Re_{\unicode[STIX]{x1D706}}=433$
. The velocity vectors are shown in two cross-planes (a,b). Contours show intensity dissipation (red, corresponding to 30 % of the peak dissipation) and intense swirling strength indicating vortical motion (green, corresponding to 80 % of the peak swirling strength). See Zhou et al. (Reference Zhou, Adrian, Balachandar and Kendall1999) and § 3.3 for the definition of swirling strength. Both the dissipation and the swirling strength are computed from the averaged velocity field.

Three-dimensional isosurfaces showing intense dissipation (red, 30 % of peak dissipation) and intense swirling strength (green, 80 % of peak swirling strength).
 $Re_{\unicode[STIX]{x1D706}}=433$
.

2.3 Features of the average flow pattern
The average velocity in the strain eigenframe reveals a shear layer flow structure (figure 1). The plane of the shear layer is at 45 degrees with respect to the
 $\unicode[STIX]{x1D709}_{1}$
and
 $\unicode[STIX]{x1D709}_{3}$
axes and contains the
 $\unicode[STIX]{x1D709}_{2}$
axis. Large-scale regions of nearly uniform flow appear on both sides of the layer. In these regions the flow direction and magnitude change only gradually. However, very strong changes in velocity, hence strong velocity gradients, are associated with the shear layer. This is illustrated by the red contour of intense dissipation (figure 1), which is computed from the averaged velocity field. It shows dissipation is strongest around the origin. The intense dissipation has a sheet-like shape and is associated with a node-saddle flow topology, which is consistent with observations in turbulent flows (Chacin & Cantwell Reference Chacin and Cantwell2000; Moisy & Jimenez Reference Moisy and Jimenez2004; Ganapathisubramani et al.
Reference Ganapathisubramani, Lakshminarasimhan and Clemens2008). The intense dissipation sheet is elongated in the direction of the shear layer and thin in the direction perpendicular to the layer. A three-dimensional view is provided in figure 2. Adjacent to the intense dissipation are two intense swirling regions indicated by the green contours (figures 1 and 2), which can be interpreted as vortices. These vortices are also contained within the shear layer. Moreover, they are tube-like as expected (Jimenez et al.
Reference Jimenez, Wray, Saffman and Rogallo1993; Ishihara, Gotoh & Kaneda Reference Ishihara, Gotoh and Kaneda2009). The spatial arrangement of vortex tubes next to intense dissipation sheets is again consistent with observations in fully turbulent flow fields (Chacin & Cantwell Reference Chacin and Cantwell2000; Ganapathisubramani et al.
Reference Ganapathisubramani, Lakshminarasimhan and Clemens2008). Note that weaker swirling strength regions appear in the curved shear flow outside the layer, but these are below the threshold used for visualization. The same flow features were identified previously in different turbulent flows. Therefore, the average flow pattern in the strain eigenframe is considered universal (Elsinga & Marusic Reference Elsinga and Marusic2010).
We explore the Reynolds number scaling of the various flow features below. Some additional coordinates are introduced in figure 1(a) to facilitate the scaling analysis. In particular,
 $n$
and
 $t$
refer to the direction perpendicular and tangential to the shear layer, while
 $s$
coincides with the
 $\unicode[STIX]{x1D709}_{2}$
axis. The corresponding velocity components are given by
 $u_{n}$
,
 $u_{t}$
and
 $u_{s}$
, respectively. The scaling analysis of the vortex tubes (§ 3.3) is performed with respect to the location of peak swirling strength along the
 $t$
axis. Relative to the swirl peak location, new
 $n_{p}$
and
 $s_{p}$
axes are defined, which are parallel to the original
 $n$
and
 $s$
axes.
3 Reynolds number scaling
This section examines the Reynolds number scaling of the average velocity field in the strain eigenframe (§ 3.1) and some of the distinct features contained within, such as, the intense dissipation sheet (§ 3.2) and the vortices (§ 3.3). Furthermore, non-local contributions to the velocity field are considered (§ 3.4). Based on the observed scaling, Reynolds number transitions in flow structure can be defined (§ 3.5), which are compared with the instantaneous layer (§ 3.6).
3.1 Velocity
The average velocity field in the strain eigenframe is anti-symmetric
 $(\boldsymbol{u}(\unicode[STIX]{x1D743})=-\boldsymbol{u}(-\unicode[STIX]{x1D743}))$
due to the symmetry of the strain-rate tensor on which it is based. This property has been used in the velocity profiles below to aid convergence. Consequently, only data along the positive axis are presented, as the negative axis is redundant due to the anti-symmetry. Please refer to figure 1(a) for the definition of the different axes.
First, the thickness of the shear layer is assessed using the profiles of tangential velocity,
 $u_{t}$
, along the shear layer normal direction,
 $n$
(figure 3). The tangential velocity profiles are normalized by their peak value,
 $u_{t,max}$
, which is attained at around
 $n=9\unicode[STIX]{x1D702}$
(figure 3
a). The peak location can be taken as a measure of the thickness of the core of the shear layer, which collapses using the Kolmogorov length scale. The tangential velocity decreases slowly for larger distances from the origin, and reduces to near zero velocity at
 $n=2.2L$
for
 $Re_{\unicode[STIX]{x1D706}}>110$
(figure 3
c). The long tail is evidence for the presence of large-scale coherence, i.e. integral-scale motions, adjacent to the shear layer.
The fact that both
 $\unicode[STIX]{x1D702}$
and
 $L$
scaling is observed in the tangential velocity profiles is fully consistent with the results of Wei et al. (Reference Wei, Elsinga, Brethouwer, Schlatter and Johansson2014) for wall-bounded turbulence. They also found the peak tangential velocity at
 $n=9\unicode[STIX]{x1D702}$
and a tail length that scaled on the boundary layer thickness or channel height, which is a macroscopic length scale.
The present tangential velocity profiles cross near
 $n=1.5\unicode[STIX]{x1D706}_{T}$
(figure 3
b), which marks the transition from the sharp peak to the long tail in the tangential velocity profile. This result is qualitatively similar to results for wall-bounded turbulence (Wei et al.
Reference Wei, Elsinga, Brethouwer, Schlatter and Johansson2014), where this crossing is closer to
 $1\unicode[STIX]{x1D706}_{T}$
. The quantitative difference may be associated with the non-trivial task of defining a Taylor length scale in wall-bounded flow, since the Taylor length evaluated in the streamwise, spanwise or wall-normal directions (or a combination) yield different values. Furthermore, the velocity at the cross-over (at
 $n=1.5\unicode[STIX]{x1D706}_{T}$
) appears constant at approximately 45 % of the peak tangential velocity (figure 3
b). This velocity magnitude is consistent with the cross-over velocity in wall-bounded turbulence (at
 $n=1\unicode[STIX]{x1D706}_{T}$
, Wei et al.
Reference Wei, Elsinga, Brethouwer, Schlatter and Johansson2014).
Tangential velocity profiles along the
 $n$
axis, which is the direction normal to the shear layer (figure 1
a). The distance to the shear layer centre (i.e. origin) is normalized by the Kolmogorov length scale (a), Taylor length scale (b) and the integral length scale (c). The legend is shown on (d).

It is of interest to consider the Reynolds number scaling of the peak tangential velocity,
 $u_{t,max}$
, which was used for normalization of the velocity profiles in figure 3. Figure 4 presents
 $u_{t,max}$
versus the Reynolds number, where the velocity is normalized by the Kolmogorov velocity scale,
 $u_{\unicode[STIX]{x1D702}}$
, and the r.m.s. velocity,
 $u_{rms}$
. These velocity scales are associated with the small- and large-scale motions respectively. From the plot it is clear that the peak tangential velocity is constant with Reynolds number when scaled with the Kolmogorov velocity scale. This is somewhat different from the earlier analysis of wall-bounded turbulence (Wei et al.
Reference Wei, Elsinga, Brethouwer, Schlatter and Johansson2014), which showed a weak dependence on the small-scale velocity, i.e. the friction velocity. The tangential velocity normalized by the friction velocity changed by just 5 % over the Reynolds number range considered by Wei et al. (Reference Wei, Elsinga, Brethouwer, Schlatter and Johansson2014). The slight difference in scaling behaviour may be due to the flow (wall-bounded versus homogeneous isotropic turbulence) or a low Reynolds number effect in the wall-bounded flow cases. However, the magnitude of the peak tangential velocity is comparable when normalized by the Kolmogorov velocity scale; 2.5–2.6 in the case of wall-bounded turbulence (Wei et al.
Reference Wei, Elsinga, Brethouwer, Schlatter and Johansson2014) while it is 2.7–2.8 in case of homogeneous isotropic turbulence (figure 4). The peak velocity normalized by
 $u_{rms}$
shows a
 $Re_{\unicode[STIX]{x1D706}}^{-0.5}$
scaling, which is consistent with
 $u_{t,max}\sim u_{\unicode[STIX]{x1D702}}$
since
 $u_{rms}/u_{\unicode[STIX]{x1D702}}\sim Re^{0.25}\sim Re_{\unicode[STIX]{x1D706}}^{0.5}$
.
Reynolds number scaling of the peak tangential velocity along the
 $n$
axis (figure 3). The lines show the peak velocity normalized by the Kolmogorov velocity scale (red) and the r.m.s. velocity (blue). Trend lines are shown in black.

Profiles showing the velocity component in the normal direction
 $u_{n}$
along the shear layer, i.e. along the
 $t$
axis (figure 1
a). The distance to the origin is normalized by the Kolmogorov length scale (a), the Taylor length scale (b) and the integral length scale (c). The legend is the same as that shown in figure 3(d).

Profiles of the normal velocity component,
 $u_{n}$
, along the shear layer are presented in figure 5. Similar plots were used in Wei et al. (Reference Wei, Elsinga, Brethouwer, Schlatter and Johansson2014) to infer the distance between the vortices within the shear layer. In their case the core of the vortex was taken as the zero crossing of the velocity profile, where
 $u_{n}$
changed sign. The present profiles reveal a zero crossing near
 $t=18{-}25\unicode[STIX]{x1D702}$
only at low Reynolds numbers, that is, for
 $Re_{\unicode[STIX]{x1D706}}\leqslant 177$
(figure 5
a). At higher Reynolds number the profiles just show a local minimum near
 $t=35\unicode[STIX]{x1D702}$
, but
 $u_{n}$
does not change sign. Consequently, the local streamlines do not spiral around a vortex core for
 $Re_{\unicode[STIX]{x1D706}}\geqslant 257$
, in contrast to the lower Reynolds number results (Elsinga & Marusic Reference Elsinga and Marusic2010; Wei et al.
Reference Wei, Elsinga, Brethouwer, Schlatter and Johansson2014). However, the strong drop in
 $u_{n}$
around
 $t=15\unicode[STIX]{x1D702}$
is associated with intense swirling strength at all Reynolds numbers, which is indicative of vortical motion (see § 3.3). The present results suggest that with increasing
 $Re_{\unicode[STIX]{x1D706}}$
the swirling motion weakens relative to the larger-scale straining motion, which causes the zero crossing to disappear. Besides the primary peak at
 $t=7\unicode[STIX]{x1D702}$
, there appears a secondary maximum in the profiles between
 $t=70\unicode[STIX]{x1D702}$
and
 $120\unicode[STIX]{x1D702}$
(
 $t=1.5\unicode[STIX]{x1D706}_{T}$
and
 $3\unicode[STIX]{x1D706}_{T}$
). Neither the Kolmogorov, the Taylor, nor the integral length scale can collapse the location of this secondary peak (figure 5), which suggests a mixed scaling with contributions from both large and small scales. Nevertheless, at the integral scale, the tail of the profiles is characterized by low velocity magnitude and
 $u_{n}<0$
(figure 5
c). Furthermore, the peak normal velocity,
 $u_{n,max}$
scales with the Kolmogorov velocity scale (not shown), similar to
 $u_{t,max}$
before.
Profiles showing the velocity component in the direction of the intermediate principal straining,
 $u_{s}$
, along the corresponding
 $s$
axis (figure 1
a). The distance to the origin is normalized by the Kolmogorov length scale (a), the Taylor length scale (b) and the integral length scale (c). The legend is the same as that shown in figure 3(d).

Reynolds number scaling of the peak
 $u_{s}$
velocity component along the
 $s$
axis (figure 6). The lines show the peak velocity normalized by the Kolmogorov velocity scale (red) and the r.m.s. velocity (blue). Trend lines are shown in black.

Vorticity within the shear layer is oriented in the direction of the intermediate principal strain rate, which coincides with the
 $s$
axis as defined in figure 1(a). The corresponding velocity profile is presented in figure 6. Vorticity stretching is evident from the fact that the strain in the
 $s$
direction is positive, i.e.
 $\unicode[STIX]{x2202}u_{s}/\unicode[STIX]{x2202}s>0$
near the origin. For
 $Re_{\unicode[STIX]{x1D706}}>200$
the slopes of the velocity profiles collapse near the origin when scaled with the Kolmogorov length scale (figure 6
a). However, the velocity peak location continuously increases with Reynolds number in Kolmogorov scaling. In Taylor scaling, the peak locations are scattered around
 $s=2\unicode[STIX]{x1D706}_{T}$
(
 $Re_{\unicode[STIX]{x1D706}}>200$
, figure 6
b), which suggests the fluid motions involved in vorticity stretching scale with the Taylor length scale. The peaks are broad (
 ${\sim}1\unicode[STIX]{x1D706}_{T}$
based on the points where the velocity reaches 99 % of the peak velocity) resulting in a relatively large uncertainty on the exact peak location, which explains the observed scatter in figure 6(b). The peak velocity,
 $u_{s,max}$
, reveals a Kolmogorov velocity scaling only for
 $Re_{\unicode[STIX]{x1D706}}>200$
(figure 7).
In summary, the velocity peaks along the tangential and normal directions scale with the Kolmogorov length and velocity scale, as expected for the intense dissipative straining motions at the centre of the shear layer. However, the velocity peak in the intermediate straining direction scales with the Taylor length scale (figure 6) and the Kolmogorov velocity scale (at large Reynolds numbers, figure 7). Therefore, the scaling of the straining motions is slightly more complex compared to a basic Kolmogorov scaling. Furthermore, the straining motions reveal coherence up to integral scales.
3.2 Dissipation
The average shear layer reveals a sheet-like intense dissipation
 $\unicode[STIX]{x1D700}$
, which is symmetric around the centre of the shear layer structure (
 $\unicode[STIX]{x1D700}(\unicode[STIX]{x1D743})=\unicode[STIX]{x1D700}(-\unicode[STIX]{x1D743})$
) (figure 1). Note that the dissipation is computed based on the averaged velocity field. The scaling of the dissipation sheet is investigated using normalized dissipation profiles along the same directions as before. Dissipation returns to zero at approximately
 $10\unicode[STIX]{x1D702}$
along the shear layer normal direction (figure 8
a), which is a measure for the thickness of the dissipation sheet. The total thickness is
 $20\unicode[STIX]{x1D702}$
due to symmetry. In the other two directions (figure 8
b,c), dissipation drops to near zero at
 $\pm 30\unicode[STIX]{x1D702}$
, which implies a total length of
 $60\unicode[STIX]{x1D702}$
. Only the lowest Reynolds number (
 $Re_{\unicode[STIX]{x1D706}}=34.6$
) deviates indicating slightly smaller structure size. These results represent a first statistical scaling analysis of dissipation sheet dimensions. They are however consistent with the largest length scale of the instantaneous dissipation sheets observed in a jet at
 $Re_{\unicode[STIX]{x1D706}}=150$
(Ganapathisubramani et al.
Reference Ganapathisubramani, Lakshminarasimhan and Clemens2008). Overall, the profiles collapse when scaled with the Kolmogorov length scale (
 $Re_{\unicode[STIX]{x1D706}}\geqslant 66.1$
, figure 8), which means the dissipation sheet is a small-scale structure, as expected.
Profiles of dissipation along the
 $n$
(a),
 $t$
(b) and
 $s$
axes (c). Dissipation is normalized by its peak value. The profiles for different Reynolds numbers collapse when scaled with the Kolmogorov length scale. The legend is the same as that shown in figure 3(d).

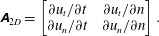
The flow topology associated with the peak dissipation is assessed by decomposing the total shearing at the origin into a contribution from a saddle point topology and a pure layered shear topology (see also Elsinga & Marusic Reference Elsinga and Marusic2010). The decomposition is based on the reduced velocity gradient tensor
 $\unicode[STIX]{x1D63C}_{2D}$
in the (
 $n,t$
) plane, which takes the form:
 $$\begin{eqnarray}\unicode[STIX]{x1D63C}_{2D}=\left[\begin{array}{@{}cc@{}}\unicode[STIX]{x2202}u_{t}/\unicode[STIX]{x2202}t\quad & \unicode[STIX]{x2202}u_{t}/\unicode[STIX]{x2202}n\\ \unicode[STIX]{x2202}u_{n}/\unicode[STIX]{x2202}t\quad & \unicode[STIX]{x2202}u_{n}/\unicode[STIX]{x2202}n\end{array}\right].\end{eqnarray}$$
The total shearing is defined as
 $\unicode[STIX]{x1D70F}_{tot}=(\unicode[STIX]{x2202}u_{t}/\unicode[STIX]{x2202}n+\unicode[STIX]{x2202}u_{n}/\unicode[STIX]{x2202}t)$
, which is the sum of the off-diagonal elements in the reduced strain-rate tensor. Note that
 $\unicode[STIX]{x2202}u_{t}/\unicode[STIX]{x2202}n>\unicode[STIX]{x2202}u_{n}/\unicode[STIX]{x2202}t>0$
in consequence of the chosen coordinate system (figure 1
a). Then, the total shearing is decomposed into a symmetrical component,
 $\unicode[STIX]{x1D70F}_{sym}=2\unicode[STIX]{x2202}u_{n}/\unicode[STIX]{x2202}t$
, and an asymmetrical component
 $\unicode[STIX]{x1D70F}_{asym}=(\unicode[STIX]{x2202}u_{t}/\unicode[STIX]{x2202}n-\unicode[STIX]{x2202}u_{n}/\unicode[STIX]{x2202}t)$
, which is equal to the vorticity. When normalized by the total shearing, these terms correspond to a relative contribution from a pure strain and a layered shear respectively. The results of this analysis are presented in table 2. Most of the total shearing is associated with a shear layer topology (
 ${\sim}75\,\%$
) independent of the Reynolds number, which suggests a link between the vorticity within the shear layer and the core dissipation region. This issue will be further discussed below.
Profiles of the vorticity component in the direction of the intermediate principal strain,
 $\unicode[STIX]{x1D714}_{2}$
, taken along the
 $n$
(a),
 $t$
(b) and
 $s$
axes (c). The profiles for different Reynolds numbers collapse when scaled with the Kolmogorov length scale. The legend is shown in figure 3(d).

The total shearing,
 $\unicode[STIX]{x1D70F}_{tot}$
, at the origin of the strain eigenframe decomposed into a pure strain,
 $\unicode[STIX]{x1D70F}_{sym}$
, and a layered shear contribution,
 $\unicode[STIX]{x1D70F}_{asym}$
.

3.3 Vorticity and swirl
Profiles of the vorticity component in the direction of the intermediate principal strain,
 $\unicode[STIX]{x1D714}_{2}$
, are shown in figure 9, and reveal a clear collapse in Kolmogorov units. Vorticity changes sign at
 $n=6\unicode[STIX]{x1D702}$
, which means the thickness of the vorticity layer is
 $12\unicode[STIX]{x1D702}$
due to symmetry. A minimum in
 $\unicode[STIX]{x1D714}_{2}$
is found at
 $n=13\unicode[STIX]{x1D702}$
. Along the shear layer, i.e. the
 $t$
axis, the
 $\unicode[STIX]{x1D714}_{2}$
maximum is not at the origin, but is located at
 $t=6\unicode[STIX]{x1D702}$
. Thus the peak dissipation and the peak vorticity do not coincide, which is consistent with actual turbulence (e.g. Vincent & Meneguzzi Reference Vincent and Meneguzzi1994; Ganapathisubramani et al.
Reference Ganapathisubramani, Lakshminarasimhan and Clemens2008). The vorticity magnitude remains significant over larger distances along the shear layer as compared to dissipation (compare figures 8
b and 9
b). The same holds true in the direction of the intermediate principal strain (figures 8
c and 9
c). A characteristic coherence length for shear layer vorticity is
 $120\unicode[STIX]{x1D702}$
, which is based on the vorticity magnitude reducing to approximately 5 % of its peak value at
 $60\unicode[STIX]{x1D702}$
distance from the origin in all directions (figure 9) and including symmetry. Similar to the dissipation profiles analysed before, the vorticity profiles at
 $Re_{\unicode[STIX]{x1D706}}=34.6$
deviate slightly, which is ascribed to insufficient scale separation at low Reynolds number.
The vorticity coherence length along the shear layer, i.e.
 $120\unicode[STIX]{x1D702}$
, is considerable larger than the commonly reported width of vorticity structures, which varies around 10–
 $20\unicode[STIX]{x1D702}$
. The reason for the disparity is the azimuthal averaging, which was used when determining the vortex core sizes (e.g. Jimenez et al.
Reference Jimenez, Wray, Saffman and Rogallo1993), the vorticity auto-correlation map (Fiscaletti, Westerweel & Elsinga Reference Fiscaletti, Westerweel and Elsinga2014) or the conditionally averaged vorticity field (Mui, Dommermuth & Novikov Reference Mui, Dommermuth and Novikov1996). The vorticity vector defines only a single direction and a perpendicular plane. The two remaining spatial directions within the perpendicular plane are usually arbitrarily defined leading to the azimuthal averaging in that plane, which smears out any shear layer contribution. This effect is illustrated in figure 10, which shows the azimuthal average of shear layer vorticity
 $\unicode[STIX]{x1D714}_{2}$
in the (
 $\unicode[STIX]{x1D709}_{1}$
,
 $\unicode[STIX]{x1D709}_{3}$
) plane, i.e. the plane perpendicular to the shear layer vorticity vector. The azimuthal averaging causes the regions of negative and positive
 $\unicode[STIX]{x1D714}_{2}$
that surround the shear layer to nearly cancel at radial distances greater than
 $20\unicode[STIX]{x1D702}$
, suggesting the full width of the vorticity structures is only
 $40\unicode[STIX]{x1D702}$
. Negative
 $\unicode[STIX]{x1D714}_{2}$
is, for instance, found along the shear layer normal direction (figure 9
a), while positive
 $\unicode[STIX]{x1D714}_{2}$
is seen along the shear layer (figure 9
b). The resulting vorticity profiles in radial direction are remarkably similar to the vorticity auto-correlation map up to a radial distance of
 $30\unicode[STIX]{x1D702}$
(figure 10). Only the radial profile for
 $Re_{\unicode[STIX]{x1D706}}=34.6$
is closer to a Gaussian vorticity distribution, which is typical of a Burgers vortex (Burgers Reference Burgers1948). Therefore, the strain eigenframe is essential in uncovering the nature and the characteristic size of vorticity structures, because it can account for the layer structure and properly defines two directions perpendicular to the vorticity vector.
Radial profile of vorticity, which is obtained by the azimuthal averaging of
 $\unicode[STIX]{x1D714}_{2}$
in the (
 $\unicode[STIX]{x1D709}_{1}$
,
 $\unicode[STIX]{x1D709}_{3}$
) plane. Compared to the profiles in the strain eigenframe (figure 9) vorticity remains coherent over much smaller length scales in the radial profiles. The 10 % threshold is reached at
 $15\unicode[STIX]{x1D702}$
(compared to
 $60\unicode[STIX]{x1D702}$
in figure 9
b). The blue symbols (
 $+$
) show a Gaussian distribution with a
 $7\unicode[STIX]{x1D702}$
radius, while the red symbols (o) show the radial profile from the auto-correlation map of vorticity (data from Fiscaletti et al.
Reference Fiscaletti, Westerweel and Elsinga2014).

To isolate vortical motion within the shear layer, we consider the swirling strength as introduced by Zhou et al. (Reference Zhou, Adrian, Balachandar and Kendall1999). The swirling strength is based on an evaluation of the local velocity gradient tensor. If the velocity gradient tensor has a complex eigenvalue pair, the local streamlines describe a spiralling/swirling motion. Then the swirling strength is defined as the absolute value of the imaginary part of the complex eigenvalue pair. In physical terms it represents the angular velocity associated with the swirling motion. In case the velocity gradient tensor has only real eigenvalues, the swirling strength is zero.
Swirling strength is most intense within the shear layer (figure 1) and peaks at
 $t=11\unicode[STIX]{x1D702}$
(figure 11
b). Hence, the corresponding distance between the two vortices inside the shear layer is
 $22\unicode[STIX]{x1D702}$
when based on the swirl peak (see also figure 1
a). The present Kolmogorov scaling is different from the Taylor length scaling suggested before when using low Reynolds number data, in which
 $22\unicode[STIX]{x1D702}$
is of the order of the Taylor length scale (Elsinga & Marusic Reference Elsinga and Marusic2010; Wei et al.
Reference Wei, Elsinga, Brethouwer, Schlatter and Johansson2014). The skewed distribution of swirling strength along
 $t$
is likely due to some variability in the position of the vortex cores relative to the origin of the strain eigenframe. With respect to the swirling strength peak at
 $t=11\unicode[STIX]{x1D702}$
, new
 $n_{p}$
and
 $s_{p}$
axes are defined (figure 1
a). The profile of swirling strength along
 $n_{p}$
provides the outer diameter of the vortices, which is
 $18\unicode[STIX]{x1D702}$
(figure 11
a). The vortex core diameter may be defined at the 50 % peak swirling strength cutoff, which is analogue to the Burgers vortex core being defined by the
 $1/e$
radius of its Gaussian vorticity distribution. By this measure the present core diameter is
 $11\unicode[STIX]{x1D702}$
, which is close to the commonly reported values for vortex core diameters (6–
 $10\unicode[STIX]{x1D702}$
, Jimenez et al.
Reference Jimenez, Wray, Saffman and Rogallo1993; Ganapathisubramani et al.
Reference Ganapathisubramani, Lakshminarasimhan and Clemens2008; Ishihara et al.
Reference Ishihara, Gotoh and Kaneda2009). The
 $s_{p}$
axis coincides with the vortex axis, therefore the swirling strength profile in that direction (figure 11
c) is used to measure the length of the vortex. Based on the zero crossings of the profiles for
 $Re_{\unicode[STIX]{x1D706}}\geqslant 433$
, the vortex length is determined at
 $90\unicode[STIX]{x1D702}$
. At lower Reynolds numbers (
 $66.1\leqslant Re_{\unicode[STIX]{x1D706}}\leqslant 257$
) the swirling length profiles reveal longer tails in the
 $s_{p}$
direction, but the normalized swirling strength in these tails is quite low (
 ${<}10\,\%$
, figure 11
c). Therefore,
 $90\unicode[STIX]{x1D702}$
is considered to be the relevant scale for the vortex length also at lower Reynolds number. This length scale should be interpreted as a coherence length along the vortex axis, because the present averaging process tends to smear out vortical motion that is misaligned with the mean vortex axis. However, the
 $90\unicode[STIX]{x1D702}$
coherence length compares well with the 60–
 $100\unicode[STIX]{x1D702}$
characteristic vortex length in visualizations of a jet at
 $Re_{\unicode[STIX]{x1D706}}=150$
and of high Reynolds number isotropic turbulence (Ishihara et al.
Reference Ishihara, Kaneda, Yokokawa, Itakura and Uno2007; Ganapathisubramani et al.
Reference Ganapathisubramani, Lakshminarasimhan and Clemens2008). Moreover, the present findings are consistent with Kaneda & Morishita (Reference Kaneda, Morishita, Davidson, Kaneda and Sreenivasan2013), who note that the Reynolds number dependence of the radius of curvature of vorticity lines is similar to that of
 $\unicode[STIX]{x1D702}$
, rather than that of
 $\unicode[STIX]{x1D706}_{T}$
.
Both the vorticity and the swirling strength profiles collapse in Kolmogorov length scaling, meaning they are associated with small scales as expected. The present results and the similarity in the visualizations of vortices across Reynolds numbers (Ishihara et al. Reference Ishihara, Kaneda, Yokokawa, Itakura and Uno2007; Ganapathisubramani et al. Reference Ganapathisubramani, Lakshminarasimhan and Clemens2008) suggest that the vortex length is proportional to the Kolmogorov length scale, as opposed to the Taylor length scale (Yamamoto & Hosokawa Reference Yamamoto and Hosokawa1988) or the integral length scale (Jimenez et al. Reference Jimenez, Wray, Saffman and Rogallo1993; Vincent & Meneguzzi Reference Vincent and Meneguzzi1994), which were suggested in the past based on observations in low Reynolds number turbulence.
Profiles of swirling strength along the
 $n_{p}$
(a),
 $t$
(b) and
 $s_{p}$
axes (c). Note that the
 $n_{p}$
and
 $s_{p}$
axes were defined relative to the swirl peak location long the
 $t$
axis (see figure 1
a). The profiles for different Reynolds numbers collapse when scaled with the Kolmogorov length scale. The legend is the same as that shown in figure 3(d).

3.4 Local and non-local velocity fields
Further information on the environment of the shear layer is obtained by decomposing the flow into two parts: (i) the velocity induced by shear layer vorticity and (ii) the so-called non-local part. The non-local part is of particular interest and can be interpreted as the shear layer environment. A similar procedure was used before by Hamlington et al. (Reference Hamlington, Schumacher and Dahm2008) in order to define a local and a non-local strain (see also § 4). Here, we take the average velocity field in the strain eigenframe and consider its shear layer vorticity component,
 $\unicode[STIX]{x1D714}_{2}$
, which induces a flow field according to the Biot–Savart relation:
 $$\begin{eqnarray}\left.\begin{array}{@{}c@{}}\displaystyle u_{1}(\unicode[STIX]{x1D743})=\frac{1}{4\unicode[STIX]{x03C0}}\int _{\unicode[STIX]{x1D743}^{\prime }}\unicode[STIX]{x1D714}_{2}(\unicode[STIX]{x1D743}^{\prime })\frac{\unicode[STIX]{x1D709}_{3}-\unicode[STIX]{x1D709}_{3}^{\prime }}{|\unicode[STIX]{x1D743}-\unicode[STIX]{x1D743}^{\prime }|^{3}}\,\text{d}^{3}\unicode[STIX]{x1D743}^{\prime },\\ u_{2}(\unicode[STIX]{x1D743})=0,\\ \displaystyle u_{3}(\unicode[STIX]{x1D743})=\frac{-1}{4\unicode[STIX]{x03C0}}\int _{\unicode[STIX]{x1D743}^{\prime }}\unicode[STIX]{x1D714}_{2}(\unicode[STIX]{x1D743}^{\prime })\frac{\unicode[STIX]{x1D709}_{1}-\unicode[STIX]{x1D709}_{1}^{\prime }}{|\unicode[STIX]{x1D743}-\unicode[STIX]{x1D743}^{\prime }|^{3}}\,\text{d}^{3}\unicode[STIX]{x1D743}^{\prime }.\end{array}\right\}\end{eqnarray}$$
The integral is evaluated considering all points
 $\unicode[STIX]{x1D743}^{\prime }$
where the vorticity magnitude is above a specified threshold. Presently this threshold is set at 5 % of the peak vorticity magnitude. The resulting integration volume corresponds to the ‘intense’ vorticity region associated with the shear layer, which scales with the Kolmogorov length scale and extends up to approximately
 $60\unicode[STIX]{x1D702}$
distance from the origin in all directions (figure 9). As such, the integration volume is a small scale. The flow computed by (3.2) thus corresponds to the velocity field induced by the shear layer vorticity,
 $\unicode[STIX]{x1D714}_{2}$
, inside the (small-scale) intense vorticity region. Subtracting the induced velocity from the original flow field in the strain eigenframe yields the non-local flow field.
The induced tangential velocity along the shear layer normal direction,
 $n$
, is presented in figure 12. For
 $Re_{\unicode[STIX]{x1D706}}>66.1$
, the induced velocity profiles collapse when normalizing
 $n$
by the Kolmogorov length scale,
 $\unicode[STIX]{x1D702}$
, which is expected since the vorticity field, on which it is based, scales with
 $\unicode[STIX]{x1D702}$
(figure 9). Further note that the velocity normalization is by the peak tangential velocity
 $u_{t,max}$
of the total flow field in the eigenframe (as in figure 3). Therefore, the induced velocity in figure 12 can be directly compared to the result in figure 3 in order to establish the relative contribution of the induced flow to the total flow. It is observed that the induced flow accounts for
 ${\sim}70\,\%$
of the peak tangential velocity (figure 12). Consequently, the remaining 30 % is associated with the non-local strain, which is significant. The respective local and non-local contributions appear consistent with the results in table 2, which shows that 75 % of the shearing at the origin is associated with vorticity (local), while the remaining 25 % is due to pure strain (i.e. saddle topology) and does not contain vorticity (non-local).
The non-local tangential velocity profile is obtained by subtracting the induced velocity from the total velocity. It shows a plateau-like region, which extends up to
 $n=3\unicode[STIX]{x1D706}_{T}$
for
 $Re_{\unicode[STIX]{x1D706}}\geqslant 257$
(figure 13), where the non-local tangential velocity is around 40 % of the peak total tangential velocity,
 $u_{t,max}$
. Beyond
 $n=3\unicode[STIX]{x1D706}_{T}$
the non-local velocity gradually decreases in magnitude. At integral scale, the non-local velocity converges to the total velocity (figure 3
c), because the induced velocity diminishes at large distances from the shear layer (figure 12). Furthermore, small peaks in non-local velocity are observed in the plateau region near
 $n=60\unicode[STIX]{x1D702}$
, which correspond to a local dip in the induced velocity at the same location (figure 12). They are due to the finite size of the integration volume in the computation of the induced velocity (3.2). Therefore, we do not consider these small peaks significant. In the direction of the intermediate principal strain,
 $\unicode[STIX]{x1D709}_{2}$
, which coincides with the
 $s$
axis, the shear layer vorticity does not induce any flow (3.2). Hence, the
 $u_{s}$
velocity profile (figure 6) represents the total as well as the non-local flow. These profiles reveal a peak at
 $s=2\unicode[STIX]{x1D706}_{T}$
. Therefore, both non-local velocity profiles (figures 6 and 13) identify the Taylor length,
 $\unicode[STIX]{x1D706}_{T}$
, as the relevant length scale for the non-local flow. The non-local flow is interpreted as the environment of the shear layer, and contains the motions that stretch vorticity (along the
 $s$
axis).
Shear layer vorticity-induced tangential velocity profiles in the direction normal to the shear layer. The induced tangential velocity is normalized by the same peak tangential velocity
 $u_{t,max}$
used in figure 3. This allows a direct comparison of the induced flow with the profiles obtained from the total flow field in the strain eigenframe (figure 3). The legend is the same as that shown in figure 3(d).

Non-local tangential velocity profiles in the direction normal to the shear layer, which results from subtracting the shear layer vorticity-induced profile (figure 12) from the total tangential velocity profile (figure 3). Note that figures 3, 12 and the present figure use the same normalization of the tangential velocity. The legend is the same as that shown in figure 3(d).

3.5 Small-scale coherence length and Reynolds number transitions
The vortices and intense dissipation within the present shear layer (figure 2) are independent of the Reynolds number in the sense that both their size and relative positions collapse when scaled with the Kolmogorov length scale (§§ 3.2–3.3). Of course, the instantaneous flow will show a certain variety of small-scale structures, both in sizes and in shapes, but the averaging process in the strain eigenframe identifies the shear layer as statistically relevant. Nevertheless, a comparison with actual turbulence has revealed that the average shear layer structure captures some relevant properties of the underlying turbulent flow, such as; the tube-like shape of the vortices, the sheet-like shape of the dissipation, the fact that intense dissipation is located in between the intense vortices, the alignment of vorticity with the intermediate principal strain, the teardrop shape of the joint-p.d.f. of the invariants of the velocity gradient tensor, and the
 $k^{-5/3}$
range in the energy spectrum (Elsinga & Marusic Reference Elsinga and Marusic2010, Reference Elsinga and Marusic2016). Therefore, the present average shear layer structure (including the small scales contained within) is considered as a representative, or a characteristic, turbulent flow structure.
The small-scale structure within the average shear layer has a characteristic size of
 ${\sim}120\unicode[STIX]{x1D702}$
, which is inferred from the shear layer vorticity profiles approaching zero at
 $\pm 60\unicode[STIX]{x1D702}$
in all directions (figure 9). At that distance from the origin the vorticity magnitude has reduced to approximately 5 % of its peak value. Shear layer vorticity thus remains coherent over that length scale, even if it changes sign in the profile along the
 $n$
axis (figure 9
a). Note that some features contained within the layer, such as the vortex cores, can be considerably smaller (§ 3.3). However, due to the spatial organization of the vortices and dissipation structures, the small scales in the turbulent flow remain coherent up to
 ${\sim}120\unicode[STIX]{x1D702}$
. This length scale can be compared with other relevant length scales in the flow, which allows identifying Reynolds number transitions in flow structure.
At very low Reynolds numbers the largest length scale in the flow is comparable to
 $120\unicode[STIX]{x1D702}$
. In this case, the largest flow scale can be defined as the distance between the points where the tangential velocity returns to zero, which is at
 $\pm 2.2L$
(figure 3
c). The condition
 $4.4L>120\unicode[STIX]{x1D702}$
is reached for
 $Re_{\unicode[STIX]{x1D706}}>45$
(table 1). But even at
 $Re_{\unicode[STIX]{x1D706}}=110$
, the characteristic small-scale structure and the large scales are poorly separated, and possibly indistinguishable. For example, the kink in the tangential velocity profile at
 $n=1\unicode[STIX]{x1D706}_{T}-2\unicode[STIX]{x1D706}_{T}$
(figure 3
b), which separates the peak from the tail, is not very pronounced at this Reynolds number. Based on these considerations, a transition in Reynolds number regime may be defined at the point where
 $L$
is of order
 $27\unicode[STIX]{x1D702}$
(
 $Re_{\unicode[STIX]{x1D706}}\approx 45$
). Below this Reynolds number developed turbulence cannot exist, since the so-called large scales are smaller in size than the characteristic small-scale structure. Indeed, the present results show that the small-scale structures of dissipation and vorticity are affected at the lowest Reynolds number,
 $Re_{\unicode[STIX]{x1D706}}=34.6$
. In particular, they are smaller (§§ 3.2 and 3.3) suggesting they are not fully developed.
A second transition in Reynolds number regime is linked to the Taylor length scale,
 $\unicode[STIX]{x1D706}_{T}$
. In particular,
 $4\unicode[STIX]{x1D706}_{T}$
represents a characteristic scale for the stretching motions acting in the direction of the small-scale vorticity. This is inferred from the distance between the peaks in the stretching velocity component
 $u_{s}$
, which are located at
 $s=\pm 2\unicode[STIX]{x1D706}_{T}$
(figure 6). Moreover, this length scale is associated with the crossing of the tangential velocity profiles (figure 3
b) and the non-local flow (§ 3.4). Only beyond
 $Re_{\unicode[STIX]{x1D706}}=250$
is
 $120\unicode[STIX]{x1D702}<4\unicode[STIX]{x1D706}_{T}$
, and a clearer separation between both scales is achieved at
 $Re_{\unicode[STIX]{x1D706}}\approx 1000$
(table 1). This suggests the possibility of a different flow structure regime. A transition effect at this Reynolds number is evident in the scaling of
 $u_{s,max}$
, which is the velocity component associated with vorticity stretching (figure 7). It scales with the Kolmogorov velocity scale only when
 $Re_{\unicode[STIX]{x1D706}}>200$
. Furthermore, the zero crossing of the normal velocity profiles near
 $t=18{-}25\unicode[STIX]{x1D702}$
(figure 5) disappears for
 $Re_{\unicode[STIX]{x1D706}}\geqslant 257$
, which is associated with a changing balance between the strength of the local swirling motions and the larger-scale straining motion (§ 3.1). Furthermore, the plateau-like region in the non-local tangential velocity profile extends up to
 $n=3\unicode[STIX]{x1D706}_{T}$
for
 $Re_{\unicode[STIX]{x1D706}}\geqslant 257$
(§ 3.4). The mentioned transition effects are related to the development of straining motions, which are associated with the Taylor length scale.
It is of interest to note that the transition at
 $Re_{\unicode[STIX]{x1D706}}\approx 250$
appears to coincide with the development of a genuine inertial range in the kinetic energy spectra. Compensated energy spectra reveal a true power scaling, close to
 $k^{-5/3}$
, over a range of wavenumbers, which initially is very narrow at
 $Re_{\unicode[STIX]{x1D706}}=200$
, but expands with increasing Reynolds number (Yeung & Zhou Reference Yeung and Zhou1997; Kaneda et al.
Reference Kaneda, Ishihara, Yokokawa, Itakura and Uno2003; Ishihara et al.
Reference Ishihara, Gotoh and Kaneda2009).
The transitions in Reynolds number regime at
 $Re_{\unicode[STIX]{x1D706}}\approx 45$
and
 $Re_{\unicode[STIX]{x1D706}}\approx 250$
are gradual though, as is evident from the velocity profiles in § 3.1. Therefore, it is difficult to define sharp bounds for the regimes other than by the considerations given above. The above bounds for the Reynolds number regimes were determined by equating the
 $120\unicode[STIX]{x1D702}$
size of the characteristic small-scale structure to the characteristic size of the straining motions (
 $4\unicode[STIX]{x1D706}_{T}$
) and the largest flow scale (
 $4.4L$
). One may argue that a proper scale separation is achieved only when
 $4\unicode[STIX]{x1D706}_{T}$
correspond to some multiple of
 $120\unicode[STIX]{x1D702}$
. For example, a
 $4\unicode[STIX]{x1D706}_{T}$
sized straining motion can contain multiple characteristic small-scale structures, when
 $4\unicode[STIX]{x1D706}_{T}>2\times 120\unicode[STIX]{x1D702}$
, i.e.
 $\unicode[STIX]{x1D706}_{T}>60\unicode[STIX]{x1D702}$
. This is achieved between
 $Re_{\unicode[STIX]{x1D706}}=732$
and 1131 (table 1), see also § 3.6.
3.6 Comparison with the high Reynolds number instantaneous shear layer
Shear layers have also been observed in the instantaneous turbulent flow, as mentioned in the introduction. It is, therefore, of interest to compare the present results for the average shear layer in the strain eigenframe with the instantaneous flow and conceptualize the results. The comparison is focused on the significant shear layer observed in high Reynolds number turbulence (
 $Re_{\unicode[STIX]{x1D706}}=1131$
) by Ishihara et al. (Reference Ishihara, Kaneda and Hunt2013), because it is far from the Reynolds number transitions as identified in § 3.5 and there exists a clear scale separation. Moreover, these conditions approach environmental and industrial flows.
The vortical structures in the instantaneous layer were
 ${\sim}10\unicode[STIX]{x1D702}$
in diameter (Ishihara et al.
Reference Ishihara, Kaneda and Hunt2013), which is consistent with the
 $11\unicode[STIX]{x1D702}$
core diameters in the average layer (§ 3.3). Furthermore, the distance between the vortices is of the same order as the core diameter and scales with the Kolmogorov length scale in both cases. At the same time, integral-scale flow regions bound the shear layers. In the instantaneous flow, the typical distance between the significant layers was of the order of the integral length scale,
 $L$
(Ishihara et al.
Reference Ishihara, Kaneda and Hunt2013). In these
 $L$
sized regions adjacent to the shear layer, the turbulence was much less intense in terms of the enstrophy and dissipation magnitude when compared to the interior of the shear layer. The average shear layer structure is also bounded by
 $L$
sized regions, in which the flow conditions are changing only gradually. These regions show in the tangential velocity profiles as long tails, which extend up to
 $\pm 2.2L$
(figure 3
c). Both the instantaneous and the average shear layer structures, therefore, contain the full range of turbulent length scales, that is, they contain Kolmogorov and integral sized motions simultaneously. Consequently, scale interactions and energy transfer are significant near these layers (Ishihara et al.
Reference Ishihara, Kaneda and Hunt2013; Hunt et al.
Reference Hunt, Ishihara, Worth and Kaneda2014; Elsinga & Marusic Reference Elsinga and Marusic2016).
The overall thickness of the instantaneous shear layer was
 ${\sim}4\unicode[STIX]{x1D706}_{T}$
(Ishihara et al.
Reference Ishihara, Kaneda and Hunt2013). Conditional averages showed elevated levels of enstrophy and dissipation over the thickness of the layer, which strongly contrasted with the quiescent outer regions. The increase was associated with the numerous intense vortices and dissipation structures clustered within the
 $4\unicode[STIX]{x1D706}_{T}$
thick layer. In the average shear layer structure,
 $4\unicode[STIX]{x1D706}_{T}$
is the length scale associated with the non-local strain, which stretches small-scale vorticity and creates the background shear in which the vortices are located (figure 6 and § 3.4). The instantaneous shear layer shows many intense vortices inside the
 $4\unicode[STIX]{x1D706}_{T}$
layer, while the average shear layer contains only two. A likely explanation for the difference is that the vortices average out in the latter case, which suggests that their relative position in the instantaneous turbulent flow is random beyond a certain distance. This distance is estimated at
 $120\unicode[STIX]{x1D702}$
, which is the coherence length of the observed characteristic small-scale structure (§ 3.5). At high Reynolds number (
 ${\sim}1000$
) multiple characteristic small-scale structures (
 ${\sim}120\unicode[STIX]{x1D702}$
) fit within a single
 $4\unicode[STIX]{x1D706}_{T}$
sized straining region. That is, a single straining region can support a number of characteristic small-scale structures by stretching their vorticity, which would explain the observations of Ishihara et al. (Reference Ishihara, Kaneda and Hunt2013). By contrast, only a single characteristic small-scale structure can fit in a
 $4\unicode[STIX]{x1D706}_{T}$
sized straining region at intermediate Reynolds number (
 ${\sim}250$
). This is schematically represented in figures 14(b) and 14(d).
Conceptual picture of the instantaneous flow structure in the low (a), intermediate (b,c) and high Reynolds number regime (d,e). At low Reynolds number the integral length scale is comparable to the
 $120\unicode[STIX]{x1D702}$
size of the characteristic small-scale structure, which consists of two intense swirling motions (green tubes) with an intense dissipation structure in between (red sheet). Consequently, the small-scale structures appear randomly distributed in space (a). At intermediate Reynolds number a
 $4\unicode[STIX]{x1D706}_{T}$
straining motion (indicated by the grey arrows) can support only a single characteristic small-scale structure of
 $120\unicode[STIX]{x1D702}$
size (b), whereas at high Reynolds number the same
 $4\unicode[STIX]{x1D706}_{T}$
straining motion can support multiple characteristic small-scale structures (d). Finally, (c,e) illustrate the arrangement of the
 $4\unicode[STIX]{x1D706}_{T}$
straining motions and the intense small-scale structures along the edges of the large-scale motions at intermediate and high Reynolds number.

Furthermore, the diagrams in figure 14 illustrate how the shear layer structures are space filling at different Reynolds numbers. At low Reynolds numbers (
 $Re_{\unicode[STIX]{x1D706}}\approx 100$
) the characteristic small-scale structure size is comparable to the integral length scale. Hence, there is effectively only one length scale. As a result, the spacing between neighbouring uncorrelated structures is of similar size as the characteristic small-scale structure itself. The structures, therefore, appear randomly distributed in space (figure 14
a). At
 $Re_{\unicode[STIX]{x1D706}}\approx 250$
the
 $4\unicode[STIX]{x1D706}_{T}$
sized straining motions have developed such that they can fully contain a characteristic small-scale structure (figure 14
b). Furthermore, the shear layer structures are bounded by the large-scale motions, which scale with
 $L$
as discussed above. In the instantaneous flow a single large-scale motion may have several
 $4\unicode[STIX]{x1D706}_{T}$
sized straining motions distributed along its edges as indicated in figure 14(c). As the Reynolds number increases further, multiple characteristic small-scale structures are contained in each
 $4\unicode[STIX]{x1D706}_{T}$
sized straining motion (figure 14
d). At the same time, the number of straining motions and small-scale structures along the edges of a large-scale motion increases also (figure 14
e). This leads to a conceptual picture of instantaneous high Reynolds number turbulence, which is consistent with the observations of large significant shear layers separated by
 $L$
sized quiescent flow regions (Ishihara et al.
Reference Ishihara, Kaneda and Hunt2013). We note that vortical and dissipation structures exist in the large-scale quiescent flow regions as well, but they are generally much weaker (Ishihara et al.
Reference Ishihara, Kaneda and Hunt2013). The intense vortical and dissipation structures, however, are predominantly located in the straining regions along the edges of the large-scale motions. The difference between the weak and the intense dissipation structures is examined more closely in § 5.
In addition to the spatial structure, we compare the velocity jump across the layers. The maximum velocity difference across the average layer is
 $0.3u_{rms}$
at
 $Re_{\unicode[STIX]{x1D706}}=1131$
, which is twice the peak tangential velocity (figure 4) due to the anti-symmetry of the average velocity field. It is clearly lower than the velocity jump across the instantaneous layer (1–
 $2u_{rms}$
, Ishihara et al.
Reference Ishihara, Kaneda and Hunt2013). The instantaneous structure is an example of a strong shear layer, while the averaging also includes weaker structures. We revisit the magnitude of the velocity jump when examining the strong average shear layers, which result from a conditioning on intense dissipation (§ 5).
The fact that the instantaneous and the average shear layer dimensions appear consistent confirms that (i) the instantaneous results are (statistically) relevant and (ii) the averaging in the strain eigenframe yields meaningful results, which capture key features of the instantaneous turbulent flow.
4 Cross-over of the extensive principal strain
The scale effects in relation to vorticity stretching are examined next. Earlier work has shown that small-scale vorticity preferentially aligns with the intermediate principal strain at small scales (Ashurst et al. Reference Ashurst, Kerstein, Kerr and Gibson1987). But when considering the larger-scale strain or the non-local strain, the same small-scale vorticity preferentially aligns with the most stretching principal straining direction (Ishihara et al. Reference Ishihara, Yamazaki, Kaneda, Kambe, Nakano and Miyauchi2001; Hamlington et al. Reference Hamlington, Schumacher and Dahm2008; Leung et al. Reference Leung, Swaminathan and Davidson2012; Fiscaletti et al. Reference Fiscaletti, Elsinga, Attili, Bisetti and Buxton2016). However, the exact scale at which the cross-over occurs is unknown. As shown below, the cross-over in alignment is also found in the present average flow structure in the strain eigenframe. Then, the cross-over scaling is assessed using the results at different Reynolds numbers.
Here we use the coarse grained spatial derivatives to evaluate strain at different scales. The coarse graining is a good approximation of the filtered velocity gradient at the scale of the grain (Ishihara et al.
Reference Ishihara, Yamazaki, Kaneda, Kambe, Nakano and Miyauchi2001). At the centre of the shear layer, i.e. the origin of the eigenframe, the coarse grain gradient at scale
 $2\unicode[STIX]{x1D6EC}$
is defined as:
 $$\begin{eqnarray}\frac{\unicode[STIX]{x2202}u_{i}}{\unicode[STIX]{x2202}\unicode[STIX]{x1D709}_{i}}^{(2\unicode[STIX]{x1D6EC})}(\unicode[STIX]{x1D709}_{i}=0)=\frac{u_{i}(\unicode[STIX]{x1D709}_{i}=\unicode[STIX]{x1D6EC})-u_{i}(\unicode[STIX]{x1D709}_{i}=-\unicode[STIX]{x1D6EC})}{2\unicode[STIX]{x1D6EC}}=\frac{u_{i}(\unicode[STIX]{x1D709}_{i}=\unicode[STIX]{x1D6EC})}{\unicode[STIX]{x1D6EC}},\end{eqnarray}$$
where the anti-symmetry of the velocity field in the eigenframe is used in the last step (
 $u_{i}(\unicode[STIX]{x1D709}_{i})=-u_{i}(-\unicode[STIX]{x1D709}_{i})$
). With (4.1) the coarse grained principal strain rates at the origin of the strain eigenframe are obtained directly from the velocity profiles
 $u_{i}(\unicode[STIX]{x1D709}_{i})$
along the principal axes, which are shown in figure 15. The indices 1, 2 and 3 refer to the most stretching, the intermediate and the most compressive principal straining directions at the smallest scale.
The small-scale vorticity vector at the origin points in the
 $\unicode[STIX]{x1D709}_{2}$
direction, which coincides with the intermediate principal straining direction at small scales. At large scales, i.e. large
 $\unicode[STIX]{x1D709}_{i}$
, the velocity component in the direction of small-scale vorticity,
 $u_{2}$
, is the largest positive velocity component (figure 15). This implies that the most extensive strain at large scales is in the
 $\unicode[STIX]{x1D709}_{2}$
direction (4.1). Hence, small-scale vorticity and the large scale most extensive straining direction align, which is consistent with the observations in turbulent flows (Ishihara et al.
Reference Ishihara, Yamazaki, Kaneda, Kambe, Nakano and Miyauchi2001; Hamlington et al.
Reference Hamlington, Schumacher and Dahm2008; Leung et al.
Reference Leung, Swaminathan and Davidson2012; Fiscaletti et al.
Reference Fiscaletti, Elsinga, Attili, Bisetti and Buxton2016). The cross-over in alignment is determined by the point where the profiles of
 $u_{1}(\unicode[STIX]{x1D709}_{1})$
and
 $u_{2}(\unicode[STIX]{x1D709}_{2})$
cross, which is indicated in figure 15 by
 $\times$
. The distance between the cross-over point and the origin is denoted as
 $l_{c}$
, whose Reynolds number scaling is investigated in figure 16. The
 $l_{c}$
normalized by the Kolmogorov and the Taylor length scales show Reynolds number dependence, which is interpreted as large and small scales affecting the cross-over point. As already mentioned, the Taylor scale is associated with the peak in the
 $u_{2}(\unicode[STIX]{x1D709}_{2})$
profile (figure 6
b where
 $u_{s}=u_{2}$
), while the Kolmogorov length scale is related to the flow induced by the shear layer vorticity (§ 3.4), which contributes to the peak in
 $u_{1}(\unicode[STIX]{x1D709}_{1})$
. Hence both scales influence the cross-over of
 $u_{1}(\unicode[STIX]{x1D709}_{1})$
and
 $u_{2}(\unicode[STIX]{x1D709}_{2})$
.
Longitudinal velocity component
 $u_{i}$
along the corresponding principal straining directions
 $\unicode[STIX]{x1D709}_{i}$
(solid lines). Near the origin (i.e. the centre of the shear layer) the velocity component in the direction of the most stretching strain,
 $u_{1}$
, is largest, while at larger distances the velocity in the intermediate principal straining direction,
 $u_{2}$
, is largest. The cross-over point is marked
 $\times$
. Dashed lines indicate the non-local strain field, in which the velocity induced by the shear layer vorticity was removed. The profiles shown are for
 $Re_{\unicode[STIX]{x1D706}}=433$
.

Reynolds number dependence of the cross-over point,
 $l_{c}$
, beyond which
 $u_{2}(\unicode[STIX]{x1D709}_{2})>u_{1}(\unicode[STIX]{x1D709}_{1})$
(see figure 15). The different lines show normalizations by the Kolmogorov (red) and Taylor length scales (blue). Trend lines are shown in black.

The plot of
 $l_{c}/\unicode[STIX]{x1D702}$
(figure 16) shows a generally increasing trend with Reynolds number. However, around
 $Re_{\unicode[STIX]{x1D706}}=200$
some oscillation is evident, which is associated with a transition in the location of the cross-over point relative to the
 $u_{2}(\unicode[STIX]{x1D709}_{2})$
maximum. At lower Reynolds numbers,
 $l_{c}>2\unicode[STIX]{x1D706}_{T}$
meaning that
 $u_{2}(\unicode[STIX]{x1D709}_{2})$
reaches a maximum at
 $2\unicode[STIX]{x1D706}_{T}$
(figure 6) before it intersects
 $u_{1}(\unicode[STIX]{x1D709}_{1})$
, while at higher Reynolds numbers
 $l_{c}<2\unicode[STIX]{x1D706}_{T}$
and
 $u_{2}(\unicode[STIX]{x1D709}_{2})$
continues to increase beyond the cross-over point. This can be linked to the Reynolds number transition that occurs when the characteristic small-scale structure of
 $120\unicode[STIX]{x1D702}$
size becomes smaller than the
 $4\unicode[STIX]{x1D706}_{T}$
length scale associated with vorticity stretching and the non-local flow field (§ 3.5).
Hamlington et al. (Reference Hamlington, Schumacher and Dahm2008) found that the alignment of vorticity with the intermediate principal strain at small scales is due to a contribution from the vorticity-induced flow to the strain rate (the so-called local constituent of the strain field), which dominates over the non-local, or background, strain. The present analysis of the flow in the strain eigenframe highlights the organization of vorticity into sheets, creating shear layers. The shear layer induces flow in the plane perpendicular to the vorticity axis, which in turn creates a strain field in that plane with strong extensive and compressive strain rates. However, there is no induced strain in the direction of vorticity, which then automatically corresponds to the direction of the intermediate principal strain rate. This provides a kinematic explanation of vorticity alignment at small scales (similar to Jimenez Reference Jimenez1992; Andreotti Reference Andreotti1997; Elsinga & Marusic Reference Elsinga and Marusic2010), in which the organization of vorticity into shear layers is especially important. At small scales a strong increase in the velocity components perpendicular to the vorticity axis, i.e.
 $u_{1}$
and
 $u_{3}$
, is observed resulting in a peak near
 $10\unicode[STIX]{x1D702}$
(figure 15), which can be attributed to the vorticity-induced flow. The vorticity-induced flow is calculated as explained in § 3.4 and subtracted from the total velocity profiles, which yields the non-local velocity profiles (dashed lines in figure 15). The non-local
 $u_{1}(\unicode[STIX]{x1D709}_{1})$
is smaller than
 $u_{2}(\unicode[STIX]{x1D709}_{2})$
at all scales, which confirms that vorticity aligns with the most stretching strain in the non-local flow field (Hamlington et al.
Reference Hamlington, Schumacher and Dahm2008).
Additionally, the velocity profiles in figure 15 are consistent with the kinetic energy spectra showing excess energy at small scales along the most stretching direction (compared to a
 $k^{-5/3}$
spectrum) and reduced small-scale energy along the intermediate principal straining direction (Elsinga & Marusic Reference Elsinga and Marusic2016). The excess energy at small scales is related to the strong peak in
 $u_{1}(\unicode[STIX]{x1D709}_{1})$
. Contrastingly, the velocity profile
 $u_{2}(\unicode[STIX]{x1D709}_{2})$
does not show a small-scale peak at all.
5 Conditioning on dissipation
So far the results presented were unconditional, in the sense that the averaging was performed including all data points. In this section, we extend the analysis by computing the average flow in the strain eigenframe considering only those points where the dissipation is within specified ranges. Dissipation,
 $\unicode[STIX]{x1D700}$
, in this case is a measure of the magnitude of the local strain, since
 $\unicode[STIX]{x1D700}=2\unicode[STIX]{x1D708}\unicode[STIX]{x1D61A}_{ij}\unicode[STIX]{x1D61A}_{ij}$
. The dissipation ranges were determined by sorting the data in order of increasing dissipation and then creating 10 dissipation bins, each containing 10 % of the total number of data points. In addition, a conditioning to
 $10\unicode[STIX]{x1D700}_{mean}<\unicode[STIX]{x1D700}<25\unicode[STIX]{x1D700}_{mean}$
,
 $25\unicode[STIX]{x1D700}_{mean}<\unicode[STIX]{x1D700}<50\unicode[STIX]{x1D700}_{mean}$
,
 $50\unicode[STIX]{x1D700}_{mean}<\unicode[STIX]{x1D700}<75\unicode[STIX]{x1D700}_{mean}$
and
 $\unicode[STIX]{x1D700}>75\unicode[STIX]{x1D700}_{mean}$
was performed, where
 $\unicode[STIX]{x1D700}_{mean}$
is the mean dissipation. These four additional dissipation bins correspond to extreme cases, which occur in only 0.40 %,
 $2.2\times 10^{-2}\,\%$
,
 $1.2\times 10^{-3}\,\%$
and
 $1.6\times 10^{-4}\,\%$
of the volume. The results from the four extreme dissipation cases are indicated by magenta coloured lines in the plots below, while the results from the other 10 ‘regular’ bins are shown in blue. Results presented in this section are for
 $Re_{\unicode[STIX]{x1D706}}=433$
unless indicated otherwise. This Reynolds number is considered representative of the higher Reynolds number cases beyond the second transition at
 $Re_{\unicode[STIX]{x1D706}}\approx 250$
(§ 3.5).
The conditional profiles of tangential velocity along the normal direction,
 $u_{t}(n)$
, are shown in figure 17(a) together with the unconditional profile for reference. With increasing dissipation a strong amplification of the peak tangential velocity is observed, as well as a shift of the peak location towards smaller
 $n$
. The changes in the peak location and the peak velocity both contribute to the increased magnitude of the velocity gradients, hence dissipation, at the origin. The origin in this case corresponds to the point of conditioning. Furthermore, the velocities at larger distances from the origin increase simultaneously. As discussed in §§ 3.1 and 3.4, the location
 $n=2\unicode[STIX]{x1D706}_{T}$
(corresponding to
 $80\unicode[STIX]{x1D702}$
at the present Reynolds number) marks the onset of the long tail in the tangential velocity profile associated with the large scales and the non-local strain. Hence, the increase in tangential velocity at
 $n=80\unicode[STIX]{x1D702}$
(figure 17
a) demonstrates that the large scales are simultaneously affected. The tangential velocity in the tail is plotted versus the peak tangential velocity in figure 18. A positive correlation is observed between these two velocities, which represent the large and the small scales, respectively. This is an important result, because it shows that the extreme dissipation is connected with strong shear at small scales and with large tangential velocity at large scales simultaneously. Extreme dissipation, therefore, is not strictly a small-scale property.
(a) Tangential velocity profiles along the
 $n$
axis conditioned on dissipation for
 $Re_{\unicode[STIX]{x1D706}}=433$
. (b) Conditional velocity profiles along the
 $s$
axis. The arrow indicates increasing dissipation. The colour coding of the solid lines is explained in the text. The dashed lines give the unconditional profiles. The normalization of the velocities is with respect to the respective peak velocity in the unconditional profiles, which is indicated by *.

Peak tangential velocity versus the tangential velocity in the tail (at
 $n=80\unicode[STIX]{x1D702}$
) of the profiles conditioned on dissipation (figure 17
a).

Furthermore, a change in the slope of figure 18 is observed. Initially, the peak tangential velocity,
 $u_{t\,max}^{\ast }$
, rises slowly with increasing dissipation, while the velocity in the tail is less responsive. However, beyond
 $u_{t\,max}^{\ast }=1.2$
the tail velocity response to the dissipation conditioning is stronger (see also figure 17
a), which changes the slope in figure 18. Therefore, it suggests that the tail tangential velocity (flow at large scales) plays a more important role when considering extreme dissipation, i.e. very intense small-scale motions.
Reynolds number scaling of the peak tangential velocity
 $u_{t}(n)$
in the average flow conditioned on extreme dissipation. The lines show the peak velocity normalized by the Kolmogorov velocity scale (red) and the r.m.s. velocity (blue). Trend lines are shown in black and grey.

Next we consider the Reynolds number scaling of the peak tangential velocity,
 $u_{t,max}$
, when conditioned on extreme dissipation. The extreme dissipation condition in this case refers to the averaging over the
 $2.3\times 10^{-2}\,\%$
data points with the most intense dissipation at each Reynolds number. For
 $Re_{\unicode[STIX]{x1D706}}=433$
, this condition corresponds to
 $\unicode[STIX]{x1D700}>25\unicode[STIX]{x1D700}_{mean}$
. The results are presented in figure 19. They reveal that neither the Kolmogorov velocity scale nor the
 $u_{rms}$
normalization is Reynolds number independent up to at least
 $Re_{\unicode[STIX]{x1D706}}=1131$
. It suggests that both velocity scales influence the peak tangential velocity, which is yet another evidence for extreme dissipation being associated with the small and large scales simultaneously. Furthermore, the Reynolds number dependence is observed to change around the second transition point identified in § 3.5 (
 $Re_{\unicode[STIX]{x1D706}}\approx 250$
), which is indicated by the different trend lines in figure 19.
Additionally, the velocity jump over the average layer conditioned on extreme dissipation can be compared to the significant instantaneous shear layer and the intense vortical structures (Ishihara et al.
Reference Ishihara, Kaneda and Hunt2013). Because of the anti-symmetry in the average velocity field, the total jump is twice the peak tangential velocity, which equals
 $1.3u_{rms}$
at
 $Re_{\unicode[STIX]{x1D706}}=1131$
(figure 19). This velocity scale is associated with the small-scale vorticity structure at the core of the average shear layer. It compares well with the velocity jump across the intense instantaneous vortical structures, which can be as large as
 $3.4u_{rms}$
(Ishihara et al.
Reference Ishihara, Kaneda and Hunt2013). The velocity difference between the large-scale motions on either side of the average shear layer is estimated from the non-local velocity field. The non-local tangential velocity is approximately 40 % of the peak tangential velocity (figures 13 and 17
a where the non-local velocity is attained at
 $n=80\unicode[STIX]{x1D702}$
), which results in a jump of
 $0.52u_{rms}$
at
 $Re_{\unicode[STIX]{x1D706}}=1131$
. This is of the same order of magnitude as the large-scale jumps over the instantaneous shear layer (1–
 $2u_{rms}$
, Ishihara et al.
Reference Ishihara, Kaneda and Hunt2013). The favourable comparison suggests that the instantaneous significant shear layer is statistically relevant to extreme dissipation, and by extension to the average dissipation.
The conditional velocity profiles along the intermediate principal strain direction,
 $u_{s}(s)$
, are shown in figure 17(b). They represent the vorticity stretching motions. As before, there is a strong amplification of the velocity with increasing dissipation. Additionally, the shape of the velocity profiles changes and develops a clear small-scale peak at very high dissipation, whereas for the unconditional and low dissipation profiles the peak is much broader and located farther from the origin (near
 $s=2\unicode[STIX]{x1D706}_{T}$
in the unconditional case, see § 3.1). It is also noted that the velocity
 $u_{s}(s)$
in the tail (
 $s>20\unicode[STIX]{x1D702}$
) initially increases with dissipation, but decreases again for the highest dissipation bin (figure 17
b).
The ratio of the average most stretching and average intermediate strain rate,
 $\unicode[STIX]{x1D70E}_{1}/\unicode[STIX]{x1D70E}_{2}$
, conditioned on dissipation.
 $\unicode[STIX]{x1D700}_{bin}$
is the average dissipation in each bin, which is normalized by the mean dissipation in the flow
 $\unicode[STIX]{x1D700}_{mean}$
.

Furthermore, the strain rate in the
 $s$
direction, corresponding to the intermediate principal strain rate
 $\unicode[STIX]{x1D70E}_{2}$
, increases much more strongly with dissipation than the other principal strain rates. This causes the ratios of the principal strain rates to change also. This can be seen in figure 20 showing the ratio of the most stretching principal strain rate,
 $\unicode[STIX]{x1D70E}_{1}$
, over the intermediate principal strain rate
 $\unicode[STIX]{x1D70E}_{2}$
. Using continuity, the remaining ratio
 $\unicode[STIX]{x1D70E}_{3}/\unicode[STIX]{x1D70E}_{2}$
can be inferred from the same plot by
 $\unicode[STIX]{x1D70E}_{3}/\unicode[STIX]{x1D70E}_{2}=-(\unicode[STIX]{x1D70E}_{1}/\unicode[STIX]{x1D70E}_{2}+1)$
. For low dissipation, the ratio
 $\unicode[STIX]{x1D70E}_{1}/\unicode[STIX]{x1D70E}_{2}$
is large, meaning that
 $\unicode[STIX]{x1D70E}_{2}$
is insignificant in comparison to the other principal strain rates. The flow appears more two-dimensional in that case. This result is considered representative of the large-scale quiescent flow regions showing low enstrophy and dissipation levels, which are observed adjacent to the significant shear layers in the instantaneous turbulent flow (Ishihara et al.
Reference Ishihara, Kaneda and Hunt2013, and § 3.6). The enstrophy is low in an approximately two-dimensional flow region, because enstrophy production is associated with vorticity stretching, which is essentially three-dimensional. However, with increasing dissipation
 $\unicode[STIX]{x1D70E}_{2}$
gains relative importance and the ratio
 $\unicode[STIX]{x1D70E}_{1}/\unicode[STIX]{x1D70E}_{2}$
decreases approaching a value of 3 (figure 20), which is consistent with the strain ratios for intense dissipation reported by Ashurst et al. (Reference Ashurst, Kerstein, Kerr and Gibson1987). Consequently, the associated flow field at high dissipation is more three-dimensional. As vorticity is aligned with the intermediate principal straining direction within the conditionally averaged flow fields, increased
 $\unicode[STIX]{x1D70E}_{2}$
also means that vorticity stretching is stronger within the high dissipation flow structure. This is consistent with significant enstrophy production occurring in strain-dominated regions of the flow (Tsinober et al.
Reference Tsinober, Ortenberg and Shtilman1999; Tsinober Reference Tsinober, Hunt and Vassilicos2000). Furthermore, it has implications for the time evolution of the structure, which is discussed later.
Average velocity field in the strain eigenframe for
 $Re_{\unicode[STIX]{x1D706}}=433$
conditioned on (a) high dissipation (10 % data points with the highest dissipation) and (b) extreme dissipation (
 $\unicode[STIX]{x1D700}>75\unicode[STIX]{x1D700}_{mean}$
, corresponding to
 $1.4\times 10^{-4}\,\%$
of the total number of data points). Compare with the unconditional result shown in figure 1(a). Note the different scale of the axes in the plots.

The average flow structure conditioned on high dissipation (the bin containing the 10 % data points with the highest dissipation) and extreme dissipation (
 $\unicode[STIX]{x1D700}>75\unicode[STIX]{x1D700}_{mean}$
) are presented in the (
 $\unicode[STIX]{x1D709}_{1},\unicode[STIX]{x1D709}_{3}$
) plane in figure 21. The other planes, i.e. the (
 $\unicode[STIX]{x1D709}_{1},\unicode[STIX]{x1D709}_{2}$
) and (
 $\unicode[STIX]{x1D709}_{2},\unicode[STIX]{x1D709}_{3}$
) planes, are not shown here, because the flow pattern does not change significantly. These planes still show a saddle or a node topology, but the relative strength of the intermediate principal strain changes according to figure 20. The high dissipation case (figure 21
a) reveals stronger vortices inside the shear layer as compared to the unconditional result (figure 1
a), which is consistent with the more pronounced peak tangential velocity at the same condition. The peak is associated with the velocity induced by the vorticity in the shear layer, as argued in § 4. The stronger vortices also affect the streamlines near the vortex cores, which spiral around the vortex cores in the case of figure 21(a), but not in figure 1(a). A clearer change in the flow structure is found for the extreme dissipation condition (figure 21
b). It shows the vortices in close proximity. The distance between the cores is approximately
 $8\unicode[STIX]{x1D702}$
, which is similar to the vortex core diameter. It suggests the vortices may be colliding, although this cannot be confirmed in absence of temporal data. Together these very intense vortices produce a larger-scale swirling motion around them. Yet there remains a shear layer component visible. The extreme dissipation peak is located at the origin in between the vortices. Hence, the distance between the vortex cores and the dissipation is
 $4\unicode[STIX]{x1D702}$
, which appears consistent with the examples of extreme events in Yeung, Zhai & Sreenivasan (Reference Yeung, Zhai and Sreenivasan2015). They report peak dissipation and enstrophy within 2–
 $3\unicode[STIX]{x1D702}$
distances.
Colliding vortices are sources of extreme vorticity growth as shown by Schumacher, Eckhardt & Doering (Reference Schumacher, Eckhardt and Doering2010). However, they also showed that vorticity remained bounded. Moreover, enstrophy production is significant in (intense) strain regions (Tsinober et al.
Reference Tsinober, Ortenberg and Shtilman1999; Tsinober Reference Tsinober, Hunt and Vassilicos2000). Vorticity growth in the present conditionally averaged flow structure (figure 21
b) is assessed by considering the vorticity equation (1.1) in the direction of the intermediate principal strain axis,
 $\unicode[STIX]{x1D709}_{2}$
. This direction coincides with the direction of vorticity in the shear layer. It is found that inside the shear layer, vorticity amplification by vorticity stretching (figure 22
a) exceeds vorticity attenuation by diffusion (figure 22
b), as given by the first and second term on the right-hand side of the vorticity equation (1.1) respectively. The magnitude of the former is approximately three times higher. The difference corresponds to the material derivative of vorticity (1.1), i.e. vorticity growth rate, which is approximately
 $0.16\unicode[STIX]{x1D714}_{2}^{2}$
at the origin. The associated time scale for vorticity to increase by 100 % (assuming a constant growth rate) is
 $6.3\unicode[STIX]{x1D714}_{2}^{\text{-1}}$
, which corresponds to just 1.2 Kolmogorov time scales. Note that convection does not play an important role, because the velocities inside the shear layer are small. Therefore, vorticity inside this most intense dissipation structure grows rapidly, consistent with results in Schumacher et al. (Reference Schumacher, Eckhardt and Doering2010).
For comparison, figure 23 shows the same quantities for the unconditional shear layer, which appears to be more stable in the sense that (positive) vorticity stretching and (negative) vorticity diffusion approximately balance within the shear layer. As a result, the unconditional structure will evolve only slowly. With the conditioning on increasing dissipation the difference between vorticity stretching and diffusion increases gradually.
(a) Vorticity stretching,
 $(\unicode[STIX]{x1D64E}\unicode[STIX]{x1D74E})_{2}$
, and (b) vorticity diffusion,
 $\unicode[STIX]{x1D708}\unicode[STIX]{x1D6FB}^{2}\unicode[STIX]{x1D714}_{2}$
, in the average velocity field in the strain eigenframe conditioned on extreme dissipation (
 $\unicode[STIX]{x1D700}>75\unicode[STIX]{x1D700}_{mean}$
,
 $Re_{\unicode[STIX]{x1D706}}=433$
). Both quantities are normalized by
 $\unicode[STIX]{x1D714}_{2}^{2}$
at the origin.

(a) Vorticity stretching,
 $(\unicode[STIX]{x1D64E}\unicode[STIX]{x1D74E})_{2}$
, and (b) vorticity diffusion,
 $\unicode[STIX]{x1D708}\unicode[STIX]{x1D6FB}^{2}\unicode[STIX]{x1D714}_{2}$
, in the unconditional average velocity field in the strain eigenframe (
 $Re_{\unicode[STIX]{x1D706}}=433$
). Both quantities are normalized by
 $\unicode[STIX]{x1D714}_{2}^{2}$
at the origin.

6 Conclusions
The average flow in the strain eigenframe was evaluated for homogenous isotropic turbulence covering a wide range of Reynolds numbers (
 $34.6\leqslant Re_{\unicode[STIX]{x1D706}}\leqslant 1131$
). The resulting shear layer structures represent the velocity field associated with the local strain. The vortical motions and dissipation sheets inside this shear layer were shown to scale with the Kolmogorov length scale,
 $\unicode[STIX]{x1D702}$
. In particular, the vortex core diameter was
 $11\unicode[STIX]{x1D702}$
, which is consistent with reported values in the literature, while the vortex length was
 $90\unicode[STIX]{x1D702}$
. Flow visualizations over a wide range of Reynolds numbers have shown self-similar vortices, which suggests the vortex diameter and the vortex length should scale with the same turbulent length scale. The present results confirm this view and quantify the coherence length of these vortices along their axes. The dissipation structure was sheet-like with dimensions
 $20\unicode[STIX]{x1D702}\times 60\unicode[STIX]{x1D702}\times 60\unicode[STIX]{x1D702}$
. The spatial organization of vortices and dissipation sheets into shear layers yields a characteristic small-scale flow structure, whose coherence length is
 ${\sim}120\unicode[STIX]{x1D702}$
in all directions. This is significantly larger than the 10–
 $20\unicode[STIX]{x1D702}$
typically associated with the small scales based on the vortex core size alone. However, the spatial organization of the vortices and dissipation sheets considerably increases the small-scale coherence length.
The scaling analysis of the velocity field revealed how the average shear layer contains
 $\unicode[STIX]{x1D702}$
,
 $\unicode[STIX]{x1D706}_{T}$
and
 $L$
sized motions simultaneously. This illustrates the multi-scale character of the strain field. In particular, the tangential velocity profiles (figure 3) showed a peak at a distance
 $9\unicode[STIX]{x1D702}$
from the origin, while their tails extended up to
 $2.2L$
. Thus, large, integral scale motions bound the average shear layers. Furthermore, the peak tangential velocity was shown to scale with the Kolmogorov velocity scale. In the direction of shear layer vorticity, which coincides with the direction of intermediate principal strain, the velocity profiles revealed a stretching motion. The peak velocity in this direction was attained at
 $2\unicode[STIX]{x1D706}_{T}$
distance from the origin (figure 6), and its magnitude scaled with the Kolmogorov velocity scale at sufficiently large Reynolds number (
 $Re_{\unicode[STIX]{x1D706}}>200$
). Hence the vorticity stretching motions are associated with the Taylor length scale. The present velocity scaling results are in agreement with a similar analysis for anisotropic wall-bounded flow (Wei et al.
Reference Wei, Elsinga, Brethouwer, Schlatter and Johansson2014), albeit the later study was conducted over a limited Reynolds number range. The consistency in the scaling for different turbulent flows suggests that the average shear layer structure in the strain eigenframe is not only qualitatively universal (Elsinga & Marusic Reference Elsinga and Marusic2010), but may be quantitatively universal as well. Some further comparative work is warranted to confirm this conjecture.
The average shear layer dimensions presented here were found to be consistent with the instantaneous shear layer observed by Ishihara et al. (Reference Ishihara, Kaneda and Hunt2013) at high Reynolds number. It confirmed that the instantaneous results are statistically significant, and that the averaging in the strain eigenframe captures key features of the instantaneous turbulent flow. However, the velocity difference across the instantaneous shear layer was considerably larger. It, therefore, is an example of a very strong shear layer. Moreover, the comparison with the instantaneous flow led to conceptualize high Reynolds number shear layer structures. In the resulting schematic representation (figure 14
d,e),
 $4\unicode[STIX]{x1D706}_{T}$
sized straining motions maintain multiple characteristic small-scale structures by stretching their associated vorticity. The result is a significant shear layer with a total thickness of
 $4\unicode[STIX]{x1D706}_{T}$
, which is bounded on either side by large quiescent flow regions of integral size.
Two Reynolds number transitions in flow structure have been identified based on the present results (§ 3.5). The first occurs at around
 $Re_{\unicode[STIX]{x1D706}}=45$
. Below this Reynolds number, the length associated with the characteristic small-scale structure (
 ${\sim}120\unicode[STIX]{x1D702}$
) is larger than the largest-scale motions (
 $4.4L$
). As a result the small scales appear to be underdeveloped, meaning they are slightly smaller as compared to the fully developed small-scale structure at higher Reynolds number. A second transition is found at around
 $Re_{\unicode[STIX]{x1D706}}=250$
, which is related to the development of the vorticity stretching motions. The length scale associated with the stretching motions is
 $4\unicode[STIX]{x1D706}_{T}$
, which is larger than the characteristic small-scale structure only beyond
 $Re_{\unicode[STIX]{x1D706}}=250$
. The effect of the second transition is most pronounced in the magnitude of the vorticity stretching velocity when normalized by the Kolmogorov velocity scale (figure 7). The normalized stretching velocity initially increases with Reynolds number up to approximately
 $Re_{\unicode[STIX]{x1D706}}=250$
, beyond which it remains constant. Furthermore, high levels of vorticity stretching support the creation of extreme dissipation events. The velocity associated with these events depends on the Reynolds number. However, the Reynolds number dependence, i.e. the slope in figure 19, is observed to change around the transition point,
 $Re_{\unicode[STIX]{x1D706}}=250$
, which may be explained by a change in the vorticity stretching motions supporting extreme dissipation.
The average shear layer structure also captured the scale dependence in the vorticity alignment with the principal straining directions. Consistent with observations in actual turbulence, small-scale vorticity preferentially aligns with the small-scale intermediate principal strain and with the large scale most stretching principal strain. The cross-over length scale was determined (figure 16), which revealed a remaining Reynolds number dependence when normalized by the Kolmogorov or the Taylor length scale. It is, therefore, concluded that both the small and the larger scales affect the observed cross-over in vorticity alignment. This can be understood considering the local and non-local contributions to the strain field. This decomposition was introduced by Hamlington et al. (Reference Hamlington, Schumacher and Dahm2008). The velocity induced by small-scale vorticity contributes significantly to the local strain over distances, which scale with the Kolmogorov length scale. The fact that small-scale vorticity is layer-like explains its alignment with the local intermediate principal strain (Elsinga & Marusic Reference Elsinga and Marusic2010). The non-local or background strain, however, scales with the Taylor length scale, as shown by the present results. The most stretching principal straining direction of the non-local strain coincides with the intermediate principal straining direction of the local strain. Hence, the cross-over in vorticity alignment occurs at the point where the strain changes from local (
 $\unicode[STIX]{x1D702}$
scale) to non-local (
 $\unicode[STIX]{x1D706}_{T}$
scale), which exact location depends on both turbulent length scales.
One of the main findings is that the flow in the strain eigenframe is closely associated with large-scale motions. This applies to the unconditional flow, as well as the flow conditioned on extreme dissipation. The large-scale straining motions related to extreme dissipation, however, are stronger and more three-dimensional, which causes significant stretching and amplification of the small-scale vorticity (i.e. significant enstrophy production). As the amplified vorticity is organized in shear layers, it provides a significant additional local contribution to strain, which results in the very intense dissipation. Furthermore, the velocity associated with extreme dissipation remained Reynolds number dependent when normalized by the Kolmogorov velocity scale or
 $u_{rms}$
(figure 19). This suggests that both velocity scales influence dissipation, which is evidence for extreme dissipation being associated with the small and large scales simultaneously. Extreme dissipation, therefore, is not strictly a small-scale property.
Acknowledgement
The authors would like to thank Dr D. Fiscaletti for providing the vorticity auto-correlation data.


 Open access

