
I. INTRODUCTION
Lithium-ion batteries (LIBs) are widely used in portable electronic devices and electric vehicles. The market is demanding higher energy and powder density in LIBs, which is mainly determined by the materials used. It has been demonstrated to be an effective way to improve the capacity of LIBs by improving the performance of anode materials.Reference Jia, Stock, Kloepsch, He, Badillo, Fromm, Vortmann, Winter and Placke1–Reference Jeena, Lee, Kim, Kim, Kim, Park and Ryu5 Graphite is currently used as a common anode material in the industry, but the low theoretical capacity (372 mA h/g) limits the total capacity from further improving.Reference Yao, Zhang, Xue, Huang and Yu6,Reference Xu, Zhang, Gu, Zhang, Abdulla, Kumar and Zhao7 Among the various anode materials studied, silicon (Si) is attractive due to its high theoretical specific capacity (4200 mA h/g).Reference Shao, Smolianova, Tang and Zhang8 However, great volume change (>300%) happens during the insertion/extraction of lithium ion (Li+), which will lead to the collapse of the anode material.Reference Zhang, Yang, Xie, Yi, Huang and Chen9–Reference Jiang, Wang, Li, Zhang, Xie, Zhang, Chen and Niu13 So more attentions have been paid to SiO2, which has smaller theoretical specific capacity (1961 mA h/g) but the volume change is less than Si.Reference Li, Zhang, Fan, Wang, Wu, Sun and Zhang14,Reference Chang, Park, Kim, Kim, Jeong and Sohn15 At the same time, the preparation and cost of SiO2 is much lower than Si. All of above factors make SiO2 a promising alternative anode material for LIBs. SiO2 also has drawbacks such as poor conductivity and low coulombic efficiency at the initial charge–discharge cycle, which are urgent to be resolved.Reference Wang, Wu, Qu, Si, Tang, Zhou and Lu16–Reference Wu, Shi, Wang and Jin18 Many strategies have been tried to overcome these problems, one of which is to prepare unique nanostructures such as SiO2 nanotubes,Reference Favors, Wang, Bay, George, Ozkan and Ozkan19,Reference Chen, Liu, Sun and Xu20 or nanoparticles.Reference Yan, Wang, Zhong, Li, Wang, Hu and Chen21–Reference Liu, Zhong, Huang, Mao, Zhu and Huang23 Another way is to prepare SiO2-based composites.Reference Shi, Wang, Wang, Yuan, Jin and Yang24–Reference Zhou, Tian, Fan, Zhao, Zhou, Guo and Wang31 SiO2 composites with carbon get the most concern among the studies. The composites can not only improve the electrical conductivity, but also reduce the volume change to a great extent during the charge–discharge cycling to maintain stable electrochemical performance. For example, a 3D SiO2@graphene aerogel composite shows a reversible capacity of 300 mA h/g at a current density of 500 mA/g.Reference Meng, Cao, Suo, Liu, Zhang and Zheng32 Another SiO2/porous carbon shows a reversible capacity of 434 mA h/g after 50 cycles at 100 mA/g.Reference Yuan, Zhao, Shi, Liu, He and He33 A hollow silica sphere embedded in porous carbon matrix is reported to have a high specific capacity of about 910 mA h/g at the current density of 200 mA/g after 150 cycles.Reference Cao, Chuan, Li, Huang and Cao34 To get anode materials with high capacity and good stability, the active materials are prepared on a support, for example, a conductive flexible nanosheet substrate of TiO2 or VN, which provides short Li-ion and electron pathways, accommodates large volume variation, leading to much improved capacity. The mechanical stability of the substrate allows the electrode to maintain its structural stability.Reference Balogun, Qiu, Jian, Huang, Luo, Yang, Liang, Lu and Tong35,Reference Balogun, Zhu, Qiu, Luo, Huang, Liang, Lu and Tong36 We tried to prepare SiO2/C via a simpler way, where carbon works as the substrate. The idea is to prepare carbon and SiO2 from the same mixture. In previous work, we have prepared carbon by pyrolysis of ion exchange resin such as D113, which is a kind of polymer material. If the pyrolysis happens with the existence of iron ion, graphitic carbon is formed after pyrolysis. If no iron ion is in the resin, amorphous carbon is formed.
In this work, we designed a simple method to prepare amorphous SiO2/C composite as the anode material for LIBs. The amorphous SiO2 is prepared from tetraethylorthosilicate (TEOS), and amorphous carbon is from exchange resin. The composite is prepared by the pyrolysis of the mixture of TEOS and resin by two steps: SiO2 is formed first at a low heating temperature and the resin is carbonized at high temperature. The preparation method guarantees the uniform mixing of SiO2 and carbon. The composite exhibits a high and stable reversible capacity of ∼1024 mA h/g at the current density of 100 mA/g and retains 83% specific capacity after 100 cycles. The easy preparation, low cost, and high electrochemical performance make the as-prepared composite a promising anode material for lithium-ion batteries.
II. EXPERIMENTAL SECTION
All chemicals used as received from Aladdin Industrial Inc. (Shanghai, China) and were of analytical grade. All water was ultra-pure water from HITECH laboratory water purification system and the impedance was 18.3 MΩ.
A. Preparation of amorphous SiO2/C composite
D113 cation exchange resin (D113) was mixed with 1 mol/L HCl aqueous solution and stirred by using a blender for 24 h. The resin was washed by filtering with ultra-pure water for five times and dried in an oven. The dry resin was smashed into powder.
Ammonia solution (NH3·H2O) (12 mL) was added into the mixture of ethyl alcohol (21.7 mL) and ultra-pure water (330 mL) under stirring. TEOS (12 mL) and ethyl alcohol (60.7 mL) were mixed under stirring. The two mixtures were mixed together quickly and D113 powder (2 g) was added; the mixture was stirred for another 2 h. The mixture was gathered by centrifugation and washed with ultra-pure water, then it was dried in a vacuum oven. The dried powder was put in a quartz boat and heated in a tube oven. The first heat treatment happened in air at 220 °C for 3 h. Then the temperature was raised to 1100 °C under nitrogen atmosphere for 1 h. The heating rate was 5 °C/min in the whole process. Amorphous SiO2/C composites were gathered after the oven was cooled down to room temperature. For comparison, amorphous carbon was prepared under the same procedure without TEOS.
B. Material characterizations
1. Physical characterizations
The crystal structure of the materials was studied with a X-ray diffraction meter (XRD; D/Max-IIIA, Rigaku Co., Tokyo, Japan, CuK1, λ = 1.54056 Å radiation) with the angle range of 10°–80° and the scanning rate of 5°/min at 40 kV, 15 mA. The microscopic morphology of as-prepared samples were observed with transmission electron microscopy (TEM; JEM-2100HR, JEOL Ltd., Tokyo, Japan) operating at 200 kV. The surface elemental composition of the as-prepared samples were analyzed with X-ray photoelectron spectroscopy (XPS), ESCA Lab 250 (Thermo VG, East Grinstead, United Kingdom) with 200 W Al Kα radiation in twin anode, and the distance between the X-ray gun and sample is about 1 cm. The analysis chamber pressure is about 2 × 10⁻⁷ Pa, and the pass energy is 20 eV for high resolution scans.
2. Electrochemical characterizations
The electrochemical performance of all the samples were studied using coin cells (CR2032), which were assembled in the glove box filled with argon. Lithium foil was used as the counter electrode, and the working electrode was prepared with active materials, acetylene black, and polyvinylidene fluoride with the weight ratio of 80:20:10 1-methyl-2-pyrrolidinone (NMP) was used as solvent. The mixture was stirred for 6 h at room temperature, then it was coated onto a copper foil uniformly. The copper foil was dried at 120 °C for 10 h in a vacuum oven to evaporate the NMP. The electrolyte used was LiPF6 (1.0 M) mixed by ethylene carbonate/dimethyl carbonate with the volume ratio of 1:1, and the additives are vinylen carbonate (VC, 2%) and fluoroethylene carbonate (5%). The loading of the anode material is 5 mg/cm. The electrochemical performance of the as-prepared materials are studied by cyclic voltammetry (CV), galvanostatic charge–discharge cycling tests, and electrochemical impedance spectroscopy (EIS). CV was carried out at the potential range from the open circuit potential (OCP) to 0.01 V versus Li+/Li with the scan rate of 0.1 mV/s on the potentiostat (SP150, Biologic Instruments Co., Ltd., Seyssinet-Pariset, France). The galvanostatic charge–discharge cycles and rate performance were tested at different current densities with the potential range from 0.01 to 3.0 V versus Li+/Li on a battery testing system (Neware Electronic Co., Shengzhen, China). The EIS was tested on a potentiostat with the frequency range from 0.01 Hz to 100 kHz and the sinusoidal amplitude of 5 mV at OCP.
III. RESULTS AND DISCUSSION
A. The physical properties of the materials
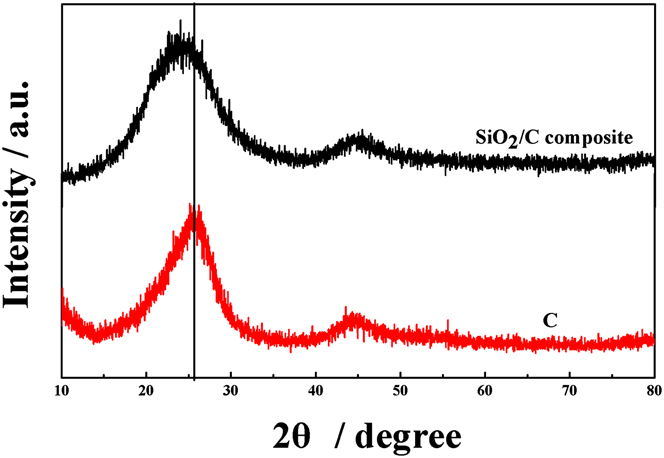
Both SiO2 and carbon are amorphous, which is proven by the XRD patterns shown in Fig. 1. In the XRD pattern of carbon, although the characteristic peaks of graphite centered at ∼26 and ∼43 °C can be found, the wide peak width at half height proves the amorphous structure of carbon instead of graphite. The amorphous carbon is the result of pyrolysis of ion exchange resin without graphitization catalyst. The XRD pattern the of SiO2/C composite shows an obvious shift of the peak at ∼26 °C, and the peak width at half height is much broader (8°) compared with carbon (5°). The shift is explained by the appearance of the peak of amorphous SiO2, which locates at 22° according to the literature.Reference Yan, Wang, Zhong, Li, Wang, Hu and Chen21,Reference Meng, Cao, Suo, Liu, Zhang and Zheng32,Reference Cao, Chuan, Li, Huang and Cao34 The broadening of the peak is explained by the amorphous nature of SiO2 prepared. The amorphous SiO2 is formed by the decomposition of TEOS at 220 °C in air. This step is continued by another heating at 1100 °C for the carbonization of resin and formation of amorphous carbon. In the XRD pattern of the SiO2/C composite there are no peaks of Si or SiC, which proves SiO2 will not be deoxidized under high temperature.Reference Yao, Zhang, Xue, Huang and Yu6
XRD patterns of the SiO2/C composite and carbon without SiO2.

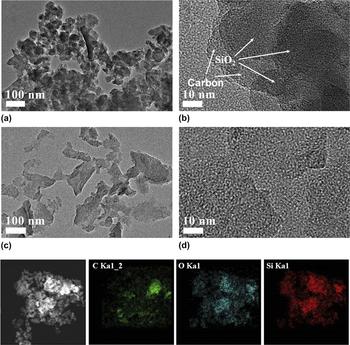
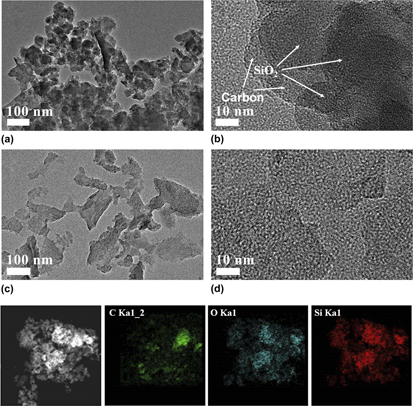
The morphology of the as-prepared SiO2/C composite and amorphous carbon was observed by TEM as shown in Figs. 2(a)–2(d). Comparing Figs. 2(a) and 2(c), the amorphous carbon is composed by slices with irregular shapes [Fig. 2(c)] and the diameter is roughly ranged between 20 and 100 nm. Even when observed at high resolution no crystal lattice fringes can be found in Fig. 2(d), proving the amorphous nature of the as-prepared carbon. The amorphous carbon is transparent in Fig. 2(c), while dark points can be found in Fig. 2(a). The dark points on the amorphous carbon slices are SiO2, which is also amorphous proven by the high-resolution TEM image of Fig. 2(b), no lattice fringe can be found. The size of the amorphous SiO2 is between 10 and 50 nm. The elemental mapping images of the SiO2/C composite show the distribution of C, Si, and O elements all over the sample. It is noted that the Si element disperses uniformly in the sample. The dispersion of O overlaps well with that of Si, proving the formation of SiO2. SiO2 has a good distribution in the carbon matrix as proved by the overlap of the C element and Si element.
TEM image of the SiO2/C composite (a, b) and carbon without SiO2 (c, d). Below is the elemental mapping images of C, Si, and O elements of the SiO2/C composite.

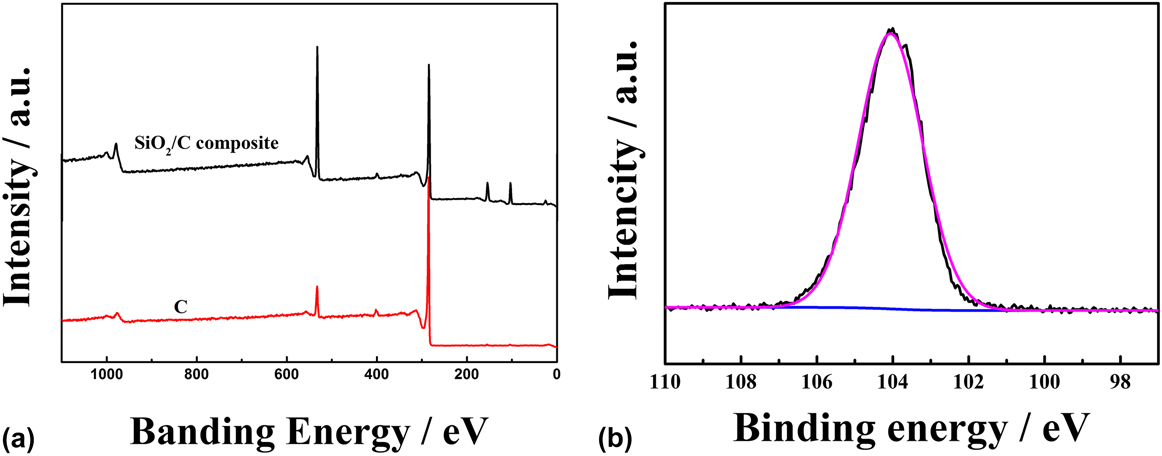
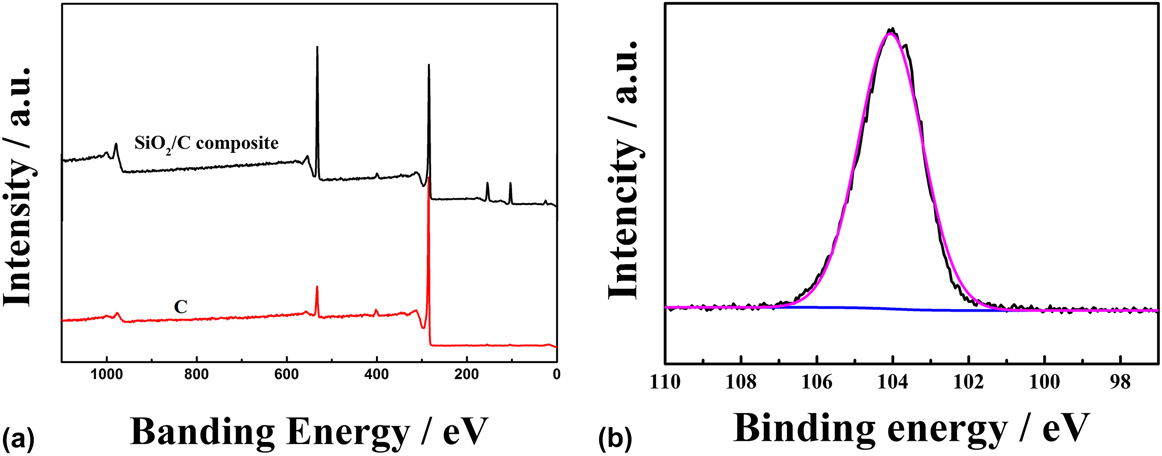
The elemental composition and chemical valence state of the SiO2/C composite are investigated with XPS. In the XPS survey spectrum in Fig. 3(a), the peaks at 103.5, 154.1, 285.8, 401.0, and 532.5 eV are assigned to the characteristic peaks of Si 2p3, Si 2s, C 1s, N 1s, and O 1s, respectively. The corresponding content of C, O, and Si in the SiO2/C composite is 62.88, 24.59, and 10.11 at.%. The atomic ratio of O to Si is about 2.45, the higher value is explained by the residual oxygen combined with carbon or adsorbed on the surface. The weight percentage of SiO2 in the composite is calculated to be 44.6 wt%. The high-resolution spectra of Si 2p3 is shown in Fig. 3(b), which is fitted with a strong peak at about 104.1 eV corresponding with the Si4+. The XPS results prove the formation of SiO2.Reference Meng, Cao, Suo, Liu, Zhang and Zheng32
(a) XPS survey of the SiO2/C composite and carbon without SiO2. (b) The high-resolution Si 2p3 spectra of SiO2/C composite.
B. The electrochemical performance of the materials
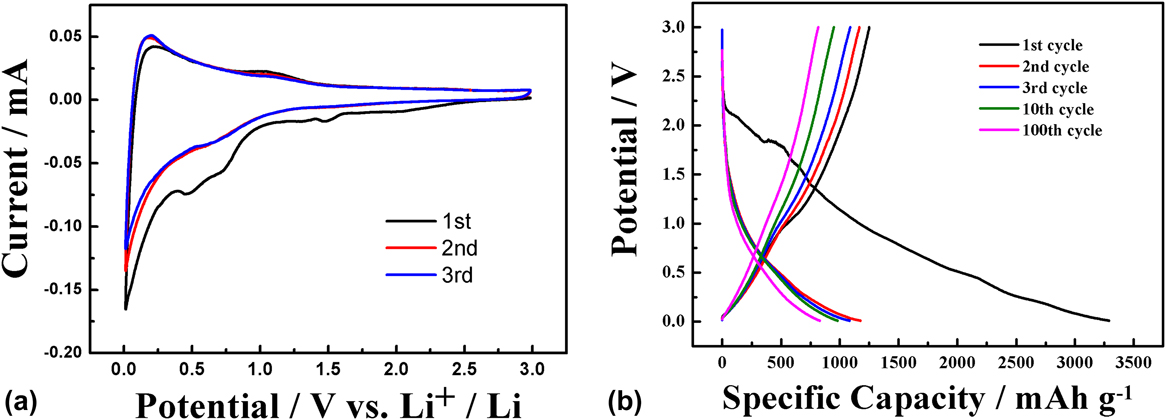
The electrochemical performance of the SiO2/C composite is studied by CV. The first three cycles of CV are shown in Fig. 4(a). Three reduction peaks are found which are located at 1.45, 0.73, and 0.47 V. The reduction peak at 1.45 V is attributed to the decomposition of the additive of vinylene carbonate in the electrolyte. The peak at 0.73 V is assigned to the decomposition of the electrolyte and to formation of a solid electrolyte interface (SEI) layer on the electrode surface. The reduction peak at 0.47 V is correlated with the irreversible reduction of SiO2 to Si. The irreversible reactions above are completed at the first cycle, so the peak disappears in the following cycles. The alloy and dealloy of Si with lithium are reversible reactions. The oxidation peak at 0.29 V of the first cycle is the dealloy of Li from Si, which shifts to lower potential in the following cycles, indicating increased reaction rate in the kinetic process. The second and third cycles of the CV curves almost overlap with each other, proving high stability and reversibility of the lithiation and delithiation reactions. The corresponding reaction equations are listed as follow:
 $$2{\rm{Si}}{{\rm{O}}_2} + 4{\rm{L}}{{\rm{i}}^ + } + 4{{\rm{e}}^ - } \to {\rm{L}}{{\rm{i}}_4}{\rm{Si}}{{\rm{O}}_4} + {\rm{Si}}\quad {\rm{,}}$$
 $${\rm{Si}}{{\rm{O}}_2} + 4{\rm{L}}{{\rm{i}}^ + } + 4{{\rm{e}}^ - } \to 2{\rm{L}}{{\rm{i}}_2}{\rm{O}} + {\rm{Si}}\quad {\rm{,}}$$
 $${\rm{Si}} + \chi {\rm{L}}{{\rm{i}}^ + } + \chi {{\rm{e}}^ - } \leftrightarrow {\rm{L}}{{\rm{i}}_\chi }{\rm{Si\ }}\quad {\rm{.}}$$
Cyclic voltammograms of the SiO2/C composite (a) at a scan rate of 0.1 mV/s and at the voltage range between 3.0 and 0.01 V, and the galvanostatic charge–discharge curves of the SiO2/C composite (b) at a current density of 100 mA/g between 3.0 and 0.01 V versus Li+/Li.

The galvanostatic charge–discharge curves of the SiO2/C composite are shown in Fig. 4(b). In the first cycle the SiO2/C composite presents a high discharge specific capacity of 3288 mA h/g and a charge specific capacity of 1250 mA h/g but with a very low coulombic efficiency of 38%. The second to the 10th specific capacities remain steady at 988 mA h/g with the coulombic efficiency of about 84%. The capacity is slightly reduced for the 100th cycle with the value of 841 mA h/g and the coulombic efficiency of about 86%. The high specific capacity of the SiO2/C composite can be explained by the contribution of SiO2 in the composite. The good stability is caused by the protection effect of the carbon slice to SiO2.
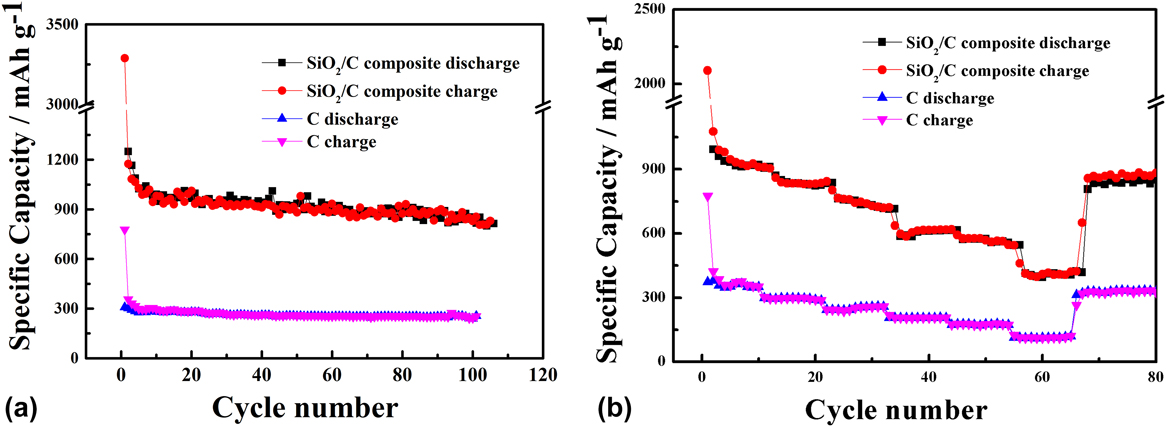
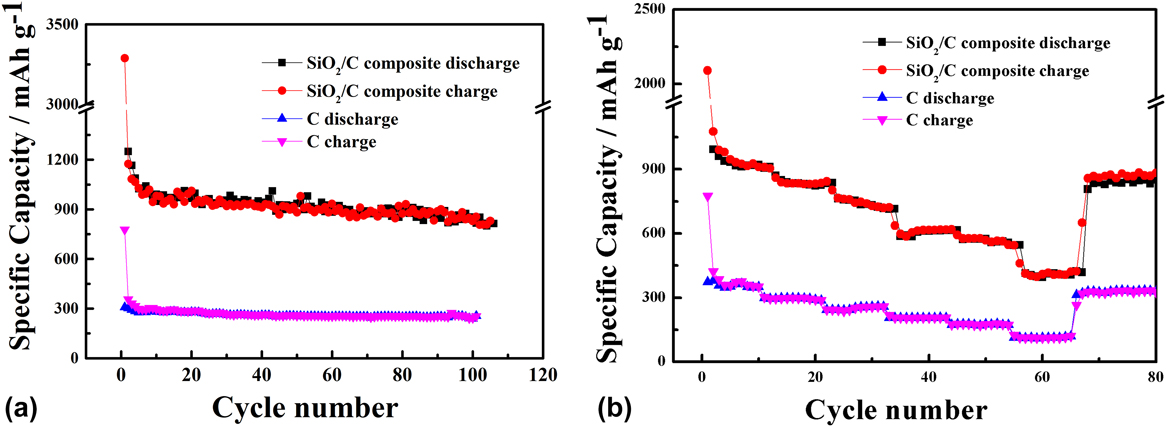
The stability of the SiO2/C composite as the anode material for LIBs is evaluated by the cycling performance and rate capability as shown in Fig. 5. The cycling performance was studied by discharging and charging at a current density of 100 mA/g for 100 cycles. Due to the formation of the SEI layer, the high specific capacity of 3288 mA h/g at the first discharge cannot be maintained. The reversible capacity can be stabilized after the first 10 cycles. The specific capacity remains at 915 mA h/g after 50 cycles with the capacity retention of 93.3% of the 10th cycle (980 mA h/g). The reversible capacity still keeps at 830 mA h/g after 100 cycles. Compared with the reversible specific capacity and stability of SiO2 in the recent report, the SiO2/C composite in this work presents excellent reversible specific capacity and stability.Reference Wang, Liu, Chen, Zhou, Lin, Hsu and Kuo37 The improved capacity is due to the existence of amorphous SiO2. The high stability is caused by the carbon coating, which can reduce the volume change and increase electrical conductivity. As a comparison, the cycling performance of carbon without SiO2 is also investigated. The as-prepared carbon shows extremely high stability with much lower capacity. The reversible specific capacity of SiO2/C composite is 3.5 times higher than that of pure carbon, proving the advantage of the SiO2/C structure compared with only carbon. Figure 5(b) presents the rate capability of the SiO2/C composite and C at different current densities of 100, 200, 400, 800, 1000, and 2000 mA/g between 3.0 and 0.01 V versus Li+/Li. The corresponding specific capacities of the SiO2/C composite are about 920, 835, 732, 610, 576, and 407 mA h/g, respectively. The SiO2/C composite shows excellent high current charging-discharging capability, this is proven by the specific capacity at the current density of 2000 mA/g, which is even higher than carbon at a low current density of 100 mA/g (357 mA h/g). It is also noted that at all current densities, the charge and discharge capacities are almost identical, showing high coulombic efficiency. After the cycles at different current densities and returning to 100 mA/g, the specific capacity almost returns to the initial value, showing high stability. The stable specific capacity in the rate performance test is explained by the protection effect of the carbon coating in the SiO2/C composite and the volume expansion is effectively reduced.
Cycling performance (a) and rate capability (b) of SiO2/C composites and carbon without SiO2.
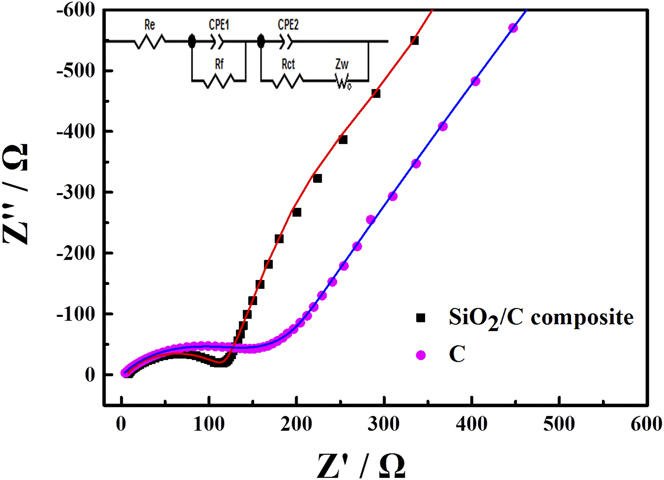
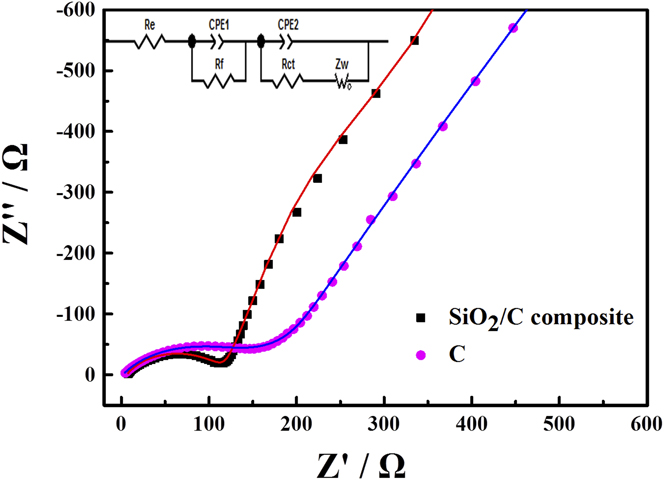
The EIS was used to study the electrochemical reaction kinetics of the as-prepared materials. The Nyquist plots and corresponding fitted curves were shown in Fig. 6 with equivalent circuit used for fitting. The Nyquist plots consist of a depressed semicircle in the high-frequency region and a straight line in low-frequency region. The elements in the equivalent circuit are used to analyze the kinetic parameters of the electrochemical process. Among which R e is the resistance of lithium-ion transport in the electrolyte, R f is the resistance of the SEI film, R ct is the charge transfer resistance, Z w is the Warburg impedance, CPE1 is correlated to lithium-ion diffusion, and CPE2 represents the capacitance of the SEI film and the double layer, respectively. In the depressed semicircle, the diameter was related to the SEI film resistance (R f) and charge transfer resistance (R ct), while the straight line is correlated to the lithium-ion diffusion.Reference Wang and Fan38,Reference Zhan, Zhang, Cao, Wu, Lin, Yu, Zhang, Zeng, Xie, Zhang, Chen and Meng39 By fitting the Nyquist plots with the equivalent circuit, the value of each parameter is obtained simultaneously. The SEI film resistance and charge transfer resistance of the SiO2/C composite are 57.16 and 113.5 Ω, which is much less than those of pure carbon with the corresponding value of 145.7 and 193.2 Ω. The smaller resistance is caused by the improved conductivity of the material by the carbon coating.
Nyquist plots of SiO2/C composites and carbon without SiO2, and the inset shows the equivalent electronic circuit used for fitting.
IV. CONCLUSION
The SiO2/C composite is prepared via a two step pyrolysis from one precursor, which is the mixture of the precursor of SiO2 and carbon. The preparation guarantees the uniform mixing of SiO2 and carbon, which attributes to the reduction of volume change during the lithiation and delithiation of SiO2. Both SiO2 and carbon are amorphous, which contribute to the cycling stability because of the less volume change of amorphous SiO2 compared with the crystallized one. The carbon coating plays an important role in the material, which not only increases the electrical conductivity but also helps to reduce the volume change. The above factors make the SiO2/C composite a stable anode material with high cycling stability.
ACKNOWLEDGMENTS
This work was supported by National Natural Science Foundation of China (21476096, 21576301, 51303217, and 51373205); Pearl River S&T Nova Program of Guangzhou (2013J2200040); 5th Blue Ocean Talent Project of Nanhai, Foshan (201512230001); Innovation projects of Guangdong universities (2015KTSCX014); and the Fundamental Research Funds for the Central Universities (21615433).