INTRODUCTION
Amoebiasis also called traveller's diarrhoea is defined by the World Health Organization (WHO) and Pan American Health Organization as an infection with Entamoeba histolytica, regardless of symptomatology, responsible for 34–50 million symptomatic cases of amoebiasis worldwide every year, causing 40 000–100 000 deaths annually (WHO, 1997). Although E. histolytica was previously thought to infect 10% of the world's population, two morphologically identical, but genetically distinct and apparently non-pathogenic Entamoeba species viz. Entamoeba dispar and Entamoeba moshkovskii are now recognized as causing most asymptomatic cases (Pritt and Clark, Reference Pritt and Clark2008). Reliable diagnosis of invasive amoebiasis in the clinical setting has important epidemiological implications, since the majority of official epidemiological records in health, mostly in developing countries, are based on clinical observations (Ximenez et al. Reference Ximenez, Moran, Rojas, Valadez and Gomez2009). Interpretation of these studies, however, is difficult because a majority of the diagnosis of amoebiasis was based solely on stool microscopy, which is an insensitive test that fails to distinguish the morphologically similar E. histolytica from E. dispar (Tanyuksel and Petri, Reference Tanyuksel and Petri2003). In the post-genomic era, polymerase chain reaction (PCR)-based assays have been developed and widely used to detect Entamoeba species because of their high sensitivity, being 100 times more sensitive than enzyme linked immunosorbent assay (ELISA) (Mirelman et al. Reference Mirelman, Nuchamowitz and Stolarsky1997; Fotedar et al. Reference Fotedar, Stark, Beebe, Marriot, Ellis and Harkness2007).
Pathogenic enteric protozoan parasitic infection resulted in considerable gastrointestinal morbidity, malnutrition and mortality globally (Feng and Xiao, Reference Feng and Xiao2011). It is estimated that as much as 60% of the world's populations are infected with intestinal parasites and are among the most common infections globally (WHO, 2002). According to WHO report, 3·5 billion people are affected globally, and 450 million get sick because of these intestinal parasitic infections (WHO, 1998). Though intestinal polyparasitism is becoming a common feature in human populations, very little is known about its epidemiological significance, long-term impact on human health or the types of interactions that occur between the different parasitic species involved (Nguhiu et al. Reference Nguhiu, Kariuki, Magambo, Kimani, Mwatha, Muchiri, Dunne, Vennervald and Mkoji2009). Previous studies have highlighted that Giardia duodenalis, E. histolytica/dispar, C. parvum, Cyclospora cayetanensis and Enterocytozoon bieneusi are the common pathogenic protozoan parasites infecting a human, particularly in developing countries (Goodgame, Reference Goodgame2003; Verweij et al. Reference Verweij, Blange, Templeton, Schinkel, Brienen, van Rooyen, van Lieshout and Polderman2004; Alyousefi et al. Reference Alyousefi, Mahdy, Mahmud and Lim2011). However, there have been few studies reported on gastrointestinal diarrheagenic protozoan polyparasitic infection and in this context, it is important to extend our understanding of the epidemiology and the extent of polyparasitism in order to assess its true scale and geographical distribution.
The present study area (Southern Assam) a part of Northeast India represents a peculiar terrain which is of floodplain nature and remains a suitable environment for food- and water-borne parasitical disease transmission. So far, no data are available from this region, on the polyparasitism of water-borne diarrheagenic protozoan parasitic infection with similar clinical presentations. The present study is aimed to determine the prevalence rate of E. histolytica, the parasite responsible for amoebic dysentery along with co-infection rate of four common diarrheagenic protozoan parasites using improved diagnostic techniques. An attempt has been made to study their association with clinical status, sex and age biases if any.
MATERIALS AND METHODS
Study design and sample collection
This was a cross-sectional study conducted from June 2012 to May 2013 among 356 participants living in Northeast India. Single population proportion formula (Daniel, Reference Daniel1999) was used to estimate the sample size with an expected prevalence of 15%. Stool samples were collected from participants regardless of their age, sex and symptom through the community-level surveys work in different areas of Northeast India. Histories of the participants were recorded in the form of questionnaires considering disease symptoms, HIV status and other possible risk factors. All stool samples were collected with the consent of each participant, and ethical clearance was obtained from the Institutional Ethical Committee prior to the study. Within a maximum of 3 h after collection, each stool sample was aliquoted into three parts: one part was immediately used for microscopic analysis; the second part was stored at 4 °C for formal ether concentration (dot blot screening) and the third part was stored at −20 °C for PCR assay.
Microscopy
Fresh unpreserved stool specimens were examined for cyst/trophozoite stages by direct wet mounting with Lugol's iodine (diluted 1:5 with distilled water), while investigation of oocyst stages was done using modified Ziehl-Neelsen (ZN) staining technique as previously described (Potters and Van Esbroeck, Reference Potters and Van Esbroeck2010). At least 50–60 fields per slide were screened before confirming sample negativity in the laboratory.
Dot blot screening
All the stool samples were initially passed through dot blot screening using 4·5 kb hybridization probe (EcoRI to Hind III site) from HMe region of EhR1 (rDNA plasmid in HM1:IMSS strain of E. histolytica) as previously described (Nath et al. Reference Nath, Banyal, Gautam, Ghosh, Singha and Paul2014). Briefly, crude DNA was obtained from enriched cysts using sonication. After alkaline denaturation of the crude cysts, DNA were spotted as triplicate on to a pre-saturated GS+ nylon membrane using Minifold Dot blot apparatus and thereafter hybridization with 4·5 Kb rDNA fragment (EcoRI + HindIII) was carried out that hybridized both with E. histolytica and E. dispar (Srivastva et al. Reference Srivastva, Bhattacharya and Paul2005).
Genomic DNA extraction from stool sample
The genomic DNA was purified from the frozen stool samples using Nucleo-pore™ stool DNA stool kit (Genetix Biotech Asia Pvt. Ltd., New Delhi, India) as per protocol provided by the supplier with some modifications. Briefly, with the addition of five freezing-thawing cycles, samples were vortexed vigorously for 5–10 min in lysis buffer FL containing thrashing beads (Genetix Biotech Asia Pvt. Ltd., New Delhi, India). The samples were then processed according to manufacturer's instructions except final elution in 50 μL of elution buffer FEB. Sensitivity of the technique was assured by isolating genomic DNA from samples by seeding Entamoeba negative stool samples with pure culture of the parasite to keep track of absence of PCR inhibitors.
Multiplex PCR assay for dot blotted positive samples
Dot blot positive samples were subjected to single round multiplex PCR assay for differential diagnosis of E. histolytica and E. dispar as previously published using primers EntaF: 5′ATGCACGAGAGCGAAAGCAT-3′; EhR: 5′GATCTAGAAACAATGCTTCTCT-3′ and EdR: 5′CACCACTTACTATCCCTACC-3′ where, the forward primer EntaF is common for both, while the reverse primers EhR and EdR are specific for E. histolytica and E. dispar, respectively (Hamzah et al. Reference Hamzah, Petmitr, Mungthin, Leelayoova and Chavalitshewinkoon-Petmitr2006).
Single PCR assay for co-infecting parasite detection
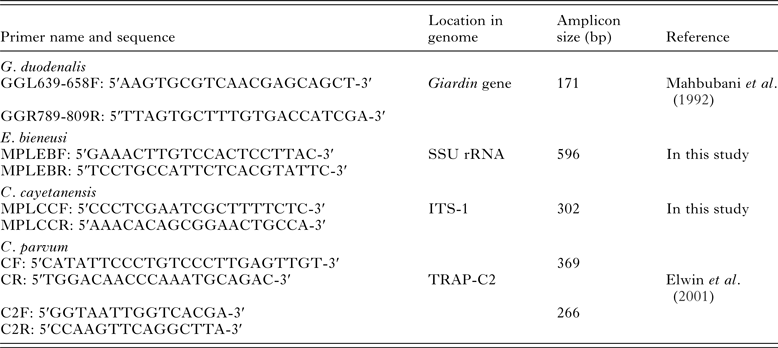
Entamoeba histolytica positive samples in multiplex PCR assay were further subjected to single PCR assay specific for C. parvum, E. bieneusi, C. cayetanensis and G. duodenalis using species-specific primers represented in Table 1. Briefly, PCR amplifications were performed in a volume of 20 μL with 100 ng of sample DNA, 1 μ m of each primer, 1x PCR buffer, 2 mm MgCl2, 1x BSA, 0·2 m dNTPs and 1 U of Taq DNA Polymerase (Thermo Scientific, Wattham, USA) in the MJ Mini™ (Bio-Rad Laboratories, Hercules, CA) thermal cycler. In a nested PCR protocol for detection of C. parvum, amplifications were performed as mentioned above in the primary PCR step, while in the secondary PCR 1–2 μL of primary PCR amplicons were used as template along with other components of the reaction mixture in a final volume of 20 μL. Amplicons from PCR were confirmed by their expected amplicon sizes through electrophoresis. Some of the positive amplicons were sequenced directly using respective primer sets with an ABI 3500 Genetic analyzer (Applied Biosystems Inc., CA, USA) from Genome service of Department of Biotechnology, Assam University and finally subjected to homology search using the program nucleotide blast (blastn) available National Centre for Biotechnological Information (http://www.ncbi.nlm.nih.gov) database for further validation.
List of primers used in the study

Statistical analysis
Statistical analysis was carried out using the statistical software SPSS version 16.0 (SPSS, Chicago, IL, USA). A Pearson's Chi-square was used to compare proportions between variables in a univariate statistical model. An odds ratio (OR) and 95% confidence interval (CI) was computed by the univariate logistic regression analysis for statistically significant factor showing level of statistical significance P < 0·05.
RESULTS
Socio-demographic characteristics
Of the 356 participants selected for investigation, 120 (33·7%) were males and the rest 236 (66·3%) were females. With regard to the age of study participants, 93 (26·1%) were in the age group ≥15 years old, 83 (23·3%) were in the age group 16–30 years old, 105 (29·5%) were in the age group 31–45 years and 75 (21·1%) were above 45 years old. We collected samples from participants irrespective of their symptomatology. Almost half of the study respondents, 186 (52·2%) had gastrointestinal complaints at the time of sample collection. Out of 356 samples, 105 (29·5%) were collected from participants during pre-monsoon period, while 110 (30·9%) and 141 (39·6%) were collected during monsoon and post-monsoon period, respectively.
Diagnosis of amoebic dysentery
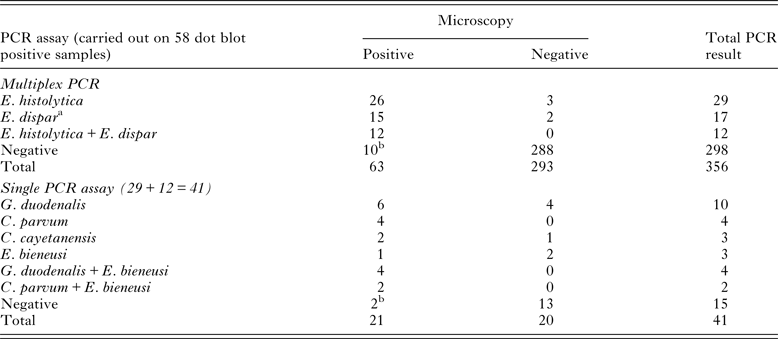
By microscopy, a total of 63 (17·7%) out of 356 stool samples were detected positive for cyst or trophozoite stages of Entamoeba, while dot blot screening performed on same stool specimens showed positivity in 58 (16·3%) samples (Table 2). The multiplex PCR carried out in a single tube, involved primer sets specific for E. histolytica and E. dispar was performed on 58 dot blot positive samples. We detected E. histolytica mono-infection in 8·1% (29/356), E. dispar mono-infection in 4·8% (17/356) and E. histolytica and E. dispar mixed infections in 3·4% (12/356) of stool samples. Multiplex PCR generated specific diagnostic amplicons of 166 bp for E. histolytica and 752 bp for E. dispar (Fig. 1). Sequences of the PCR products from both the species were confirmed by sequencing. Amongst the 63 fecal samples that were positive in microscopy using wet preparation PCR amplification accurately diagnosed 26 E. histolytica, 15 E. dispar, 12 mixed infections with both the parasites and 10 samples turned as PCR negative. Ten samples though showed the positive results with microscopy but were negative both by DNA dot blot and multiplex PCR assay indicating the false-positive samples (Table 2). DNA hybridization assay and PCR were repeated for those 10 samples, but did not yield a positive signal or diagnostic amplicon, respectively. The absences of PCR inhibitors in the negative samples were further confirmed by seeding with Entamoeba positive genomic DNA template, which yielded a positive result in these samples.
Representative gel picture showing differential detection of E. histolytica and E. dispar by multiplex PCR on stool samples. Lane M – 1 bp DNA marker, lanes 1, 2 – positive control E. histolytica (HM1: IMSS strain) and E. dispar (sequence confirmed), respectively, lane 3 – E. histolytica (monoinfection), lane 4 – E. histolytica and E. dispar (mixed infection), lane 5 – negative sample, lane 6 – E. dispar (monoinfection) and lane 7 – no template control (NTC).

Comparison of results of PCR assay and microscopy of all the stool specimens for detection of E. histolytica and other co-infecting protozoan parasites

a Since E. dispar is not the causative pathogen of amoebic dysentery, co-infection studies with other parasites were carried out only with E. histolytica positive samples.
b Indicates samples which are microscopy positive but PCR negative.
Co-infection identification using PCR
Co-infection studies were carried out in all E. histolytica positive samples (29 + 12). Out of 41 samples, only 26 samples exhibited co-infection with at least any one of the four diarrheagenic protozoan parasites, considered in our study (Table 3). Single PCR generated specific diagnostic amplicons of 171, 596, 302 and 266 bp, respectively, for G. duodenalis, E. bieneusi, C. cayetanensis and C. parvum (Fig. 2). PCR assay detected co-infection of G. duodenalis in 34·1% (95% CI = 20·6, 50·7), C. parvum in 14·6% (95% CI = 6·1, 29·9), C. cayetanensis in 7·3% (95% CI = 1·9, 21·0) and E. bieneusi in 22·0% (95% CI = 11·1, 38·0) cases of E. histolytica positive samples. Moreover, out of 41 amoebic dysentery cases, 21 were microscopy positive for at least one of the co-infecting parasites, while PCR assay confirmed seven more samples (Table 2). Thus, as per molecular consensus, overall microscopic diagnosis yielded 3·4% (12/356) false-negative and 7·6% (27/356) false-positive results. Some of the PCR products were sequence to validate for confirmation of the species.
Representative gel picture showing detection of co-infecting parasite using PCR assay. (A) PCR amplification using G. intestinalis specific primer pairs. Lane M – 100 bp DNA marker, lane 1 – positive control (sequence confirmed), lanes 2, 3, 4, 6 – positive sample, lane 5 – negative sample and lane 7 – no template control (NTC). (B) PCR amplification using E. bieneusi specific primer pairs. Lane M – 100 bp DNA marker, lane 1 – positive control (sequence confirmed), lanes 2, 3, 5, 6 – positive sample, lane 4 – negative sample and lane 7 – NTC. (C) PCR amplification using C. cayetanensis specific primer pairs. Lane M – 100 bp DNA marker, lane 1 – positive control (sequence confirmed), lanes 3, 4, 6 – positive sample, lanes 2, 5 – negative sample and lane 7 – NTC. (D) Nested secondary PCR amplification using C. parvum specific primer pairs. Lane M – 100 bp DNA marker, lane 1 – positive control (sequence confirmed), lanes 2, 3, 4, 6 – positive sample, lane 5 – negative sample and lane 7 – NTC.

Distribution of co-infected parasites found either as mono or mixed infection in stool specimens positive for E. histolytica

Association of co-infection
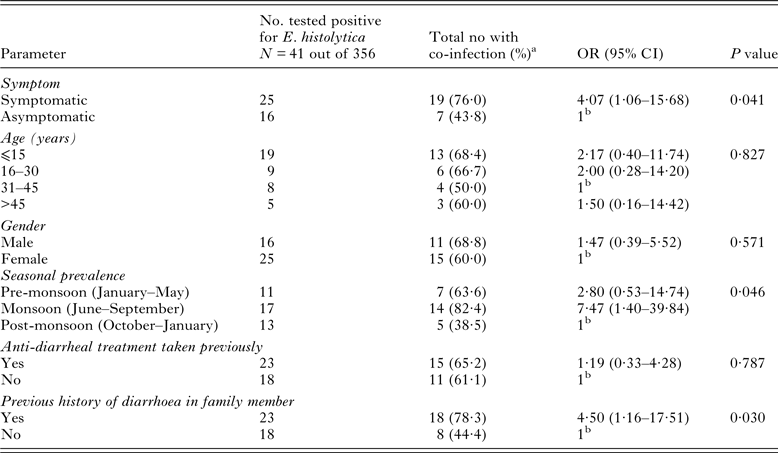
Association of sex, age and clinical status that contributed to the co-infection rate of the parasite in amoebic dysentery cases were compared in Table 4. Our univariate statistical analysis revealed that the overall co-infection rate was higher in the symptomatic patients (OR = 4·07; 95% CI = 1·06, 15·68; P = 0·041). Prevalence rate of co-infection was higher during the monsoon period (OR = 7·47; 95% CI = 1·40, 39·84; P = 0·046). Within the study group, individuals with family history of parasitic infection recorded a significant association with the disease (OR = 4·50; 95% CI = 1·16, 17·51; P = 0·030). However, other parameters such as age, gender, anti-diarrheal treatment taken previously did not contribute to any important association of Entamoeba with co-infecting parasites.
Association of co-infection rate with demographic and clinical features of participants

a Number include amoebic dysentery patient having co-infection with any one of the four parasites under study.
b 1 = reference category.
DISCUSSION
Gastrointestinal polyparasitism seems to be a common health problem in human populations, particularly in developing countries. However, relatively few studies have actually focused on polyparasitism as compared with its frequency and most cases it was ignored in epidemiological surveys. Polyparasitism has been linked with disease severity in T. gondii infection (Gibson et al. Reference Gibson, Raverty, Lambourn, Huggins, Magargal and Grigg2011). To date, most of the studies are focused on single species infection, while the health impact due to polyparasitism remains poorly understood.
As per recommendation of WHO, E. histolytica should be specifically identified and if present should be treated; if only E. dispar or E. moshkovskii are identified, treatment is unnecessary (WHO, 1997). In our study, out of 356 samples analysed, at most 63 samples were microscopically positive out of which PCR assay diagnosed E. histolytica infection only in 38 (mono and mixed infection). The 10 samples which were turned as PCR negative may be due to other Entamoeba species infection. Thus, only 60·3% (38/63) of the samples were actually amoebic dysentery cases while the remaining 39·7% (25/63) of the microscopy positive samples were false-positive, suggesting that improved molecular diagnosis is necessary to avoid overrepresentation of the parasite and hence the use of drug can be minimized. A hospital-based study in Southern India, observed only 19% of stool samples, resembling E. histolytica by microscopy was, in fact, E. histolytica by PCR-based method (Parija and Khairnar, Reference Parija and Khairnar2005). Similarly, in a report from Australia, half of the microscopy positive stool samples were PCR-positive for non-pathogenic E. moshkovskii (Fotedar et al. Reference Fotedar, Stark, Marriott, Ellis and Harkness2008). Tengku and Norhayati (Reference Tengku and Norhayati2011) suggested E. histolytica infection was still prevalent in Malaysia among Aborigines but further confirmations using molecular tools are recommended.
Prevalence rate of the E. histolytica varied with a geographical region. Using PCR-based technique, a prevalence rate was 11·5% in our study that was lower as compared with a study conducted in rural communities of Malaysia (Ngui et al. Reference Ngui, Angal, Fakhrurrazi, Lian, Ling, Ibrahim and Mahmud2012), whereas the rate was as high as 54·5% observed in African population of Kigali, Rwanda (Emile et al. Reference Emile, Bosco and Karine2013). However, a study conducted in Australia reported 70·8% of patients infected with E. dispar, compared with 4·5% of E. histolytica and 61·8% of E. moshkovskii (Fotedar et al. Reference Fotedar, Stark, Beebe, Marriot, Ellis and Harkness2007). A study highlighted the high risk of E. histolytica or E. dispar infection among travellers for destinations such as East Africa, West Africa and South and South-East Asia and intestinal co-infections were found in more than 50% of the cases (Herbinger et al. Reference Herbinger, Fleischmann, Weber, Perona, Loscher and Bretzel2011).
Because of their similar clinical presentations and since microscopic diagnosis of these parasites is neither sensitive nor specific a multiplex real-time PCR assay for detection of E. histolytica, G. duodenalis and C. parvum has been developed by Verweij et al. (Reference Verweij, Blange, Templeton, Schinkel, Brienen, van Rooyen, van Lieshout and Polderman2004) where, PCR assay was found to be more sensitive than microscopy. Similarly, single PCR used in our investigation also detected seven more infected samples compared with microscopy, minimizing the chance of false negativity. In the present study, we have found significantly higher co-infection rate of G. duodenalis in amoebic dysentery cases compared with other three diarrheagenic protozoan parasites. Noor Azian et al. (Reference Noor Azian, San, Gan, Yusri, Nurulsyamzawaty, Zuhaizam, Maslawaty, Norparina and Vythilingam2007) reported 3·8% co-infection rate of G. duodenalis with E. histolytica in an aborigine community in Pahang, Malaysia. In a different study in Ethiopian population, multiple infections were found in 4·6% of the total examined participants (Gelaw et al. Reference Gelaw, Anagaw, Nigussie, Silesh, Yirga, Alem, Endris and Gelaw2013). Recently, Liu et al. (Reference Liu, Shen, Yin, Yuan, Jiang, Xu, Pan, Hu and Cao2014) reported co-infection of Cryptosporidium spp., Enterocytozoon and Giardia in diarrheal outpatients in China.
In this present study, polyparasitism was significantly more in symptomatic population, and the higher trend was seen in the age group ⩽15 years compared with other age groups however, did not attain a significant value. Higher diarrheal incidence in children particularly in malnourished and/or stunted children was also observed in various studies conducted in different countries (Haque et al. Reference Haque, Mondal, Kirkpatrick, Akther, Farr, Sack and Petri2003; Lopez et al. Reference Lopez, Bendik, Alliance, Roberts, da Silva, Moura, Arrowood, Eberhard and Herwaldt2003; Ngui et al. Reference Ngui, Ishak, Chuen, Mahmud and Lim2011; Wegayehu et al. Reference Wegayehu, Adamu and Petros2013). As expected overall polyparasitism was considerably more in the monsoon season compared with pre- and post-monsoon. This could be partly explained due to the terrain of the study site being a floodplain one; during monsoon season, cysts/oocysts are found in contaminated water as a result of the deposition of fecal material get easily transmitted through water current and contaminate nearby water bodies of various localities, increasing the disease burden. Significant association between occurrence of diarrhoea and presence of intestinal parasites was observed in comparative studies between patients with, and without diarrhoea carried out in Iran and Paris (Mirzaei, Reference Mirzaei2007; Pavie et al. Reference Pavie, Menotti, Porcher, Donay, Gallien, Sarfati, Derouin and Molina2012).
In conclusion, this is the first report on co-infection of major diarrheagenic protozoan parasites among dysentery cases from the Northeastern part of India suggesting implementation of broad-spectrum diagnostic tools and integrated control strategy for better point-of-care. Our study further highlighted that improved molecular diagnosis is required for parasites having similar clinical presentations, particularly in disease endemic area to minimize the degree of false positivity and negativity rate associated with conventional diagnosis. Whether the spectrum of the diarrhoea diseases changes in the burden of co-infections is yet to be established.
ACKNOWLEDGEMENTS
The authors acknowledge the respondents who participated in the study. The authors gratefully acknowledge the medical staff who helped with microscopic observations and sample collection.
FINANCIAL SUPPORT
This work was supported by the Department of Biotechnology, Government of India (BT/55/NE/TBP/2010).