INTRODUCTION
Many recent palaeoclimatic studies have focused on Marine Isotopic Stages (MIS) 5e and 11, as they have long been considered, for different reasons, to be the best analog to our modern interglacial (Tzedakis et al., Reference Tzedakis, Raynaud, McManus, Berger, Brovkin and Kiefer2009; Shakun et al., Reference Shakun, Lea, Lisiecki and Raymo2015; Past Interglacials Working Group of PAGES, 2016). For interglacial comparisons, most investigations have focused on long marine or ice core records; fewer archives covering almost continuously interglacial periods are available for continental areas (Lang and Wolff, Reference Lang and Wolff2011; Past Interglacials Working Group of PAGES, 2016).
Because they are characteristic of wet and temperate periods (Pentecost, Reference Pentecost1995, Reference Pentecost2005), calcareous tufas are key archives for studying interglacials. These continental open-air deposits result from calcite precipitation from meteoric waters at ambient temperature (Capezzuoli et al., Reference Capezzuoli, Gandin and Pedley2014) and are thus suitable targets for palaeoclimatic reconstructions, especially from oxygen and carbon stable isotopes (Andrews, Reference Andrews2006; Dabkowski et al., Reference Dabkowski, Limondin-Lozouet, Antoine, Marca-Bell and Andrews2011). Furthermore, they routinely host evidence of past environmental conditions via well-preserved faunal and floral assemblages that, together with calcite, provide supports for various radiometric dating methods (mainly U/Th series and radiocarbon) (Dabkowski, Reference Dabkowski2014).
Tufas are particularly favourable both to the development of molluscan communities and the in situ preservation of their shells, allowing an accurate reconstruction of the progressive forest extension during interglacial periods (Preece, Reference Preece1991). In western Europe, malacological studies undertaken in recent years have already demonstrated a significant decrease in the Holocene forest land snail diversity compared with the Pleistocene (Limondin-Lozouet and Preece, Reference Limondin-Lozouet and Preece2014). This difference is due to the occurrence within Pleistocene successions of several species with current ranges centred within central and southern Europe, having never reached the westernmost part of Europe during the Holocene.
Using isotopic data from Caours (Somme) and La-Celle-sur-Seine (Seine-et-Marne) respectively assigned to MIS 5e and MIS 11, and previously unpublished data from Saint-Germain-le-Vasson tufa (Normandy) dated to the first half of the Holocene, we investigate climatic similarities or differences between these Pleistocene interglacials and the modern one that may have affected species distribution.
STUDIED AREA AND SITES
General settings
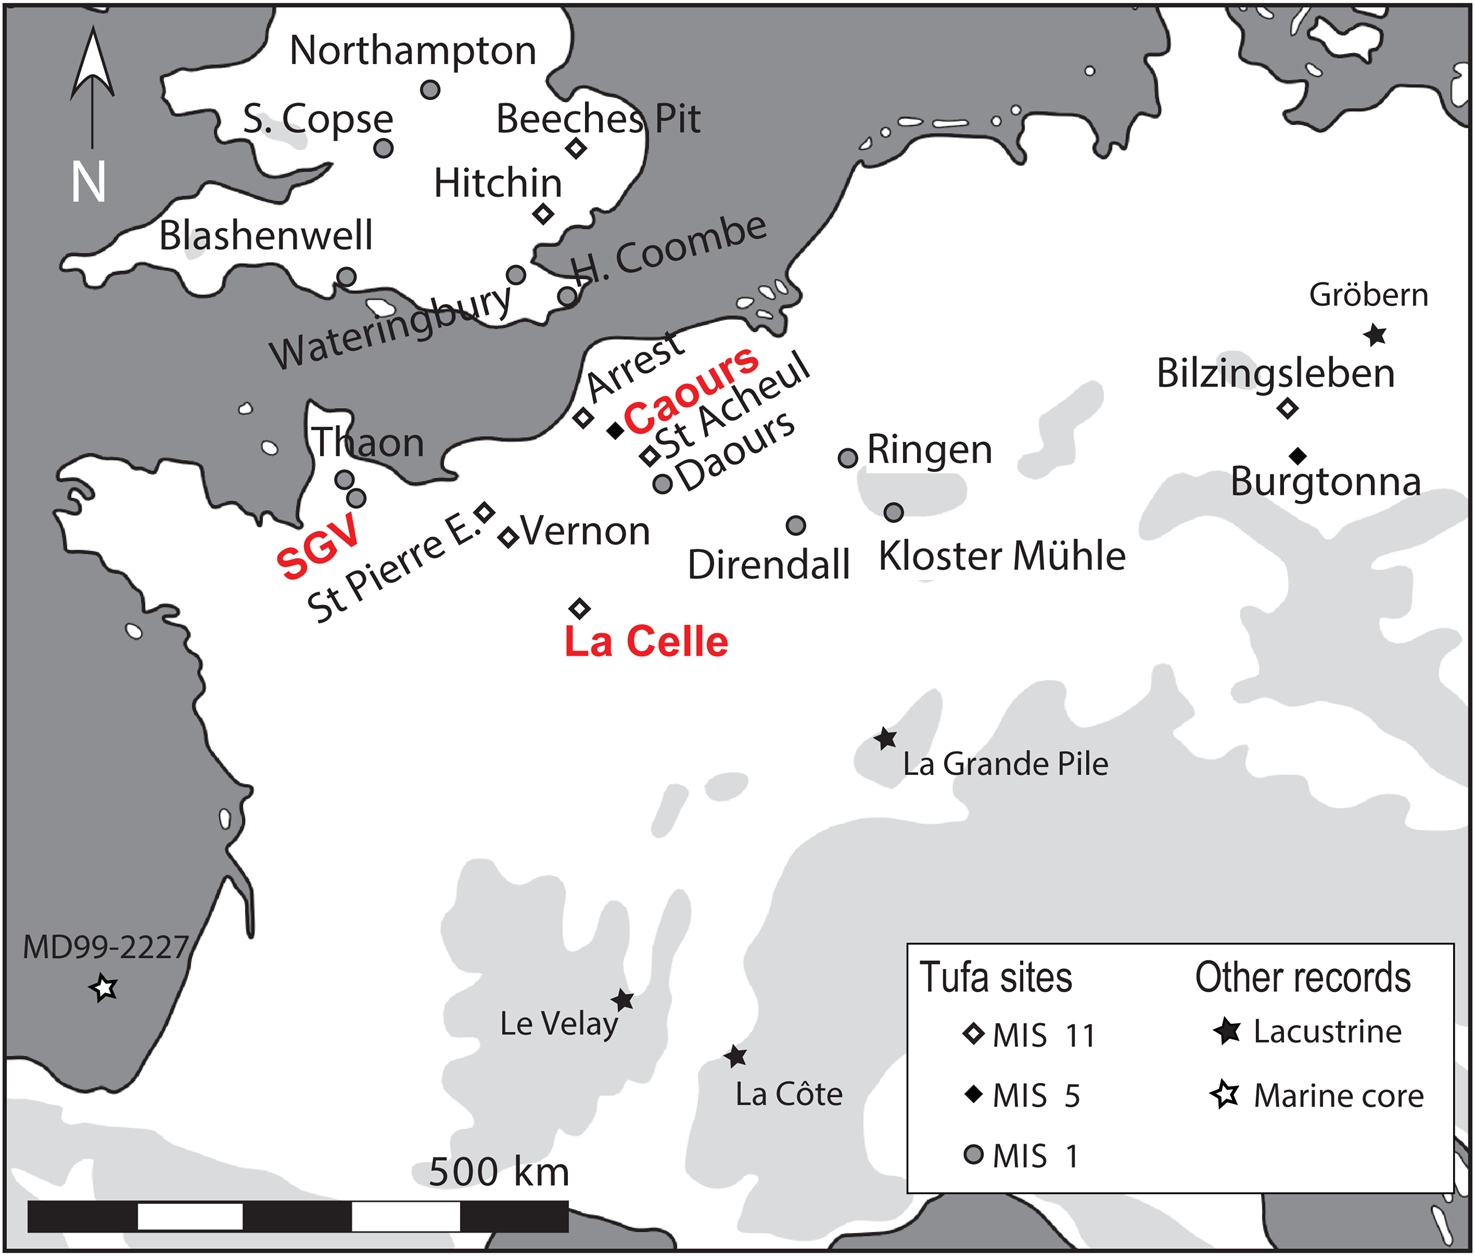
The three sites included in this study are located in the Paris Basin (Fig. 1), which corresponds with most of the northern half of France and is surrounded by the Armorican massif (west), the Massif Central (south), and Vosges and Ardennes (east and northeast). The Paris Basin comprises mainly post-Triassic carbonate formations (Pomerol, Reference Pomerol and Debelmas1974) that extend north to the London Basin in England. This calcareous bedrock provides calcium (Ca2+) and bicarbonate (HCO3−) ions that are dissolved and transported by groundwater to springs and rivers where they can precipitate as tufa calcite (CaCO3). The most important aquifer in the Paris Basin is the porous Upper Cretaceous chalk, with numerous secondary and tributary aquifers.
Location map of Saint-Germain-le-Vasson (SGV), Caours, and La Celle (in red) and other tufa sequences and interglacial European records discussed in this paper.
Modern meteorological data are from Météo-France stations near the studied sites (Caen, Abbeville, and Melun stations; Table 1). The average annual temperatures are around 11°C at all sites, with seasonal average temperatures around 5°C–6°C in winter (January to March) and 17–18°C in summer (July to September). Average annual precipitation ranges from 676.8 mm at Melun (near La Celle) to 782.6 mm at Abbeville (near Caours). At all sites, precipitation occurs evenly across the year. Saint-Germain-le-Vasson, Caours, and La Celle therefore currently experience similar weather patterns typical of a temperate oceanic climate. Additionally, extrapolations from the Online Isotopes in Precipitation Calculator (Bowen and Revenaugh, Reference Bowen and Revenaugh2003; Bowen, Reference Bowen2020) provide very similar mean annual δ18O values for modern precipitation, around −7.7‰ at each site (Table 2). This confirms that modern rainfall at Saint-Germain-le-Vasson, Caours, and La Celle has the same oceanic source and that there is virtually no continental effect (decrease in the oxygen isotopic values due to the rainout effect throughout the continent; Andrews, Reference Andrews2006) observed from the westernmost site, Saint-Germain-le-Vasson, to the easternmost, La Celle.
Modern climatic data recorded at Météo-France meteorological stations near the studied sites (data from 1981 to 2010).

Site coordinates and elevation.

1 Mean annual extrapolated δ18O of modern precipitation extrapolated at the site locations using the Online Isotopes in Precipitation Calculator (Bowen, Reference Bowen2020).
Two Pleistocene sites
Caours
The tufa sequence at Caours, near Abbeville in the Somme basin (Fig. 1, Table 2), covers a surface of several thousand square metres at the confluence of the Scardon and Drucat streams, with an average thickness of 3 to 4 m (Fig. 2). This tufa was mainly formed on the valley slope, fed by perched springs emerging from the Upper Cretaceous chalk, the largest aquifer in the Paris Basin, which provides carbonate to calcite precipitation.
Overview of stratigraphic and isotopic data from previous investigations at Caours: (A) Long transect along the slope made by combining observations from several boreholes, cores, and stratigraphic sections and showing the fluvial terrasse (gravel and silts) underlying the chalk, the tufa deposit, and posterior slope deposits (modified after Antoine et al., Reference Antoine, Limondin Lozouet, Auguste, Locht, Ghaleb, Reyss and Escudé2006), as well as the position of the sampling column. (B) Details of the stratigraphy of the “East profile 2007” at the sampling column position and a summary of palaeoclimatic (tufa calcite δ18O and δ13C) and palaeoenvironmental information (modified after Dabkowski et al., Reference Dabkowski, Limondin-Lozouet, Andrews, Marca-Bell and Antoine2016).
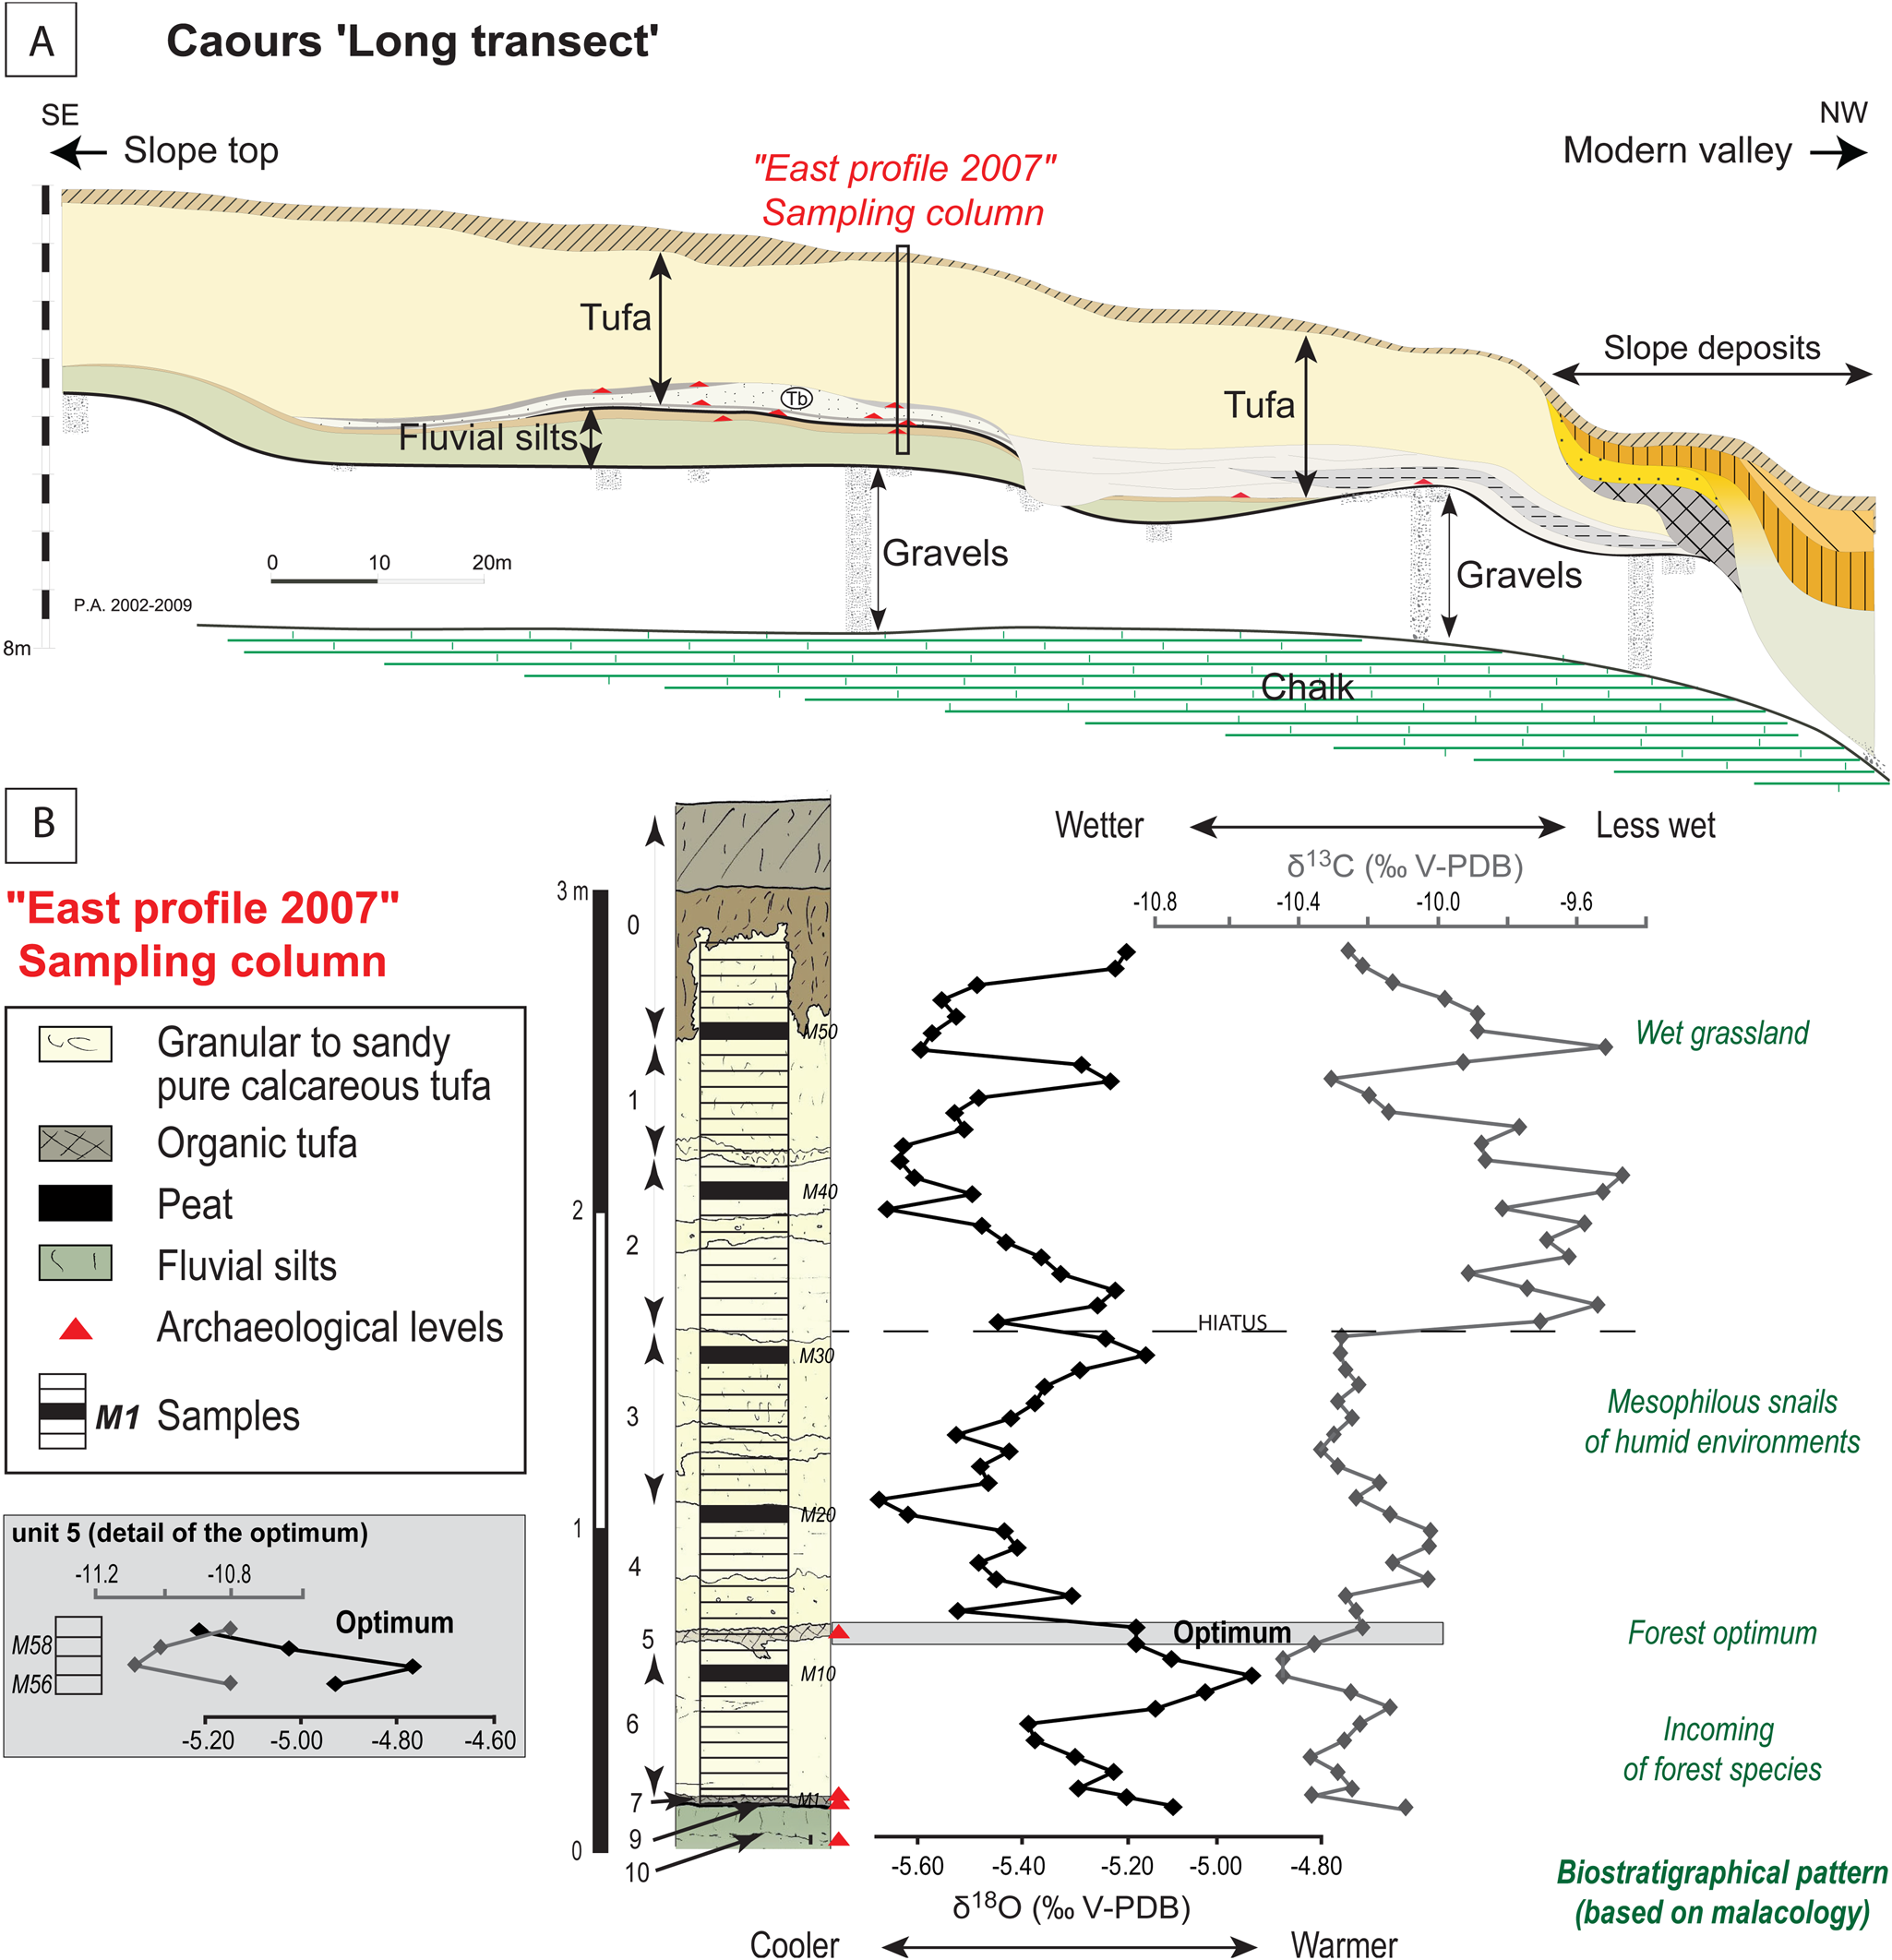
Since 2003, interdisciplinary investigations at Caours have resulted in extended stratigraphic descriptions, dating, and palaeoenvironmental reconstructions (Antoine et al., Reference Antoine, Limondin Lozouet, Auguste, Locht, Ghaleb, Reyss and Escudé2006). The discovery of several Middle Palaeolithic levels, associated with abundant faunal remains and lithic artefacts, led to archaeological excavations (Locht et al., Reference Locht, Antoine, Auguste and Limondin-Lozouet2009, Reference Locht, Dabkowski, Antoine, Auguste, Sévêque, Moreau, Vialet and Bertrand2017). Caours tufa overlies alluvial deposits of the Etouvie Formation (Fig. 2), which is assigned to MIS 6 (Saalian) in the well-known Somme valley terrace system (Antoine et al., Reference Antoine, Limondin Lozouet, Chaussé, Lautridou, Pastre, Auguste, Bahain, Falguères and Galehb2007). According to malacological data, the transition between the cold Saalian and the Eemian interglacial (MIS 5e) is recorded at the base of the sequence in the fluvial silty deposits preceding the tufa (Antoine et al., Reference Antoine, Limondin Lozouet, Auguste, Locht, Ghaleb, Reyss and Escudé2006). The chronostratigraphic attribution of the sequence to the Eemian interglacial was largely confirmed by geochronological data (U-series on calcite, optically stimulated luminescence on quartz grains, and Electron Spin Resonance (ESR)/U-series on tooth), giving an average age of 123 ± 3 ka (Antoine et al., Reference Antoine, Limondin Lozouet, Auguste, Locht, Ghaleb, Reyss and Escudé2006; Bahain et al., Reference Bahain, Falguères, Dolo, Antoine, Auguste, Limondin-Lozouet, Locht, Tuffreau, Tissoux and Farkh2010; Sier et al., Reference Sier, Parés, Antoine, Locht, Dekkers, Limondin-Lozouet and Roebroeks2015). Mammal fauna remains preserved in the archaeological levels allow the reconstruction of environments at the time of human occupations and strengthen the continuous record of the environment evolution at Caours based on the malacological succession (Antoine et al., Reference Antoine, Limondin Lozouet, Auguste, Locht, Ghaleb, Reyss and Escudé2006; Locht et al., Reference Locht, Antoine, Auguste and Limondin-Lozouet2009). The latter shows a clear forest maximum that has been demonstrated to be contemporaneous with the MIS 5e optimum through comparison with previously published palaeoclimatic reconstructions from stable isotopes on tufa calcite (Dabkowski et al., Reference Dabkowski, Limondin-Lozouet, Antoine, Marca-Bell and Andrews2011, Reference Dabkowski, Limondin-Lozouet, Andrews, Marca-Bell and Antoine2016; Fig. 2).
La Celle
La-Celle-sur-Seine (town of Vernou-La-Celle-sur-Seine) is located in the Seine valley, near Moret-sur-Loing (Seine-et-Marne; Fig. 1, Table 2). The tufa developed on the right-hand side of the Seine valley, 2.5 km upstream from its confluence with the Loing River. It was formed from springs located upslope and accumulated as an 8- to 15-m-thick body covering an area of ca. 12.5 ha. In its lower part, the tufa lies on the fluvial deposits of a middle terrace of the Seine (Fig. 3), about 15 m above the modern alluvial plain: its upper part directly overlies the Upper Eocene Calcaire de Champigny (Limondin-Lozouet et al., Reference Limondin-Lozouet, Nicoud, Antoine, Auguste, Bahain, Dabkowski and Dupéron2010). This calcareous bedrock is part of the multilayered Champigny aquifer, which comprises different Eocene deposits from the Calcaires de Brie to the Lutetian limestone (Paris stone), above the Upper Cretaceous chalk. The Champigny aquifer was the source of the carbonates feeding La Celle tufa precipitation.
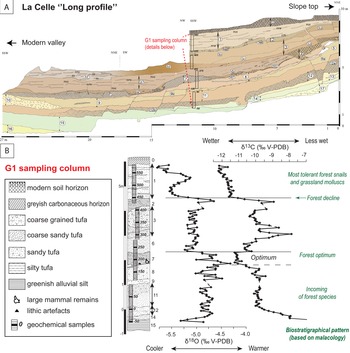
Overview of stratigraphic and isotopic data from previous investigations at La Celle: (A) Drawing of the long profile showing sandy to silty fluvial deposits (units 16–14) underlying the Champigny limestone (unit 17), the tufa deposit (units 13–1), and the position of the sampling column. (B) Details of the stratigraphy at the sampling column position and a summary of palaeoclimatic (tufa calcite δ18O and δ13C) and palaeoenvironmental information (modified after Limondin-Lozouet et al., Reference Limondin-Lozouet, Nicoud, Antoine, Auguste, Bahain, Dabkowski and Dupéron2010; Dabkowski et al., Reference Dabkowski, Limondin-Lozouet, Antoine, Andrews, Marca-Bell and Robert2012).

New investigations undertaken at La Celle since 2003 combine stratigraphy, palaeontology, dating, and archaeology (Limondin-Lozouet et al., Reference Limondin-Lozouet, Antoine, Auguste, Bahain, Carbonel and Chaussé2006, 2010; Jolly-Saad et al., Reference Jolly-Saad, Dupéron-Laudoueneix and Dupéron2007). The chronological attribution of the tufa to MIS 11 based on its morphological position within the Seine valley terrace system (Lautridou et al., Reference Lautridou, Auffret, Baltzer, Clet, Lécolle, Lefebvre and Lericolais1999) was reinforced by new palaeontological evidence (occurrence of the malacological “Lyrodiscus assemblage”) and several radiometric dates (U/Th thermal ionization mass spectrometry on calcite and ESR-U/Th on tooth enamel) suggesting an age around 400 ka (Bahain et al., Reference Bahain, Falguères, Dolo, Antoine, Auguste, Limondin-Lozouet, Locht, Tuffreau, Tissoux and Farkh2010; Limondin-Lozouet et al., Reference Limondin-Lozouet, Dabkowski and Antoine2020). The malacological succession allowed detailed palaeoenvironmental reconstruction showing the progressive development of forest biotopes with a clear maximum correlated to the MIS 11 climatic optimum (Fig. 3), as shown by comparison with palaeoclimatic reconstructions from stable isotopes on tufa calcite (Dabkowski et al., Reference Dabkowski, Limondin-Lozouet, Antoine, Marca-Bell and Andrews2011, Reference Dabkowski, Limondin-Lozouet, Antoine, Andrews, Marca-Bell and Robert2012; Limondin-Lozouet et al., Reference Limondin-Lozouet, Dabkowski and Antoine2020). The identification of temperate conditions is reinforced by the occurrence of leaf and fruit prints of Mediterranean taxa (e.g., Buxus, Ficus; Jolly-Saad et al., Reference Jolly-Saad, Dupéron-Laudoueneix and Dupéron2007) as well as by records of several thermophilous mammal taxa, including Hippopotamus and Macaca (Limondin-Lozouet et al., Reference Limondin-Lozouet, Antoine, Auguste, Bahain, Carbonel and Chaussé2006). The latter were found associated with Acheulean lithic artefacts that demonstrate human occupation of the site during the climatic optimum (Limondin-Lozouet et al., Reference Limondin-Lozouet, Nicoud, Antoine, Auguste, Bahain, Dabkowski and Dupéron2010).
A Holocene site: Saint-Germain-le-Vasson
Saint-Germain-le-Vasson (SGV) is located in Normandy about 15 km south of Caen (Fig. 1, Table 2). The tufa is developed on a platform, less than 500 m from the head of a small dry valley, leading to the right bank of the Laize River. At certain times of the year, water flows from a spring in the lower part of this small valley, but the fossil tufa is now dry, located 200 m east of the present spring and about 10 m higher. The source of the carbonate was probably the Calcaire de Caen, which crops out about 1 km southeast of the site (Limondin-Lozouet and Preece, Reference Limondin-Lozouet and Preece2004). This Middle Jurassic formation constitutes a tributary aquifer fed by the Upper Cretaceous chalk aquifer (Pomerol, Reference Pomerol and Debelmas1974; Rodet, Reference Rodet2007).
In the early 2000s, new investigations at SGV provided a stratigraphic description of the 9.5-m-high tufa deposit and detailed palaeoenvironmental reconstructions (Limondin-Lozouet and Preece, Reference Limondin-Lozouet and Preece2004; Limondin-Lozouet et al., Reference Limondin-Lozouet, Gauthier and Preece2005). Seven radiocarbon dates (on charcoal, mollusc shells, and wood) provided a coherent chronology that assigns the SGV tufa to the first half of the Holocene, between 9700 ± 90 and 4213 ± 77 14C yr BP, while malacological and palynological data confirm the full record of the Atlantic climatic optimum in the sequence (Limondin-Lozouet et al., Reference Limondin-Lozouet, Gauthier and Preece2005).
OVERVIEW OF FORMER ISOTOPIC DATA FROM THE PLEISTOCENE SITES
Caours and La Celle geochemical data have been previously published and extensively discussed as records of intra-interglacial climate variations during MIS 5e and 11, respectively (Dabkowski et al., Reference Dabkowski, Limondin-Lozouet, Antoine, Marca-Bell and Andrews2011, Reference Dabkowski, Limondin-Lozouet, Antoine, Andrews, Marca-Bell and Robert2012, Reference Dabkowski, Limondin-Lozouet, Andrews, Marca-Bell and Antoine2016). This section presents a brief overview of the former stable isotope investigations, including information useful for the following comparison with unpublished Holocene data from SGV (see “New Stable Isotope Data at Saint-Germain-Le-Vasson” and “Discussion”), also shown on Figures 2–4 and in Tables 3 and 4.
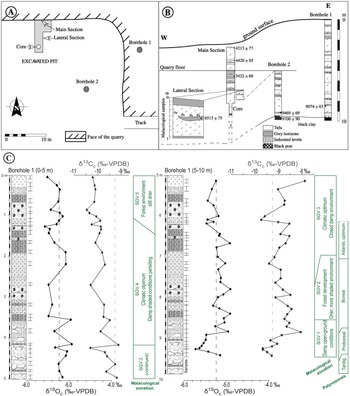
Overview of previous investigation at Saint-Germain-le-Vasson (SGV) and unpublished geochemical data: (A) Map of the tufa quarry at SGV showing the position of the different boreholes and stratigraphic sections. (B) Stratigraphic correlations of the profiles studied showing the development of the tufa deposits over nearly 10 m (modified after Limondin-Lozouet and Preece, Reference Limondin-Lozouet and Preece2004). (C) Detail of the highest stratigraphic profile (Borehole 1), position of the geochemical samples, and summaries of palaeoenvironmental (after Limondin-Lozouet et al., Reference Limondin-Lozouet, Gauthier and Preece2005) and palaeoclimatic (tufa calcite δ18O and δ13C) information.

Summaries of stable isotope data from the three tufa sequences discussed in this paper.

Summaries of stable isotope data from the climatic optima at Caours and La Celle.

Both Caours and La Celle sequences were sampled by hand continuously, every 5 cm, with the exception of some coarser layers at La Celle that could not be sampled properly (as units 2 and 9 mainly comprise large reworked tufa blocks; Fig. 3). Sample columns were placed where most of the stratigraphic units are present in order to cover the longest possible time interval (Figs. 2 and 3). A total of 59 and 117 samples were analysed at Caours and La Celle, respectively. Measurement of oxygen and carbon isotopic ratios was performed at the Stable Isotope Laboratory of the University of East Anglia (UK) using the same protocol described later for SGV; replicate analyses of the laboratory standard (n = 75) gave 2σ precision of ±0.09‰ for δ18O and ±0.3‰ for the δ13C. The stable isotope results for Caours range from −5.21 to −4.76 ± 0.09‰ for δ18O (mean value: −5.35 ± 0.09‰; n = 59) and from −11.1 to −10.8 ± 0.3‰ for δ13C (mean value: −10.1 ± 0.3‰; n = 59; Table 3). At La Celle, the δ18O values range between −5.79 and −4.32 ± 0.09‰ (mean value: −5.00 ± 0.09‰) and δ13C values between −12.1 and −7.9 ± 0.3‰ (mean value: −10.1 ± 0.3‰, n = 116; Table 3).
The MIS 5e climatic optimum was clearly identified at Caours in stratigraphic unit 5 by a maximum diversity of molluscs (including the widest range of forest species; Antoine et al., Reference Antoine, Limondin Lozouet, Auguste, Locht, Ghaleb, Reyss and Escudé2006) contemporaneous with maximal temperature and humidity conditions recorded by geochemical proxies (Dabkowski et al., Reference Dabkowski, Limondin-Lozouet, Andrews, Marca-Bell and Antoine2016; Fig. 2). Summaries of δ18O and δ13C data attributed to this climatic optimum are presented in Table 4 (n = 4). They range respectively from −5.21 to −4.76 ± 0.09‰ and from −11.1 to −10.8 ± 0.3‰.
At La Celle, a maximum in diversity and number of forest species, correlated with wetter and warmer conditions, is similarly observed in stratigraphic unit 7 and has been assigned to the MIS 11 climatic optimum (Dabkowski et al., Reference Dabkowski, Limondin-Lozouet, Antoine, Andrews, Marca-Bell and Robert2012; Limondin-Lozouet et al., Reference Limondin-Lozouet, Dabkowski and Antoine2020; Fig. 3). Summaries of stable isotope data from this optimum are presented in Table 4 (n = 12). δ18O values range from −5.01 to −4.32 ± 0.09‰ and δ13C values from −11.2 to −10.5 ± 0.3‰.
At La Celle, the uppermost unit (unit 1) also stands out from the rest of the sequence, as it records specific, cooler and wetter, climatic conditions associated with molluscan assemblages characterised by more tolerant forest species and grassland molluscs (unit 1; Fig. 3). This forest regression observed at the transition between units 1 and 2 (Fig. 3) could correspond either to the final phase of the deciduous forest or to the last development of the boreal humid forest at the very end of the interglacial period (Limondin-Lozouet et al., Reference Limondin-Lozouet, Dabkowski and Antoine2020).
NEW STABLE ISOTOPE DATA AT SAINT-GERMAIN-LE-VASSON
Methods
At SGV, the tufa sequence was regularly sampled by hand according to stratigraphy, except for the most indurate units, with maximal thickness of 10 cm for each sample. Sixty-two samples were analysed for carbon and oxygen stable isotope composition, covering the whole tufa sequence in the most complete profile (Borehole 1), up to −946 cm of relative depth from the top (Fig. 4).
As at Caours and La Celle, approximately 1 g of each field-collected sample was sifted to 250 μm, and the fine fraction was cleaned of volatile organic matter by low temperature (< 80°C) oxygen plasma etching for 6 h at 300 W forward power in a Bio-Rad PT 7300 plasma barrel etcher. Subsamples of 100 ± 10 μg of plasma-ashed tufa were then reacted with anhydrous H3PO4 at 90°C, and isotopic ratios of the resulting CO2 were measured on a Europa Sigma Hybrid with an in-house autosampler at the Stable Isotope Laboratory of the University of East Anglia. Sixty-nine replicate analyses of the laboratory standard gave 2σ precisions of ±0.2‰ for δ18O and ±0.5‰ for δ13C.
Results
Isotopic data from Saint-Germain-le-Vasson range between −5.7 and −4.9 ± 0.2‰ for δ18O (mean value: −5.3 ± 0.2‰; n = 62) and between −10.5 and −7.9 ± 0.5‰ for δ13C (mean value: −9.3 ± 0.5‰; Table 3). Most of the observed variation in both δ18O and δ13C is small compared with the confidence intervals (Table 3). Consequently, the climatic optimum could not be clearly defined at SGV: molluscs record shaded damp environments characteristic of a dense forest development in a large part of the sequence, and malacological zones are not correlated with any specific events in the stable isotope record that show little or no variation (Fig. 4). A few palynological samples provide assemblages characteristic of the Atlantic, but they are discontinuous (as pollen is only preserved in the most organic layers, which are rare; Limondin-Lozouet et al., Reference Limondin-Lozouet, Gauthier and Preece2005; Fig. 4) and do not allow proper delimitation of this period within the sequence, as is the case at Caours and La Celle.
INTERSITE COMPARISONS
When compared with data from other well-dated Late Quaternary (mainly Holocene) European tufas (Andrews, Reference Andrews2006), SGV results appear consistent with those from Belgium and the United Kingdom (Fig. 5). They are thus typical of temperate latitudes where soil contribution to δ13C is predominant, as soils and vegetation are well developed. These observations strengthen the position of SGV as a reference for the Holocene in the Paris Basin.
Distribution of isotopic data from Saint-Germain-le-Vasson (SGV), Caours, and La Celle (this paper) compared with other well-dated Late Quaternary (mainly Holocene) European tufa deposits (modified after Andrews, Reference Andrews2006).

Similarly, isotopic values from Caours and La Celle have means and ranges consistent with those from Late Quaternary temperate tufas from northwestern Europe where continentality and aridity/evaporation effects are low (Andrews, Reference Andrews2006; Fig. 5). This suggests that the three sites were part of similar climatic zones despite their age disparity. This assumption is strengthened by our previous comments on the modern weather patterns and rainfall δ18O values at each site (Tables 1 and 2), showing that SGV, Caours, and La Celle are part of the same temperate oceanic climate zone in the present.
Caours/SGV
Isotopic data from Caours (MIS 5e) and SGV (first half of the Holocene) are plotted together in Figure 6. Two-tailed Student's t-tests on unpaired data gave p-values lower than the 0.05 limit; Caours and SGV are therefore statistically different regarding both δ18O and δ13C values, although their respective means are similar according to confidence intervals (Table 3).
Combined δ18O and δ13C values for Caours and Saint-Germain-le-Vasson (SGV).

In detail, the δ18O values from Caours optimum appear slightly higher (−4.98 ± 0.09‰; Table 4) than those from the entire sequences of Caours and SGV (−5.35 ± 0.09‰ and −5.3 ± 0.2‰, respectively; Table 3). However, they range from −5.21 to −4.76 ± 0.09‰ (Table 4), which partly covers the whole sequence and SGV δ18O variability (Fig. 6, Table 3). About a third of the SGV δ18O range (37%, represented by 26 of 62 samples) actually overlaps with Caours optimum δ18O data (Fig. 6).
Caours δ13C values clearly present a narrow range compared with those from SGV (Fig. 6), as shown by their respective standard deviations (0.6 at SGV vs. 0.3 at Caours; Table 3). All carbon isotopic values for Caours are actually lower than the SGV δ13C mean value (−9.3 ± 0.5‰). Both with respect to their mean value (−10.9 ± 0.3‰) and range (−11.1 to −10.8; Table 4), Caours optimum δ13C values appear lower than those from the rest of the sequence and from SGV (Fig. 6).
La Celle/SGV
Isotopic data from La Celle (MIS 11) and SGV are plotted together on Figure 7. Two-tailed Student's t-tests on unpaired data gave p-values below the 0.05 threshold, suggesting that both δ18O and δ13C values are statistically different between La Celle and SGV. It may be noted that the same tests performed on the Caours and La Celle data also gave a p-value lower than 0.05 for δ18O but p = 0.6 for δ13C, suggesting that there is no statistical difference in the carbon isotope variability of the Pleistocene sites.
Combined δ18O and δ13C values for La Celle and Saint-Germain-le-Vasson (SGV).

La Celle and SGV show close δ18O mean values with respect to confidence intervals (−5.00 ± 0.09‰ and −5.3 ± 0.2‰, respectively; Table 3) but oxygen isotope values from La Celle have a wider range (resulting in a higher standard deviation: σ = 0.3), especially toward higher values (up to −4.32 ± 0.09‰ compared with a −4.9 ± 0.2‰ maximum at SGV; Fig. 7, Table 3). The climatic optimum at La Celle is recorded by a notably higher mean δ18O value than at SGV (−4.65 ± 0.09‰ and −5.3 ± 0.2‰, respectively; Tables 3 and 4). Additionally, the δ18O values of the La Celle optimum are higher than all SGV values; only 1 of the 12 values assigned to La Celle optimum is actually within the δ18O range of SGV (Fig. 7).
Mean carbon isotope values from SGV and La Celle are similar (−9.9 ± 0.5‰ and −10.1 ± 0.3‰, respectively; Table 3). However, the δ13C values recorded at La Celle are far lower than those from SGV (down to −12.1 ± 0.3‰ compared with the SGV minimum of −10.5 ± 0.5‰; Table 3). Most of the lowest δ13C values from La Celle are actually recorded in the same stratigraphic unit of the sequence (wet and cooler episode in unit 1; Fig. 3), associated with relatively high δ18O values (Fig. 7). The La Celle climatic optimum also exhibits more negative δ13C values than the rest of the sequence and SGV, having a lower mean value (−11.0 ± 0.3‰; Table 4). Additionally, the La Celle range of δ13C values (−11.2 to −10.5 ± 0.3‰; Table 4) does not overlap with the SGV range of δ13C values (−10.5 to −7.9 ± 0.5‰; Fig. 4, Table 3). When these two specific clusters of data (from the climatic optimum and from unit 1) are excluded, the La Celle δ13C values appear similar to those from SGV (Fig. 7).
DISCUSSION: INTERGLACIAL INTENSITIES IN THE PARIS BASIN
Climatic parameters influencing stable isotopes in modern and Quaternary tufas in Europe have been well identified (Andrews et al., Reference Andrews, Riding and Dennis1997; Andrews, Reference Andrews2006; Dabkowski et al., Reference Dabkowski, Limondin-Lozouet, Antoine, Marca-Bell and Andrews2011). Tufa calcite δ18O is directly linked to local airmass composition, which depends mainly on its source, rainout effects due to continentality or processes such as the amount effect, and changes in the atmospheric temperature (Andrews et al., Reference Andrews, Riding and Dennis1993, 1997). As noted earlier, the three studied sites are part of the same climatic area (i.e., under the influence of the same airmass), and no continental effect is observed in the present-day rainfall δ18O. Furthermore, under oceanic climate, precipitation occurs evenly across the year as currently recorded at meteorological stations near the studied sites, while isotopically anomalous rainfall events are unlikely to be recorded in well-mixed groundwater because of long-term homogenisation within most, and especially large, aquifers (Darling, Reference Darling2004), like the chalk and limestones of the Paris Basin. In addition, the three studied tufas, formed in close proximity to the springs, are unlikely to have been affected by processes such as evaporation. Consequently, the differences in the δ18O of studied sites must reflect differences in atmospheric temperature: higher δ18O values corresponding to warmer conditions (Andrews, Reference Andrews2006). On the other hand, tufa calcite δ13C is influenced by biomass type/abundance and rainfall amount (i.e., moisture availability), which control the relative contribution of two distinct sources of carbonate into the precipitating water. Under wetter conditions, well-developed vegetation and soils provide low δ13C, while increasing rainfall leads to shorter groundwater residence time within the aquifer and, in turn lower dissolution of the marine carbonate with typical higher δ13C: increasing moisture availability thus results in lower δ13C (Andrews, Reference Andrews2006).
MIS 5e versus the Holocene
The comparison of isotopic data from Caours and SGV suggests that MIS 5e did not experience different temperature conditions than the first half of the Holocene (including the Atlantic optimum), although its optimum would have known slightly warmer conditions (higher δ18O values; Fig. 6). On the other hand, the discrepancies observed in carbon isotope data suggest: (1) that MIS 5e had moisture conditions similar to the wettest conditions recorded during the first half of the Holocene, but with apparently smaller amplitudes of variations; and (2) that the MIS 5e climatic optimum was wetter than the first half of the Holocene (including the Atlantic optimum). However, parallel analyses of Mg/Ca and Sr/Ca ratios in calcite, which are mainly influenced in tufa by the amount of precipitation (Garnett et al., Reference Garnett, Andrews, Preece and Dennis2004), show that increasing moisture conditions at Caours was due more to vegetation/soil development than to strictly climatic (rainfall) variations (Dabkowski et al., Reference Dabkowski, Limondin-Lozouet, Andrews, Marca-Bell and Antoine2016).
At Caours, the malacological faunal list is clearly characteristic of an interglacial and includes several forest species originating from central Europe and that are thus beyond their modern range (Limondin-Lozouet and Preece, Reference Limondin-Lozouet and Preece2014). However, no specific species or biome suggests that environmental/climatic conditions were significantly warmer or wetter than during the Holocene (Antoine et al., Reference Antoine, Limondin Lozouet, Auguste, Locht, Ghaleb, Reyss and Escudé2006; Limondin-Lozouet, Reference Limondin-Lozouet2011). Large mammal remains preserved in archaeological levels at Caours mainly belong to red deer (Cervus elephus), fallow deer (Dama dama), and aurochs (Bos primigenius). Other large herbivores are also present but occur less frequently (Dicerorhinus hemitoechus, Equus sp., Capreolus capreolus, Sus scrofa), as do Ursus arctos and Aonyx antiqua. These species are characteristic of interglacial conditions during the middle Pleistocene and the beginning of the late Pleistocene (Antoine et al., Reference Antoine, Limondin Lozouet, Auguste, Locht, Ghaleb, Reyss and Escudé2006; Locht et al., Reference Locht, Antoine, Auguste and Limondin-Lozouet2009). None indicate particularly warm and wet conditions compared with the Holocene. These palaeoenvironmental data are thus consistent with our observations based on stable isotope comparisons.
In northwestern Europe, only a few continental records have provided long-term quantitative climate reconstructions for MIS 5e. The lacustrine sequence of La Grande Pile in the Vosges (Fig. 1) has been the reference record for the Paris Basin since the 1970s and has supported numerous palaeoenvironmental studies mainly based on pollen, chironomids, and Coleoptera (Woillard, Reference Woillard1978; de Beaulieu, Reference de Beaulieu1992; Ponel, Reference Ponel1995; Cheddadi et al., Reference Cheddadi, Mamakowa, Guiot, de Beaulieu, Reille, Andrieu, Granoszewski and Peyron1998). Coleoptera assemblages, and especially quantitative reconstructions of seasonal temperatures by the mutual climatic range method, suggest that the MIS 5e optimum at La Grande Pile was slightly warmer than today and possibly wetter (Ponel, Reference Ponel1995; Ponel et al., Reference Ponel, Orgeas, Samways, Andrieu-Ponel, de Beaulieu, Reille, Roche and Tatoni2003). More recently, reconstructions of annual and seasonal temperatures and precipitation combining pollen and organic matter δ13C data have been obtained from a new core covering part of MIS 5 (130–100 ka), including MIS 5e (Rousseau et al., Reference Rousseau, Hatté, Guiot, Duzer, Schevin and Kukla2006, Reference Rousseau, Hatté, Duzer, Schevin, Kukla, Guiot, Sirocko, Claussen, Sánchez Goñi and Litt2007). Despite two short cool events that might not be recorded at Caours due to sedimentary hiatuses (Dabkowski et al., Reference Dabkowski, Limondin-Lozouet, Andrews, Marca-Bell and Antoine2016), mean annual climatic conditions similar to those of the present day are recorded at La Grande Pile during the Eemian. However, the climatic optimum at La Grande Pile appears slightly warmer and is characterised by a significant increase in mean annual precipitation. These data are consistent with the similar temperature and moisture conditions recorded during MIS 5e at Caours compared with SGV data. In addition, the mean annual precipitation signal shows no particular trend or variation after the climatic optimum at La Grande Pile, which appears consistent with apparently stable conditions reflected by the low variability of the δ13C at Caours during MIS 5e (Fig. 2) compared with the Holocene (SGV; Fig. 4).
Farther east, at Gröbern in central Germany (Fig. 1), seasonal temperatures and mean annual precipitation during the Eemian were reconstructed using a multivariate probabilistic method on pollen and plant microfossil assemblages and indicate warmer conditions (especially during summer) than today and a relatively low level of mean annual precipitation (Kühl et al., Reference Kühl, Litt, Schölzel and Hense2007). However, this site is located in an area presently characterised by a strong continental climate, which may explain the discrepancies with our data from the Paris Basin. Different regional climatic responses to global variations during MIS 5e have indeed been suggested by the comparison of several terrestrial pollen sequences across western Europe (Sánchez Goñi et al., Reference Sánchez Goñi, Loutre, Crucifix, Peyron, Santos, Duprat, Malaizé, Turon and Peypouquet2005).
Regional quantitative climate reconstructions are also provided from a Bay of Biscay core (MD99-2227; Fig. 1) applying the modern analog technique to high-resolution pollen data: they indicate that the warmest period of the Eemian was significantly warmer than the present day in terms of temperatures of the warmest month (Sanchez Goni et al., Reference Sánchez Goñi, Bakker, Desprat, Carlson, Van Meerbeeck, Peyron and Naughton2012). These higher temperatures are contemporaneous with fast development of forest cover in Europe during the Eemian; the increase in temperate forest pollen percentages is twice as large and rapid at the onset of the Eemian compared with the Holocene. Such rapid development of forest environments would have significantly increased the contribution of soil and vegetation to tufa δ13C at Caours and may explain the low values recorded during the optimum compared with the rest of the sequence and with Holocene data from SGV (Fig. 6).
MIS 11 versus the Holocene
Comparison of δ18O variability of La Celle and SGV (Fig. 7) suggests that temperatures were similar to warmer during MIS 11 than during the first half of the Holocene. However, climatic conditions during the MIS 11 climatic optimum appear notably warmer compared with those during the first half of the Holocene (including the Atlantic optimum).
Regarding moisture availability, carbon isotopic data show that MIS 11 was mostly comparable to the first half of the Holocene, except during the climatic optimum and during the last phase recorded at La Celle (unit 1; Fig. 3), which both appear to have been wetter. The latter is also characterised by relatively cooler conditions (Fig. 7).
The strong consistency between the stable isotope variations and the malacological succession of La Celle has already been demonstrated in previous publications (Dabkowski et al., Reference Dabkowski, Limondin-Lozouet, Antoine, Marca-Bell and Andrews2011, Reference Dabkowski, Limondin-Lozouet, Antoine, Andrews, Marca-Bell and Robert2012). The La Celle molluscan record is characterised by the recognition of the “Lyrodiscus fauna,” which mainly comprises forest species, including taxa currently having central and southern European ranges (Rousseau et al., Reference Rousseau, Puisségur and Lécolle1992; Rousseau, Reference Rousseau, Droxler, Poore and Burckle2003; Limondin-Lozouet et al., Reference Limondin-Lozouet, Dabkowski and Antoine2020).
Palaeobotanical data, especially leaf and fruit prints of Buxus and Ficus, suggest warmer conditions at the time of La Celle tufa deposition (Limondin-Lozouet et al., Reference Limondin-Lozouet, Antoine, Auguste, Bahain, Carbonel and Chaussé2006; Jolly-Saad et al., Reference Jolly-Saad, Dupéron-Laudoueneix and Dupéron2007). Furthermore, the occurrences of Macaca sylvanus and Hippopotamus contemporaneous with the climatic optimum (Limondin-Lozouet et al., Reference Limondin-Lozouet, Antoine, Auguste, Bahain, Carbonel and Chaussé2006, 2010) indicate very temperate and wet conditions, respectively. All these palaeoenvironmental data strengthen the observations based on stable isotope comparison.
There are few continental records providing climatic reconstructions back to MIS 11 in western Europe. The closest to La Celle are lacustrine records in the French Massif Central (Le Velay) and in the Vercors (La Côte; Fig. 1), whose pollen assemblages suggest similar climatic conditions during MIS 11 and the Holocene (de Beaulieu et al., Reference de Beaulieu, Eicher and Monjuvent1994; Reille et al., Reference Reille, de Beaulieu, Svobodova, Andrieu-Ponel and Goeury2000). However, quantitative reconstructions based on Coleoptera from La Côte indicate that the MIS 11 climatic optimum was particularly warm (Field et al., Reference Field, de Beaulieu, Guiot and Ponel2000), as observed at La Celle. In a comparison of several MIS 11 continental records, especially from Europe, most indicate higher humidity than during the Holocene, but in temperature reconstructions, either similar or warmer conditions are reported across locations (Rousseau, Reference Rousseau, Droxler, Poore and Burckle2003).
CONCLUSIONS
In globally significant records (e.g., from marine and ice cores), MIS 5 and 11 are the strongest interglacials of the last 800 ka, marked by higher sea levels, reduced ice sheets, higher atmospheric CO2, and finally, higher temperatures (Lang and Wolff, Reference Lang and Wolff2011; Past Interglacials Working Group of PAGES, 2016). It is noteworthy that most Pleistocene tufa deposits known in western Europe and providing reliable palaeoenvironmental data are assigned to one of these two interglacials (Pentecost, Reference Pentecost1995; Limondin-Lozouet and Preece, Reference Limondin-Lozouet and Preece2014). Most exceptions occur in Thuringia (Germany), where partly fault-controlled cooled geothermal springs (i.e., partly independent of climatic conditions) fed massive tufa deposits (or “travitufa,” according to Capezzuoli et al. [Reference Capezzuoli, Gandin and Pedley2014]) also during MIS 7 and 9 (e.g., Ehrinsdorf [MIS 7] and a part of the Bilzingsleben deposit [MIS 9], which is however mainly assigned to MIS 11; Mania and Mania, Reference Mania and Mania2008). Tufa deposits have been shown to require temperate and, especially, wet climatic conditions (Pentecost, Reference Pentecost2005; Capezzuoli et al., Reference Capezzuoli, Gandin and Pedley2014), although they can start growing very quickly after the onset of such conditions, as demonstrated for the last climatic cycle by many late-glacial/Early Holocene tufas (Pentecost, Reference Pentecost1995; Dabkowski, Reference Dabkowski2020). Therefore, the most frequent occurrence of MIS 5e and 11 tufas suggests that, in Europe, these interglacials must have been stronger, in terms of temperature and/or moisture availability, than MIS 7 and 9.
As tufas provide favourable (calcareous) conditions for both the development and preservation of molluscan communities (Preece, Reference Preece1991), mollusc shells are usually well represented in quantity and quality within fossil deposits. Several European tufas have thus provided detailed assemblages comparable to those from Caours and La Celle (Fig. 8). As noted earlier, MIS 11, 5, and 1 are the best documented Pleistocene interglacials for malacological records from tufa deposits. During Pleistocene interglacials, the total number of land snails and of forest species systematically exceeds those observed during the Holocene (Limondin-Lozouet and Preece, Reference Limondin-Lozouet and Preece2014). Additionally, the highest malacological diversity is always recorded at MIS 11 sites (Fig. 8). In the studied area, the MIS 11 malacological assemblages include up to 41 species of forest molluscs, 50% of which are non-indigenous (out of range or extinct). Among these, a quarter are species originating from southern Europe. The occurrence of some strictly Mediterranean species during the optimum phase is a specificity of MIS 11 malacofaunas (Limondin-Lozouet et al., Reference Limondin-Lozouet, Dabkowski and Antoine2020). Such variations in molluscan diversity are likely related to differences in climatic parameters and in particular to higher moisture availability during MIS 5e and especially MIS 11 compared with the Holocene, which is consistent with our conclusions based on palaeoclimatic data from Caours, La Celle, and SGV. Unfortunately, few or no isotopic data are yet available from other Pleistocene tufas in Europe to further support these observations.
Number of forest land snails recorded in tufa deposits from Germany, France, and southern England (for site location, see Fig. 1).

Tufa stable isotopes therefore seem appropriate for comparing climatic conditions prevailing during the Holocene and Pleistocene interglacials, especially MIS 5 and MIS 11. Data from La Celle, Caours, and SGV suggest that in the Paris Basin:
• most of MIS 11, and especially its optimum, was wetter and warmer than the Holocene and MIS 5e;
• although weaker than MIS 11, MIS 5e experienced wetter conditions than the Holocene, especially during the optimum, but no clear difference is observed in terms of temperature, except for the climatic optimum that might have been slightly warmer during MIS 5e.
New investigations on recent and Pleistocene tufa deposits from France, Germany, England, and elsewhere in Europe should lead to a more complete record of differences and similarities between interglacials and would allow discussion of differences in interglacial climatic patterns at the European scale.
Acknowledgments
We thank both reviewers for their useful comments on the article. This paper is a contribution to the ANR project NEANDROOTS.