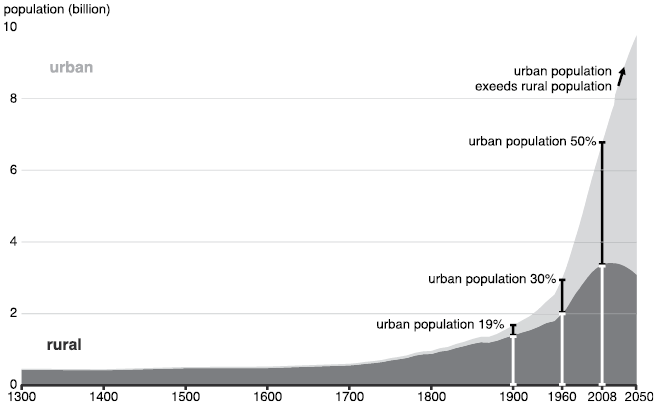
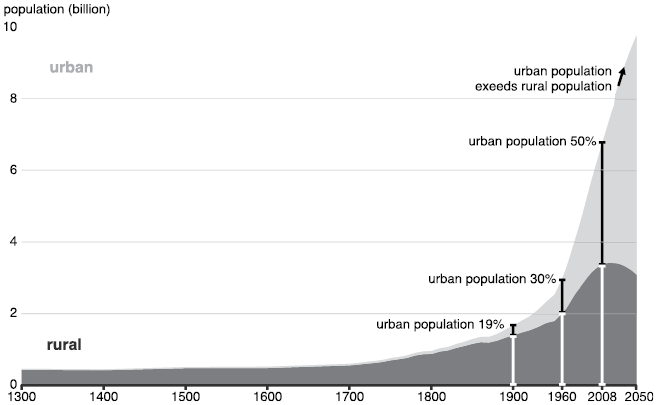
The proportion of the global population living in urban areas has increased at an unprecedented rate and scale since the early twentieth century, when only about 19% of people were urban dwellers and the rest lived in rural areas. Urban population share surpassed 30% around 1960, reached 50% by 2008, and rose to approximately 55% by 2020 (Figure 1.1). Projections indicate that by 2050, nearly 70% of the world’s population will reside in urban areas, excluding Europe and the Americas, where urbanization rates already exceeded 70% in the early twenty-first century (UN Habitat, 2022). This rapid and extensive urban growth has profound implications for the Earth system, influencing climate, ecosystems, resource use, and atmospheric composition on a global scale.
Most population growth in the years to come is expected in the urban areas.
In this chapter, we begin with the comprehensive exploration of urbanization and its dynamic feedback with global environmental change. The discussion opens with a critical examination of what defines an “urban” area, recognizing that definitions vary widely by region, discipline, and context. These definitions have important implications for how urban impacts are measured and understood. Building on this foundation, we then define the physical and biogeochemical processes that connect urban ecosystems with the Earth’s major subsystems: the biosphere, atmosphere, hydrosphere, and lithosphere. The Gaia hypothesis is presented and discussed in the context of the ongoing urbanization of Earth.
Urbanization alters energy balance, heat fluxes, and moisture exchanges, as well as disrupts natural cycles of carbon, nitrogen, and other chemical elements essential for life on Earth. These changes occur not only at the local and regional scales but also contribute to global-scale changes such as climate warming. By highlighting the role of these urban-environment feedback, this chapter underscores the importance of integrated, interdisciplinary approaches to understanding and managing the impacts of urbanization within the broader context of global environmental change.
1.1 What Is a City?
Over time, both the definition of a city and the mechanisms through which cities are established have evolved considerably, reflecting broader social, political, and economic shifts. In ancient Near Eastern cultures, where some of the earliest cities emerged, the founding of cities was often portrayed through political narratives and mythologies as acts of divine will or ideological projects. In his book Cities and the Shaping of Memory in the Ancient Near East, Ömür Harmansah (Reference Harmansah2013) says that such symbolic representations frequently obscured the complex social, economic, and political processes underlying urban development. During the Early Iron Age (ca. 1200–850 BC), imperial rulers and political elites of Assyria and Syro-Hittite States took quick decisions about the founding and building of cities and their locations rather than as cities being developed by ordinary people slowly over time. The city foundation was used to show off the power of the state and celebrated with festivals, ceremonies, and feasts. These events helped reshape how people saw their past. New cities included monuments and decorated stones like obelisks and stelae placed in public areas, which told stories about the state’s power and values. In addition, Ömür Harmansah (Reference Harmansah2013) explained that the city foundation project at that time was going well beyond physical construction of a city including the erection of monumental architecture. It was accompanied by a program including cultivation of surrounding landscapes with the engineering of large-scale irrigation watercourses, plantations, and the settlement or resettlement of population. These practices reinforced political authority and urban identity while shaping the physical and symbolic landscapes of early urbanization. Later, historical urbanization was often driven by geographic advantages, the convenience of trade routes, or colonial imperatives.
Mechanisms of city establishment in the modern era are truly multifaceted, and modern cities frequently emerge through strategic planning, state-led development initiatives, and global investment. The rise of special economic zones, smart cities, and new urban developments such as planned capitals or satellite cities illustrates how contemporary city-making is often driven by political agendas and transnational capital rather than gradual settlement patterns (Ehwi, Holmes, & Burgess, Reference Ehwi, Holmes and Burgess2024; Tang & Meng, Reference Tang, Meng, Bian, Tang and Shen2021).
Modern definitions of what constitutes a city are varied and increasingly nuanced. Today, they differ significantly across regions and countries. They can even evolve within a single nation over time. The availability of data and analytical tools also influences how cities are defined. Historically, these definitions relied primarily on socioeconomic data. However, the advent of remotely sensed data has enabled a more consistent global assessment of urban areas, particularly through the detection of impervious surface areas and dimensions of aboveground urban infrastructures. Contemporary definitions range from simple criteria such as population size or administrative boundaries to more sophisticated approaches that integrate multiple demographic, spatial, and economic indicators. Furthermore, terms like “city,” “urban area,” “metropolitan area,” and “urban agglomeration” are often used interchangeably, though they differ in the territorial scales they cover and the specific criteria they employ to define “urban.”
Amongst the most common criteria used are administrative or political boundaries, population size, or population density. These are often used as a single criterion to define “urban.” In addition, other urban characteristics, such as impervious area and economic function, for example, are used in the definition. The possible combinations include one of the most common criteria mentioned earlier, with other characteristics for urban area definition (Box 1.1).
Population size establishes a baseline number of people for the settlement to be considered more than a rural settlement. Typically, urban areas need a critical mass of population to sustain infrastructure, services, and businesses.
Population density indicates that the area has a high population concentration, characteristic of urban areas as opposed to sparsely populated rural regions.
Spatial expanse exceeding certain area ensures the area is sufficiently large geographically to support infrastructure, residential zones, and businesses, excluding very small or isolated communities.
Impervious surface area exceeding certain value shows that the area has a high concentration of impervious surfaces such as buildings, roads, and parking lots, which are characteristic of urban areas as opposed to sparsely built-up rural areas.
A considerable share of the population depends on non-primary economic activities refers to primary activities such as agriculture, mining, and fishing. A shift away from these indicates industrialization and diversification of the economy, such as services and manufacturing, typical for towns or cities.
Potential for future growth based on revenue indicates economic stability and growth potential, usually based on the area’s current revenue streams or economic activities, as well as suggests that the area could expand and develop further in the future.
A review of city definitions for 233 countries revealed that 104 countries used a single criterion, while 121 used a combination of those criteria with other factors (UN Habitat, 2020). In the rest, there was no clear definition of what constitutes an urban area. The population thresholds used in those definitions have a very wide range: from 200 to 50,000 inhabitants. The threshold of 200 inhabitants is typical for smaller countries like Iceland, with a country population of just above 370,000, or Denmark, with a population of almost 6 million. The Netherlands and Nigeria define a settlement as urban using the same threshold of 20,000 residents, even though the Netherlands’ population is an order of magnitude smaller than that of Nigeria: almost 18 million and 220 million, respectively. The higher threshold of 30,000 inhabitants is used in Mali, with the country’s population just below 23 million people.
For instance, two neighboring countries, India and Bhutan, use multi-criteria approaches to defining urban areas. Both countries use population size, population density, and the minimum share of population dependent on non-primary economic or agricultural activities as criteria in addition to other country-specific ones.
India, which is one of the most populated countries in the world, with almost 1.5 billion people, but only 36% living in cities (World Bank, 2024), defines an urban area based on the following criteria (Government of India, 2018):
all administrative units that have been defined by statute as urban, like Municipal Corporation, Municipality, Cantonment Board, and Notified Town Area Committee, are known as Statutory Town;
minimum population of 5,000 inhabitants;
population density of at least 400 persons per km2;
75% or above of the male main working population being engaged in nonagricultural pursuits.
Bhutan, with the country’s population of just below 800,000 and a 44% urban share (World Bank, 2024), uses a multi-criteria approach to define an urban area. A settlement is identified as a city if it satisfies at least four out of the following five conditions (UN Habitat, 2020):
minimum population of 1,500 inhabitants;
population density of at least 1,000 persons per km2;
more than 50% of the population depends on non-primary economic activities;
spatial expanse more than 1.5 km2;
potential for future growth based on revenue.
Interestingly, the threshold for the minimum population density in large India (400 people per km2) is lower than that in small Bhutan (1,000 people per km2), highlighting how national context shape the criteria used to define urban density.
To help urban planners, policymakers, international organizations, and researchers compare and analyze cities and their dynamics systematically, global cities can be grouped into six classes, which are based on their population counts. These six classes are described as follows:
1. megacities with a population of more than 10 million inhabitants;
2. large cities with a population between 5 and 10 million inhabitants;
3. mid-sized cities with a population between 1 and 5 million inhabitants;
4. cities with a population between 500,000 and 1 million inhabitants;
5. cities with a population between 300,000 and 500,000 inhabitants;
6. urban settlement with less than 300,000 inhabitants.
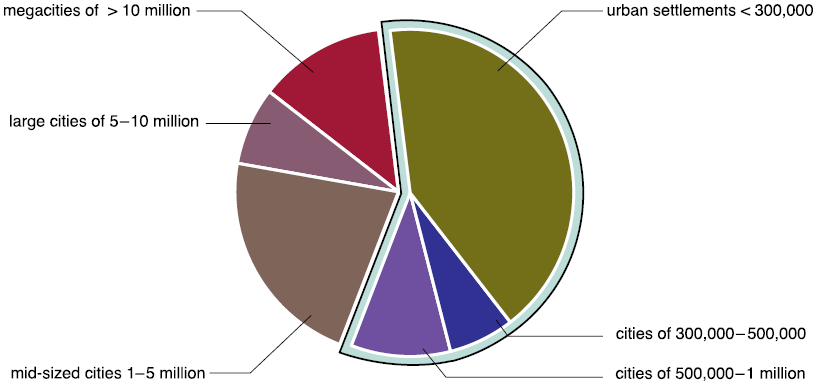
According to global analyses of urban populations in 2018, nearly 60% of city dwellers resided in cities whose populations were under 1 million, while the remaining 40% lived in mid-sized (1–5 million), large (5–10 million), and megacities (over 10 million) (Figure 1.2). This distribution is important for understanding urban dynamics because it suggests that smaller cities, often overlooked in policy debates, are home to most of the urban population. The city’s size distribution also interrelates with matters like infrastructure provision, economic opportunities, environmental impacts, and governance. For instance, small and mid-sized cities face challenges in scaling local services and attracting investment, while megacities concentrate on managing environmental risks and resource depletion.
The world’s urban population was categorized by the size class of settlements in 2018. Most urban dwellers worldwide live in cities with populations smaller than 1 million people (almost 60%). Only 13% of the world’s urban dwellers live in megacities.
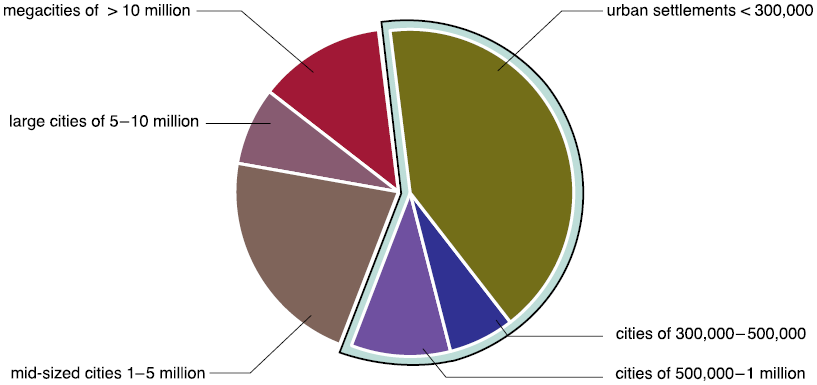
Figure 1.2 Long description
Size classes of urban settlements with the associated share of the world’s urban population: 13 percent live in megacities with more than 10 million inhabitants, 8 percent live in large cities with 5 to 10 million people, 22 percent live in mid-sized cities with 1 to 5 million inhabitants, 10 percent live in cities with a population between 500000 and 1 million, 6 percent live in cities with 300000 to 500000 people, and 41 percent live in urban settlements with less than 300000 inhabitants.
National definitions of cities discussed earlier rely on administrative or legal boundaries, which are rarely consistent between different countries, and make comparisons of cities in different countries and their activities challenging. Therefore, alternative definitions of urban areas have been developed. The advantage of such alternative definitions is that cities in different parts of the world can be consistently defined and their properties compared. For instance, two alternative definitions of cities based on their functional and physical boundaries are provided here.
To reflect the economic extent of a city, its functional boundaries are defined. The European Union and the Organization for Economic Co-operation and Development (OECD) developed a methodology defining functional urban boundaries in a consistent way (L. Dijkstra, Poelman, & Veneri, Reference Dijkstra, Poelman and Veneri2019) and introduced the term functional urban area (FUA), which includes a city and its commuting zone. The commuting zone is the city’s surroundings, which includes less populated areas while still being a part of the city’s labor market. Functional urban areas are used in Chapter 2, in the discussion of urban growth and shrinkage and Chapter 3 in the discussion of trade-offs between urban density and urban tree cover.
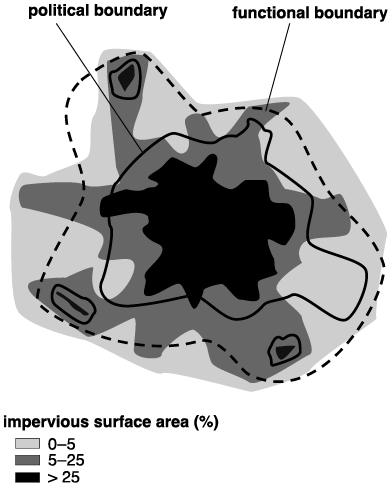
Physical boundaries of a city can be defined using its physical properties, such as the fraction of impervious surface area. Remotely sensed observations can be used to map impervious surfaces and, thereafter, delineate urban areas at the global, regional, or local scale (Schneider, Friedl, & Potere, Reference Schneider, Friedl and Potere2009). Estimates of the extent of urban areas produced with different methods rarely coincide, as they depends on varying definitions, data sources, and spatial criteria for what constitutes “urban”. (Figure 1.3).
Differences in the urban extent depending on the definition of the city’s boundaries.
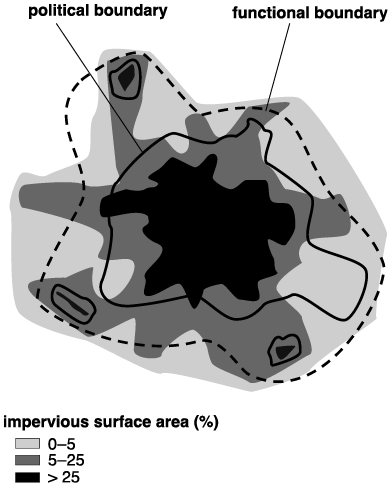
Figure 1.3 Long description
The functional boundary extends wider than the political boundary and encompasses a larger surrounding area. Shading indicates impervious surface area categorized as 0 to 5%, 5 to 25%, and greater than 25%. The darkest shading, representing more than 25% impervious surface area, is concentrated in the urban center, while areas with lower percentages extend outward toward the city's edges. Small isolated areas of high impervious surface are also shown beyond the central urban area.
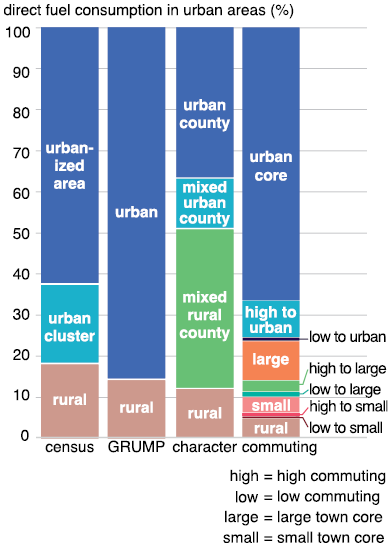
The definition of a city and its urban boundaries plays a critical role in measuring and analysis of urban environmental impacts. These definitions directly influence the attribution of urban pollution, resource demand and supply, and associated patterns of energy and material consumption. Inconsistent or arbitrary delineations can lead to substantial discrepancies in the attribution of environmental impacts to urban areas. For example, a study analyzing energy use and CO2 emissions across US urban areas found that estimates of direct fuel consumption in buildings and industry, as well as on-road gasoline and diesel use, could vary by a factor of 2 or more depending on how urban boundaries were defined (Figure 1.4; Parshall et al., Reference Parshall, Gurney, Hammer, Mendoza, Zhou and Geethakumar2010). This variation can significantly affect national and local carbon accounting and policy planning.
Percent of direct fuel consumption by buildings occurring in urban and rural areas from heating and cooling classified using different definitions of urban extent (Parshall et al., Reference Parshall, Gurney, Hammer, Mendoza, Zhou and Geethakumar2010). The US (census) delineates urban areas using the population density of census blocks. In the Global Rural-Urban Mapping Project (GRUMP), urban areas are classified primarily using the satellite observations of nighttime lights collected by the US Department of Defense.
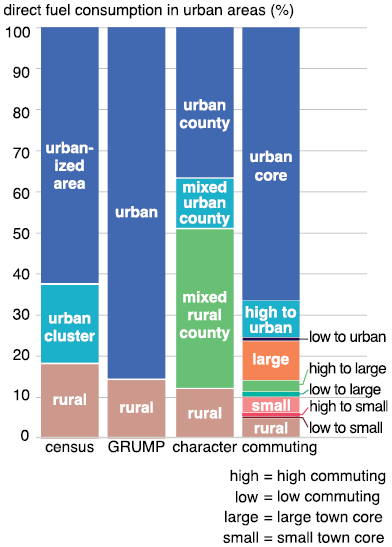
Figure 1.4 Long description
In the following section, the distribution for each definition is listed. The respective values for the share of fuel consumption are stated directly after the defined area. The US census distinguishes between rural areas 18 percent, urban clusters 19 percent and urbanized areas 63 percent. The Global Rural-Urban Mapping Project distinguishes only between rural areas 14 percent and urban areas 86 percent.
A definition of areas by character creates four categories: urban county 37 percent, mixed urban county 12 percent, mixed rural county 39 percent, and rural 12 percent.
Defining the areas by commuting creates a more finely split categorization in the less urbanized areas. The urban core itself has an associated fuel consumption of 67.6 percent. High commuting to the urban core 9 percent, low commuting to the urban core 0.7 percent. Fuel consumption in a large town core is 9.6 percent, high commuting to a large town core is 2.7 percent, and low commuting to a large town core is 1 percent. Fuel consumption in a small-town core is 3.7 percent; high commuting to a small-town core is 0.7 percent; low commuting to a small-town core is 0.3 percent, and fuel consumption in rural areas is 4.7 percent.
Even greater discrepancies were observed in a study assessing ecosystem carbon storage in Boston, Massachusetts, USA. Depending on the urban extent, which was defined by the US Census Bureau, GRUMP, or the Boston Metropolitan Statistical Area, soil carbon storage estimates in Boston varied 3.8-fold (ranging from 14.4–54.5 teragrams of carbon), while vegetation carbon storage differed by a factor of 6.5 (ranging from 4.2–27.3 teragrams of carbon; Raciti, Hutyra, Rao, & Finzi, Reference Raciti, Hutyra, Rao and Finzi2012).
These findings highlight how methodological choices in defining urban boundaries can substantially alter our understanding of urban ecological functions and attribution of various environmental impacts to urban areas. Therefore, establishing consistent, transparent, and context-appropriate definitions of urban areas is essential for accurate environmental monitoring, cross-city comparisons, evidence-based urban policy, and assessing urban contribution to global environmental change.
1.2 Physical and Biogeochemical Processes and Their Importance for Global Environmental Change
Earth system science is an interdisciplinary field focusing on understanding the Earth as a complex and adaptive system. The emergence of this field was prompted by the need to understand global environmental change and to be capable of predicting its future evolution. Its development was influenced by several concepts and theories focusing on Earth and its evolution, like Noosphere, Anthropocene, and the Gaia hypothesis (Box 1.2), as well as the emergence of global data, global numerical models, and high-performance computing (Steffen et al., Reference Steffen, Richardson, Rockström, Schellnhuber, Dube, Dutreuil and Lubchenco2020).
James Lovelock formulated the Gaia hypothesis in the 1970s. He suggested that Earth functions as a self-regulating, complex system made up of the biosphere, atmosphere, hydrosphere, and lithosphere, all intricately interconnected and evolving together (Lovelock, Reference Lovelock2009). According to this theory, the entire Earth system, also referred to as Gaia, tends to maintain a physical and chemical environment that is favorable for life as it exists at that moment.
In the context of Earth system science, physical processes refer to the mechanisms that regulate the transfer and transformation of energy across the interconnected Earth system components, such as the biosphere, atmosphere, hydrosphere, and lithosphere, and their subcomponents. Such processes include the absorption, reflection, emission, and storage of solar and terrestrial radiation, as well as the turbulent and conductive transfer of heat and moisture. These exchanges are strongly influenced by the physical characteristics of both land and aquatic surfaces. For example, albedo (surface reflectivity) determines how much solar radiation is reflected versus absorbed by a surface; surface roughness affects wind flow and turbulence, influencing convective heat exchange; and heat capacity and thermal conductivity of the surfaces govern how energy is stored and transferred within soils, vegetation, water bodies, the atmosphere, and built infrastructure.
Together, these physical processes shape key Earth system dynamics, including local and regional climate patterns, surface temperatures, evaporation rates, and the overall energy balance of the Earth system. Understanding physical interactions is therefore critical not only for interpreting ecological and climatological patterns but also for numerical modeling and predicting the feedback between land use change (including urbanization), and climate change. These physical interactions are discussed in Chapters 4 and 5.
Biogeochemistry is the study of the behavior and cycling of inorganic chemical elements within biological systems on a geologic scale (2025). This discipline bridges biology, geology, chemistry, and environmental science to understand how chemical elements such as carbon, nitrogen, phosphorus, sulfur, and many others move through Earth’s major reservoirs, such as the land, atmosphere, ocean, and rocks/sediments. Biogeochemical processes refer to the pathways and mechanisms by which these elements are exchanged among the major Earth system reservoirs and their components. These exchanges occur through various physical states such as gaseous, liquid, and solid. They are mediated by abiotic factors, such as weathering, erosion, and atmospheric deposition, biotic processes, such as photosynthesis, respiration, decomposition, and microbial activity, and human activities, such as extraction and burning fossil fuels, land use conversion, materials manufacturing, and fertilizer production.
Understanding biogeochemical cycles is essential for assessing ecosystem function, climate regulation, and the long-term stability of Earth’s environment, especially in the context of urbanization, which excessively alters the natural cycling of key chemical elements and contributes to global environmental change. These cycles are discussed in Chapter 6.
Feedback here refers to a cycle or loop where the output of a system amplifies or inhibits the system’s functioning. Positive feedback refers to the process that amplifies the changes, while negative feedback refers to the dampening of the changes. For instance, here is a classic example of a physical feedback loop. Ice and snow reflect a large portion of incoming solar radiation because of their high albedo. When glaciers melt as a result of rising air temperatures, the darker underlying surfaces, such as rock or soil, become exposed to the sun. These darker surfaces absorb more solar energy than ice and release it slowly, contributing to additional local warming. This, in turn, accelerates further ice melt, reinforcing the initial warming.
Physical and biogeochemical feedbacks in the Earth system play a central role in determining how rapidly and strongly the planet responds to human-induced changes. Urbanization is one of the most prominent drivers of these changes. It alters land surface structure, disrupts natural energy and water balances, and modifies atmospheric composition. These changes can amplify feedback mechanisms, such as increased land surface temperatures or reduced carbon uptake by vegetation, that influence both regional and global climate systems. In some cases, such feedback may even contribute to crossing critical thresholds, or tipping points, where gradual environmental change accelerates or becomes irreversible. Examples of tipping points include the collapse of polar ice sheets or shifts in monsoon patterns.
Global environmental change encompasses the large-scale, long-term transformation of the biosphere, atmosphere, hydrosphere, and lithosphere of Earth, predominantly driven by human activities. Among the most significant drivers is urbanization, which reshapes land surfaces, alters local and regional climates, intensifies resource demand, and increases pollutant emissions. It was first hinted by Ethan Decker and his colleagues in their seminal paper focusing on energy and materials flows through urban systems based on the review of data from 25 of the world’s largest cities at the end of the twentieth century (Decker, Elliot, Smith, Blake, & Rowland, Reference Decker, Elliot, Smith, Blake and Rowland2000). They identified Earth system level loops between cities and neighboring ecosystems and concluded that while plentiful data exist for individual cities, comprehensive cross-city compilations for biogeochemical analysis and numerical modeling were lacking. Later, Grimm et al. (Reference Grimm, Faeth, Golubiewski, Redman, Wu, Bai and Briggs2008) synthesized the available information on five major types of global environmental change that affect and are affected by urban ecosystems, such as changes in land use and cover, biogeochemical cycles, climate, hydrological systems, and biodiversity. They demonstrated that the material demands of production and human consumption in cities transform land cover, impact biodiversity, and modify hydrological systems from local to regional levels. Additionally, waste and greenhouse gas emissions from urban centers influence biogeochemical cycles and climate on local to global scales.
These atmospheric changes have cascading effects, including the accelerated melting of glaciers and polar ice sheets, as well as thermal water expansion in oceans, which contribute to global sea level rise. Concurrently, the frequency and severity of extreme weather events such as floods, droughts, and storm surges have increased, often disproportionately affecting densely populated urban areas. Urban surfaces, with their low albedo and high heat retention, further exacerbate these impacts through the urban heat island effect.
Terrestrial ecosystems are also undergoing substantial modifications. Deforestation and landscape fragmentation driven by urbanization and agricultural expansion alter ecosystem structure, disrupt ecological connectivity, and accelerate biodiversity loss. Additionally, the increasing frequency and intensity of forest fires driven by a changing climate and land-use pose further risks to ecosystem integrity and atmospheric stability. Together, these indicators (Box 1.3) highlight the complex, interconnected nature of global environmental change and underscore the urgent need for integrated, cross-disciplinary approaches to understand, monitor, model, and mitigate its impacts, especially in the context of accelerating urbanization.
Increase in concentrations of greenhouse gases and other air pollutants in the atmosphere
Climate change
Melting of glaciers and ice sheets
Sea level rise
Higher frequency and intensity of floods and storm surges
Higher frequency and intensity of droughts
Deforestation
Landscape fragmentation
Biodiversity’s loss
Higher frequency and intensity of forest fires
Urbanization, as a major driver of environmental transformation, plays a crucial role in shaping Earth system dynamics. Looking ahead, the key challenge for Earth system science is to integrate human systems, including urban ecosystems, with physical processes and biogeochemical processes to form a holistic understanding of global environmental change.
1.3 Summary
City definitions vary across time, disciplines, and countries, reflecting a mix of administrative, demographic, spatial, and economic criteria. While some nations use a single factor like population size, others, such as India and Bhutan, apply multi-criteria approaches. Global thresholds for defining urban areas range widely, from 200 to 50,000 inhabitants.
National definitions of cities often rely on administrative boundaries, which vary across countries and hinder international comparisons. To address this, alternative definitions based on functional and physical characteristics have been developed. Functional urban areas defined by commuting patterns reflect a city’s economic reach, while physical boundaries based on impervious surfaces, mapped via remote sensing, capture the built-up extent. These methods allow for more consistent and comparable assessments of urban areas globally.
Cities are classified by population size into six categories, from megacities to small urban settlements. As of 2018, nearly 60% of the world’s urban population lived in cities with fewer than 1 million people, highlighting the global importance of small- and mid-sized cities.
How cities and urban boundaries are defined substantially influences the assessment of urban pollution, resource use, and consumption patterns. Studies have shown that estimates of energy use, CO2 emissions, and carbon storage can vary dramatically by up to sixfold depending on the urban definition applied. This draws attention to the importance of consistent and transparent urban boundary delineation in environmental analyses, which is not always easy to achieve.
In Earth system science, physical processes refer to the transfer and transformation of energy across the atmosphere, biosphere, hydrosphere, and lithosphere. These processes include the absorption, reflection, emission, and storage of solar radiation, as well as the movement of heat and moisture. Surface structure and its characteristics, such as albedo, roughness, and heat capacity, play a major role in shaping local climates and the Earth’s overall energy balance.
Biogeochemical cycles refer to the movement of chemical elements like carbon, nitrogen, and phosphorus through the main components of the Earth system and their sub-components. These cycles are driven by both natural processes – such as photosynthesis and weathering – and human activities such as urbanization and agriculture.
Feedback loops, where system outputs influence their own behavior, are crucial to understanding environmental change. Positive feedback amplify changes, while negative ones reduce them. For example, ice melt increases warming by exposing darker surfaces that absorb more heat. Both physical and biogeochemical feedback loops influence how the Earth responds to human actions.
Urbanization is a major driver of global environmental change. It alters land surfaces, their energy and water balances, and atmospheric chemical composition, amplifying feedback loops like climate warming and reducing natural carbon uptake. Studies show that urbanization influences land use, climate, water systems, and biodiversity at both local and global scales, making urban planning and sustainability critical to Earth system stability. In a broader sense, urbanization tests the Gaia hypothesis: the idea that the Earth system tends to self-regulate to maintain conditions favorable for life as it currently exists.
1.4 Review Questions
1. What criteria are commonly used in definitions of urban areas in different countries?
2. Why may national definitions of urban areas hinder international comparisons of urban activities?
3. What are FUAs, and how do they help define cities more consistently?
4. How does using physical characteristics of cities, like their impervious surface area, improve urban area delineation?
5. Why is it important to classify cities by population size? What is the significance of cities with fewer than 1 million inhabitants?
6. In what ways can different definitions of urban boundaries affect assessments of pollution sources or energy use?
7. What physical processes are affected by urbanization? Provide an example of a physical feedback involving urban growth.
8. How does urbanization influence biogeochemical cycles, and what are the environmental consequences?
9. What are the main indicators of global environmental change?
10. Why is interdisciplinary research essential for addressing the complex effects of global environmental change driven by urbanization?