Recently, APSA has seen an increased demand for data on political science job
market trends due to current economic downturns and related academic budget
shortfalls. For example, many candidates contemplating entering the job
market want to know the relationship between finishing the Ph.D. and
obtaining a job, which specialty enables one to be more competitive in the
marketplace, and the type of position one is likely to obtain given a
general increase in the number of temporary faculty positions in
universities nationwide. The following report captures job market trends in
political science for the placement class of 2001–2002.1
Each year, APSA conducts a survey to collect data from
Ph.D.-granting political science departments. The placement survey
was distributed by mail to all U.S. Ph.D. political science granting
institutions (N=128) beginning in October 2002. A three-tiered
approach was utilized in order to ensure a high response rate: 1)
mail distribution; 2) email survey for nonrespondents; 3) follow-up
calls to nonresponding departments. For 2001–2002, 120 departments
completed the survey for a total response rate of 96%. The placement
class represents the number of students who have completed a Ph.D.
or are near completion and are actively engaged in seeking a
position in 2001. A total of 1,023 students were identified in the
2001–2002 placement class. The questionnaire used for this report is
similar to last year's (2000–2001) allowing for longitudinal
comparisons.
The APSA placement survey has assessed the
vitality of the job market and examined career opportunities for future
political scientists for over 15 years. The purpose of this report is to:
(1) summarize key findings of the placement class of 2001–2002;
2
(2) provide an assessment of the placement class for 2001–2002 by comparing
prior annual data; and (3) address associational efforts linked to career
preparation and recommendations for graduate departments.
Highlights of the 2002 Placement Survey
Candidate Pool. The number of job candidates totaled 1,023,
which is higher than in 2001, 2000, and 1998. Sixty-three percent of the
job candidates had their Ph.D. in hand; 37% were ABD.
Type of Position. Job candidates with Ph.D.s fared better in
finding a position than ABD candidates. Ph.D. holders had an 87%
placement success as opposed to 66% for ABDs.
Gender Differences. Women represented 37% of the placement
class; men comprised 63%.3
The “Survey of
Earned Doctorates” indicates that in 2001 females received 44%
of all doctorates. Of those awarded within the social sciences
women earned 54.4% of all doctorates, 64.6% of all education
doctorates, 50.6% in the humanities, with lower percentages in
the physical sciences and engineering (25.2% and 16.9%,
respectively). The percentage of political science/international
relations doctorates earned (32.6%) mirrors to some extent the
percentage of women in the placement class.
Relatively
little variation exists in placement success between men and women.
There is no substantial percentage difference in the distribution
between a male and female in terms of their ability to acquire a
permanent or temporary position. Among women candidates, 78% were placed
whereas 80% of men were successful in obtaining a position. Further, the
distribution in temporary positions does not vary significantly in
gender categories: 32% of the men placed in temporary positions as
compared to 30% of the women.
Placement Success. In 2002, 79% of the placement class found
employment, reflecting the highest success rate in over 10 years;
however, temporary positions slightly increased from last year's class,
from 25% to 31%.
Field or Specialty. Placement success in a particular field of
specialization has changed in the past decade. For the first time,
comparative politics led in the number of candidates placed in
comparison to American politics/public law.
Repeat Candidates in the Market. The proportion of candidates in
the market repeating their job search remains high, which is consistent
with patterns in the last decade. Forty-two percent of candidates were
repeating their search in 2001; this percentage is similar to last
year's figures (40%).
Characteristics of the Placement Class 2001–2002
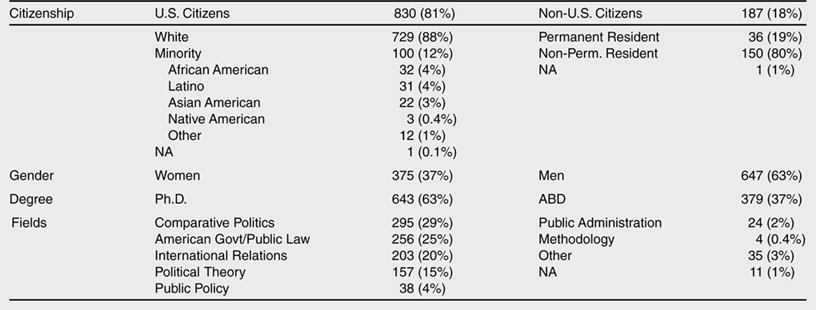
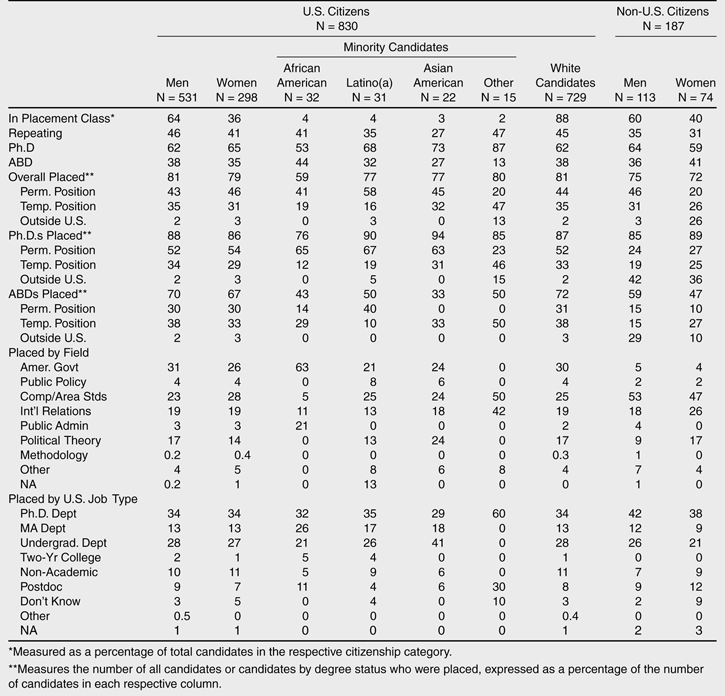
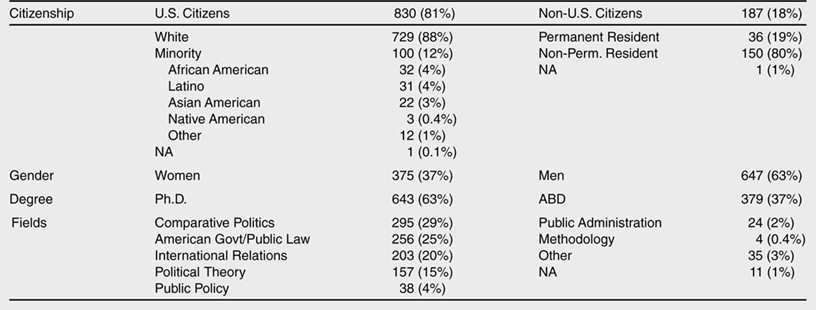
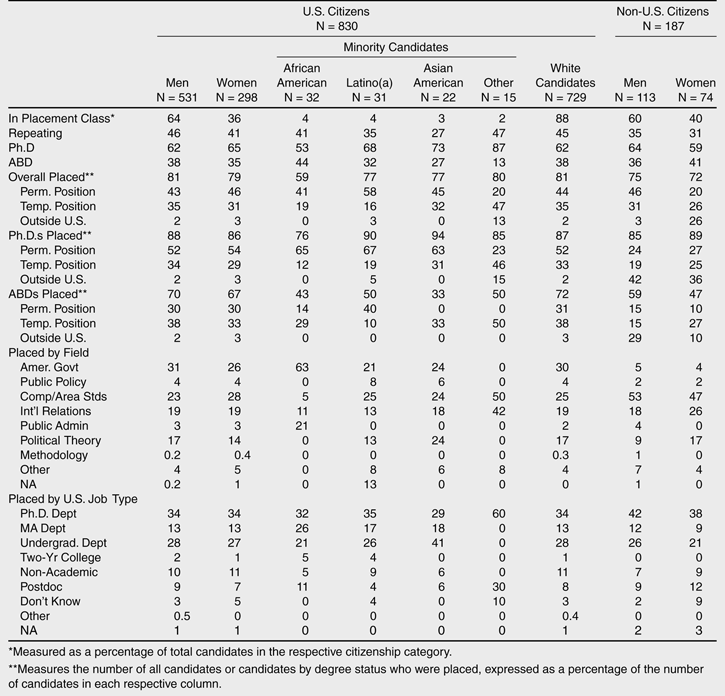
Table 1 profiles the 2001–2002 placement class,
or the number of candidates seeking employment in the beginning of the
2001 academic year, and compares both U.S. citizens and non-U.S.
citizens in the job market. U.S. citizens account for 81% of the job
seekers. The demographic data indicate considerable disparities in race,
ethnicity, and gender among the pool of candidates entering the market.
For example, 88% of the job candidates profiled are White, compared to
12% of which are minorities (4% African American, 4% Latino/a, 3% Asian
American, 0.4% Native American). Women account for 37% of the candidate
pool whereas men comprise 63%. The distribution in area of specialty or
field indicates a higher percentage of comparativists (29%) who landed
jobs in the market as compared to Americanists (25%); however, this
difference is minimal at best.
Placement Success
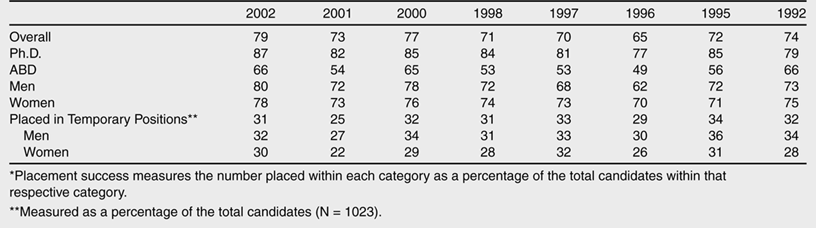
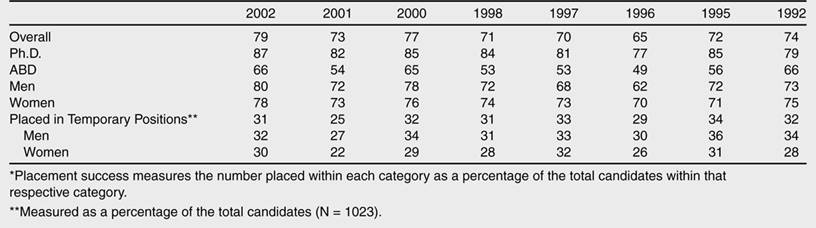
Data from 1992–2002 (Table 3) illustrate
that the overall placement class success (landing a position), is
roughly 65% or more for job candidates who found positions in
political science. This year, the job market success is greater
(79%) than in previous years; nevertheless, the fact that more
departments responded this year as compared to any other year may
account for part of the increase over the last decade. Ph.D.s in
political science secure positions at higher rates than ABDs. For
example, 87% of Ph.D.s were likely to obtain a position as compared
to 66% of ABDs. The type of position shows a slight increase in
temporary positions (31%) in the 2002 placement class as opposed to
2001 (25%). Despite a higher success rate in placement among male
candidates, the percentage differentials for this year are minimal
when comparing female candidates. Overall, a summary of the results
in Table 3 (1992–2002) further underscores
this point with percentage differentials in placement success
varying based on gender with no discernible differences in a woman's
potential to secure a position.
Field of Specialization and Type of Hiring
Institution
The distribution of jobs by field or specialization indicates some
changes from last year and from past trend data. Comparative
politics, as a field, dominated over both American government/public
law and international relations for the first time in the number of
candidates placed. Almost half of the positions were in comparative
politics or international relations (48%), a slight increase from
2001 (43%). In American politics/public law, a quarter of all
candidates were placed in these subfields, a slight decline from
2001 figures (31%), followed by political theory which had the third
largest share of all positions filled at 15%, up slightly from prior
years.
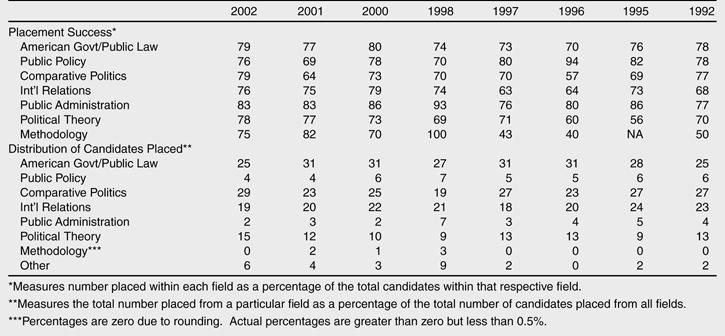
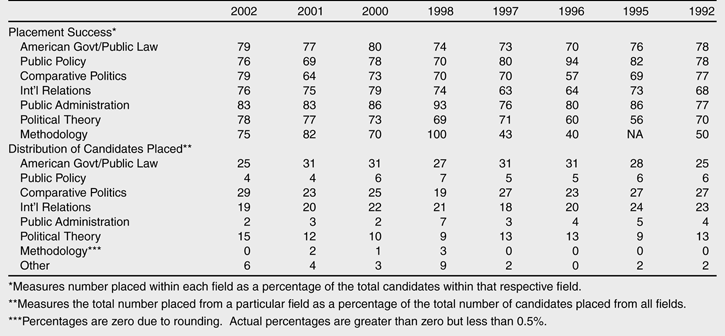
Table 5 summarizes placement success by
field of specialization. Candidate placement success varies
depending on the field of specialization. A review of placement
success by specialization illustrates a stronger potential to land a
job in all fields relative to last year. In 2001–2002, graduates in
public administration with a smaller share of positions had the
strongest placement success, with over 83% of these candidates
finding a position, followed by graduates in American government and
comparative politics (79% in each specialty), political theory
(78%), international relations and public policy (76%), and
methodology (75%).
Placement by Type of Institution
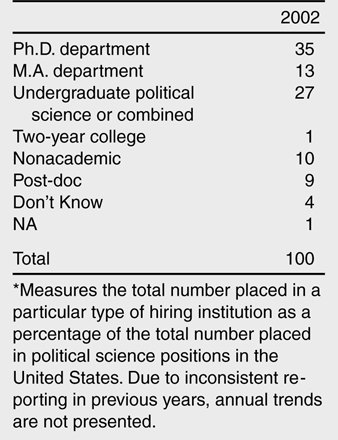
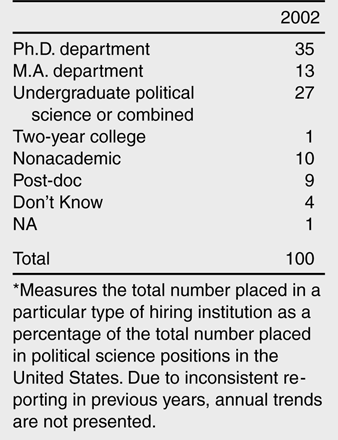
Table 4 records data on the type of hiring
institution where candidates found employment. A retrospective
examination of responses from graduate directors on the type of
position students obtained shows an increase in placement in Ph.D.
departments as compared to in 2000 and 2001, respectively (Davis 2002, 607). This year, graduate
directors reported that 35% of those placed were hired in Ph.D.
departments as compared to 27% in undergraduate political science
departments and 13% in M.A. departments (see Table 4). Very few candidates take positions in two-year
colleges (1%), with more candidates taking post-docs (9%) and
non-academic positions (10%) as their career choice. The selection
of a non-academic position still remains consistent with prior
levels, ranging from 7–13% in the past decade.
Women and Minorities in the Job Market
Trends in the placement class (Table 2)
indicate that women are better off in their job placement success in
the last decade, although with some fluctuations in their
representation in the placement class. An upward trend in their
representation has occurred since 1998. In 1992, women (U.S.
citizens) accounted for 30% of the placement class and in 2002, 37%
of the placement class. Despite a higher proportion of men in the
marketplace (64%) as compared to women (36%), gender does not have a
notable effect in the likelihood of obtaining a position, the type
of position, or type of hiring institution. Across the board,
similar patterns exist between men and women in terms of their
placement success and opportunity to secure employment.
The data on the placement experiences of women in the profession
(Table 7), presents an optimistic
picture. Overall, men and women placed in positions at similar
rates: 81% of men and 79% of women were placed. Moreover, there are
no substantial differences in the type of hiring institution. Both
men and women found positions in Ph.D. departments (34%), in
Master's departments (13%), and in undergraduate departments (28%
for men and 27% for women) at the same rate.
Racial and Ethnic Outcomes in Placement
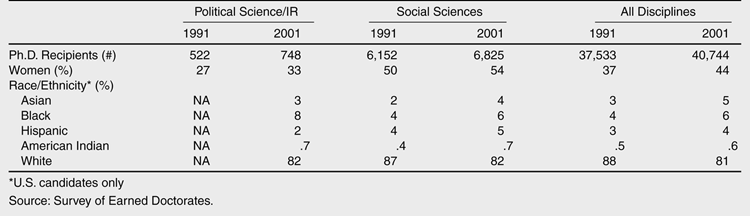
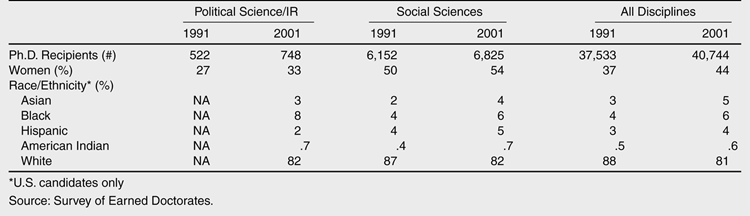
National trends in total earned doctorates illustrate similar
patterns in the percentage of minorities receiving a doctorate in
political science. Racial and ethnic minorities received 16.1% of
the total share of the doctorates earned in 2001 (National Opinion Research Center 2002, 16). According to
data derived from the Survey of Earned Doctorates, African Americans
received the most doctorates (6%), followed by Asians (5%),
Hispanics (4%), and Native Americans (0.6%) (see Table 13). Comparing these overall figures to political
science and international relations doctorates, African Americans
received the most doctorates (8%), followed by Asians (3%),
Hispanics (2%), and Native Americans (0.7%).
Trends over time show some gains for racial and ethnic minorities.
However, these figures also point to the need to further study
factors limiting their entry into and completion of doctoral study.
While the number of Ph.D.'s awarded to racial and ethnic minorities
has increased in the last decade, the percentage change is not
substantial (see Table 13). Racial and
ethnic minorities are not well represented in the social sciences
and particularly in political science if one compares these figures
to their White counterparts (over 82% of the political
science/international relations Ph.D.'s were awarded to Whites).
Despite low minority representation in the percentage of doctorates
earned, placement success among minority doctoral candidates
entering the job market in political science is relatively high.
Although racial and ethnic groups accounted for only 12% of the
total pool of U.S. candidates in the placement class, in percentage
terms, Latinos/as and Asian Americans had a 77% success rate in
placement. This is in direct contrast to African Americans success
rate (59%).4
Two departments which
awarded the most doctorates to African Americans did not
respond to the 2001–2002 placement survey. As a consequence,
the percentages for African Americans may not reflect the
actual placement success.
Some variations exist
based on type of position. Latino/a candidates landed permanent
positions in greater percentages than any other group. Approximately
58% of Latino/a candidates were placed in a permanent positions,
followed by Asian Americans (45%), Whites (44%), and African
Americans (41%). A higher proportion of White candidates landed
temporary positions (35%) as compared to Asian Americans (32%),
African Americans (19%), and Latinos/as (5%). Type of hiring
institution also differs across racial and ethnic groups. While
White, Latino/a, and African American candidates found positions in
greater numbers in Ph.D. departments, Asian Americans, in contrast,
have the greatest placement success rate in undergraduate
departments (41%).
Placement Experiences of Non-U.S. Citizens and of
Candidates Who Were Not Placed
Each year, the placement survey gathers information concerning
citizenship status, country of citizenship of new doctorates in the
job market, and data on the placement experiences of non-U.S.
citizens. In the 2001 placement class, non-U.S. citizens comprised
18% of the class with national origin ranging from Korea (highest
number), Canada, China, India, Japan, Germany, and parts of Latin
America. Of the non-U.S. citizens, 19% were permanent residents and
80% were non-permanent residents (see Table
1). Despite a similar rate of placement success between
men and women who are non-U.S. citizens (75% men and 72% women),
some gender differences exist in terms of prospects for finding a
permanent position. Men in the non-U.S. category had a 50% greater
chance of obtaining a permanent position than their female
colleagues (see Table 7).
The APSA placement survey also includes a number of questions related
to graduates' plans for work or further study. Among the
international candidates who did not find positions, departments
noted 39% will stay in school with financial aid, 12% will stay in
school without financial aid, and 15% will seek a position outside
the profession; 9% listed their status as uncertain. In contrast,
about a quarter of the U.S. candidates not placed responded that
they would stay in school with a parttime position. A lower margin
than non-U.S. candidates, but a higher percentage was in the
uncertain status category (21%).
Job Search Strategies and Departmental Services Related to
Employment
Overall, departments appear to be providing professional development
outreach in the form of advisement to their graduates. The placement
survey asks departments to respond to the type of advice offered to
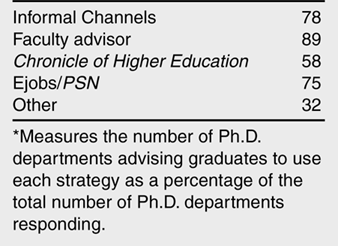
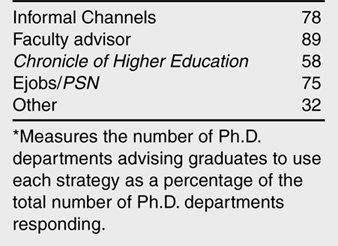
individual job candidates entering the market. Interestingly,
departments noted that faculty advisors (89%) provide the most
employment advice for job candidates on the market (see Table 11). Informal channels (78%) and the
use of the eJobs placement service (75%) are the second and third
highest rated, followed by job searches in the Chronicle of
Higher Education (58%) coupled with strategies used outside
of these resources. Over 70% of the departments provide professional
development opportunities in teaching and research for their
graduates. Doctoral programs have an array of mechanisms and
resources to encourage professional development activities in their
departments. Some departments noted the following examples in their
responses: a required oneunit course in professional socialization,
seminars on how to get a job, mock job interviews, assistance in
preparing a dossier, brown bag lunches on placement opportunities,
emphasis on publishing, alumni contacts, and placement centers.
Prospects for the Future in the Job Market: Conclusions
Comparisons with last year's class are consistent with a more positive
outlook for job candidates than expected. Approximately 79% of those in
the 2001–2002 class found positions as compared to 73% last year. Job
listings posted in the APSA Personnel Newsletter/eJobs show an increase
in the amount of positions listed for 2002–2003, although not at the
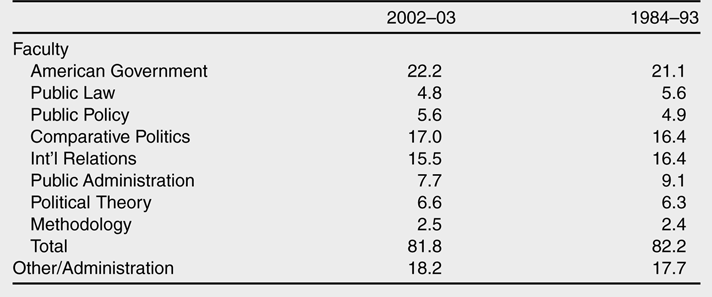
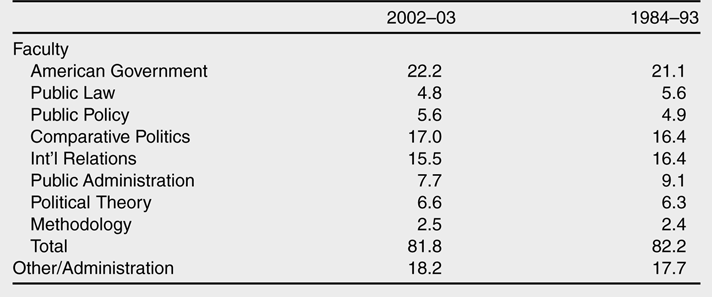
levels of the late 1980s. As noted in Table 16, 987 jobs were listed in
2001-2002; in 2002–2003, there is an increase of 216 jobs listed. Table 17 provides a distribution of jobs listed
by field. Candidate accessibility to jobs in specific fields remains
relatively the same over the course of the last decades. From 1984–1993,
a total of 82% of jobs listed were in academic positions, a trend
similar to patterns in 2002–2003. It should be noted that the number of
job listings may not be an accurate prediction of future job
opportunities.
Speculations on future job market prospects for political science
graduates are complicated by a variety of factors. Current economic
conditions provide a snapshot of what is likely to unfold in the coming
years. Nationwide universities are suffering economic shortages which
may affect the short-term job status of recent Ph.D.s. Shrinking
university budgets forces reassessment of how departments will hire
future political science Ph.D.'s, and the type of job opportunities
available for those completing graduate education. Enrollments also
factor in how we assess the future for recently minted Ph.D.s entering
the job market. Some predict sudden, large increases in graduate
enrollments as the economy declines, while others predict a steady
growth in the rate of graduate enrollments in the future. While opinions
are mixed on the future of graduate enrollments,5
Economic downturns are often equated with an increase in
the number of students entering graduate programs, a
circumstance which occurred from 1999–2000. However, recent data
from the Survey of Earned Doctorates (SED) showed a decline of
1.4% in 2001. Others predict a steady growth rate in graduate
enrollments in the future.
its impact on career
opportunities cannot be underestimated. U.S. economic conditions have
potentially negative impacts for political scientists entering the job
market. One concrete example is the increase in the number of part-time
faculty positions, with a decline in the number of tenure-track faculty
positions, as noted in this report.
Departments and university faculty are instrumental actors assisting
graduate students in their professional development and, more
specifically, in their job market search. Career preparation must be
emphasized in Ph.D. programs, especially if the job market is
constrained in the next few years, and departments must prepare students
for a broad range of employment opportunities. The APSA Task Force on
Graduate Education has actively examined the type of academic and career
preparation necessary for political science graduate students and
provides recommendations for departments to follow in their recent draft
report (APSA Task Force 2003). APSA recommends
that departments utilize the Preparing Future Faculty (PFF) model as the
basis for fostering and promoting professional development opportunities
for graduate students. In addition, more departmental involvement in
assisting students in the practical aspects (e.g. how to prepare for the
job talk, how to interview, and how to prepare a dossier) needed to
secure a position is also recommended. The American Political Science
Association also provides professional development opportunities in the
form of short courses, specialized panels, and career publications.
While the professional culture in political science continues to
emphasize faculty appointments over applied positions, the discipline
needs to devise and share strategies to better equip students in the
future. One area for further consideration consists in conducting
longitudinal research on graduate cohorts to identify the important
skills needed to be competitive in the marketplace, the type of
advisement and mentoring offered by graduate departments, and
professional development opportunities and resources unique to
individual departments. The “Social Science Ph.D. Five Years Out
Study,”6
The CIRGE study will examine
Ph.D.s who earned their degree in 1996, 1997, or 1998 in
anthropology, business, communication, geography, history,
political science, or psychology and will focus on job search,
work/life choices, and doctoral program evaluation. The survey
will be disseminated in January 2004. For more information visit
http://www.cirge.washington.edu.
which
will be conducted by the Center for Innovative Research in Graduate
Education (CIRGE), is one step in the right direction to understanding
the graduate student education experience and tracking career
preparation and outcomes.
In conclusion, the findings of the 2001–2002 survey indicate some
difficulties for political science doctoral students entering the job
market. First, a considerable amount of job candidates repeat their
employment search. Second, there has been an increase in the number of
temporary faculty positions. Despite these trends, the data confirm that
most candidates succeed in obtaining employment and that faculty
advisors are key actors in providing advice to graduate students in
their career preparation.
Data entry and assistance in preparing tables was made by Michael
Woodruff and Sarah Mi Ra Dougherty.