Introduction
Dynamic recrystallization (DRX) is a certainly important metallurgical phenomenon in metal processing since the deformed grains can be restored and grain refinement can be obtained through DRX [Reference Doherty, Hughes, Humphreys, Jonas, Jensen, Kassner, King, McNelley, McQueen and Rollett1]. Concurrently, the flow resistance of alloys undergoes big changes associated with the occurrence of DRX [Reference Zhang, Zhang, Jiang and Lu2]. Researchers have studied the DRX behaviors extensively aiming to optimize the microstructures and final mechanical properties through thermo-mechanical processing [Reference Son, Jung, Lee and Hyun3, Reference Liu, Ning, Yao, Li, Zhang and Fu4]. A majority of researchers have investigated the stress–strain responses during hot compression and/or tension tests using thermo-mechanical simulator [Reference Shang, Cui and Fu5, Reference Chen, Lin and Ma6]. The hot deformed specimens were generally quenched after deformation to observe the optical microstructures. Then some constitutive equations were established for predicting the DRX kinetics and flow resistance based on these experiments [Reference Chen, Li, Lin and Yuan7, Reference Zhang, Zhang, Shen, Liu, Xia and Li8]. These achievements are of significant importance to design and optimize the hot working technology of alloys [Reference Li, Li, Zhou, Zhou, Li and Liu9, Reference Chen, Yuan, Lin, Li, Zou, Chen, Yuan, Lin, Li and Zou10]. However, most of the observed microstructure evolutions during DRX experiments were segmented. The continuous topology evolution of grains during DRX is difficult to be tracked using experiments [Reference Chen, Qi, Cui and Lai11]. Moreover, the hot deformation tests are usually conducted at fixed temperature with certain strain rate, which is supposed to deviate from the actual rolling or forging deformation conditions.
Computer simulation provides an alternative approach to model the DRX behavior besides experimental investigation. Recently, the common simulation methods include finite element method (FE), Monte Carlo method (MC), phase field method (PF) and cellular automaton method (CA). Among these methods, FE method is mainly used to investigate the macroscopic mechanical behavior of materials [Reference Jiang, Yang, Dong, Zhang and Yao12]. Others can predict the microstructure evolution. However, PF method needs extensive calculation [Reference Xiao, Hodgson, Rolfe and Li13] and MC method cannot take into account the grain boundary migration [Reference Li, Xu, Mattila, Kivilahti, Laurila and Paulasto-Kröckel14]. Comparatively, CA method shows pronounced advantages on modeling the topological transformation of grains with time as well as the flexibility of constitutive relations for grain growth [Reference Chen, Cui, Liu, Chen and Chen15, Reference Shabaniverki and Serajzadeh16]. Moreover, CA is more favored owing to its computational efficiency and low cost. Thus, CA method is increasingly used for simulating the DRX behavior of alloys in recent years. Ding and Guo proposed a two-dimensional CA model coupled with fundamental metallurgical principles to model the DRX process of titanium alloy successfully [Reference Ding and Guo17, Reference Ding and Guo18]. Afterward, the CA method is widely applied to study the DRX behaviors of austenitic stainless steel [Reference Chen, Qi, Cui and Lai11], Ni-based superalloy [Reference Jaeger, Solas, Fandeur, Schmitt and Rey19], titanium alloy [Reference Han, Chen, Yang, Li and Wang20], magnesium alloy [Reference Chen, Yuan, Li and Zou21], aluminum alloy [Reference Zhang, Lu, Wu and Gong22] and other materials.
C276 is a typical Ni–Cr–Mo-based superalloy which is widely used in nuclear and chemical industries due to its excellent corrosion resistance and mechanical stabilities [Reference Zhang, Zhang, Shen, Xu and Cui23]. With the increasing applications in extreme conditions, the thermo-mechanical processing of C276 superalloy has received more attentions to optimize the microstructure and properties of products. Because of the low stacking fault energy (SFE) preserved in C276 superalloy, DRX easily occurs during the thermo-mechanical processing [Reference Zhang, Zhang, Shen, Li and Gu24]. Our pervious researches have investigated the DRX behavior of C276 superalloy using hot compression tests [Reference Zhang, Zhang, Shen, Xu and Cui23, Reference Zhang, Zhang, Shen, Li and Gu24]. It is found that the hot working window for obtaining a uniform and fine recrystallized grain structure is narrow. However, little information about the computational simulation of DRX for C276 superalloy are available. To optimize the thermo-mechanical processing, especially for the condition of heterogeneous deformation with temperature gradients, it is urgently needed to develop a computational simulation model of DRX for C276 superalloy.
In this paper, a two-dimensional CA model of DRX for C276 superalloy was developed based on the hot compression experiments. The microstructure evolution and flow behavior during DRX were studied in detail.
Establishment of CA model of DRX
General description of CA model
Dislocation density evolution
During hot deformation, the evolution of dislocation density is affected by both work hardening and dynamic softening. Softening effects is believed to consist in two parts, dynamic recovery and DRX. Kocks–Mecking (K–M) model is dedicated to calculate the evolution of dislocation density as follows [Reference Chen, Yuan, Li and Zou21, Reference Mecking and Kocks25]
 $${{{\rm{d}}\rho } / {{\rm{d}}\varepsilon }} = {{{\rm{d}}{\rho ^ + }} / {{\rm{d}}\varepsilon }} + {{{\rm{d}}{\rho ^ - }} / {{\rm{d}}\varepsilon }} = {k_1}\sqrt \rho - {k_2}\rho \quad ,$$
where dρ+ and dρ− represent the generation and annihilation of dislocation density with increasing strain [Reference Zhang, Tian, Volinsky, Chen, Sun, Chai, Liu and Liu26, Reference Huang and Logé27]. k 1 and k 2 are the work hardening parameter and the dynamic recovery parameter, respectively.
The deformation resistance (σ) can be calculated by [Reference Mecking and Kocks25]
 $$\sigma = \alpha \mu b\sqrt {{\rho _{{\rm{mean}}}}} \quad ,$$
where α is the dislocation interaction term, b is the Burger’s vector and ρmean is the average dislocation density of all cells. μ is the shear modulus that varies with temperature. The expression can be obtained by linear fitting method
 $$\mu = {\mu _0}\left( {1 - 0.49 \times {{T - 333} \over {{T_{\rm{m}}} + 273}}} \right)\quad ,$$
where μ0 is the shear modulus at room temperature, T m is melting point 1598 K.
Sakai [Reference Sakai, Nagao, Ohashi and Jonas28] pointed out that the evolution of dislocation density within dynamic recrystallized grain usually undergoes three stages during hot deformation: (i) the initial dislocation density of the newly formed grain is assumed to be ρ0; (ii) with increasing deformation strain, the dislocation density would increase following the (K–M) model, resulting in the dislocation density gradient; (iii) recrystallized grains grow up until deformed matrices are replaced, the value of dislocation density reach saturation. When new recrystallized nucleus formed at grain boundary, the dislocation density dropped down to ρ0 again.
Nucleation of DRX
The DRX nucleation is supposed to form at grain boundaries in this work, which corresponds to grain boundary bulk nucleation mechanism of DRX. DRX occurs if the dislocation density reaches a critical value (ρc), which can be described as [Reference Ding and Guo17, Reference Ding and Guo18]
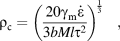 $${\rho _{\rm{c}}} = {\left( {{{20{\gamma _{\rm{m}}}\dot{\varepsilon }} \over {3bMl{\tau ^2}}}} \right)^{{1 \over 3}}}\quad ,$$
where γm is the grain boundary energy γm = μbθm/4π(1 − ν), ν is Poisson ratio of 0.3, l is mean free path of dislocation l = Kμb/σ, M is the grain boundary mobility and τ is dislocation line energy τ = μb 2/2.
The nucleation rate can be expressed as [Reference Ding and Guo17, Reference Madej, Sitko, Legwand, Perzynski and Michalik29]
 $$\dot{n}\left( {\dot{\varepsilon },T} \right) = {C_{{\rm{dynamic}}}}{\dot{\varepsilon }^m}\;\exp \left( { - {{{Q_{{\rm{act}}}}} \over {RT}}} \right)\quad ,$$
where C dynamic is material parameter and m is a constant, Q act is thermal activation energy, R is the universal gas constant.
Growth of DRX grains
The growth of nuclei is recommended as a thermally activated process. The velocity of grain boundary migration can be expressed by [Reference Madej, Sitko, Legwand, Perzynski and Michalik29, Reference Popova, Staraselski, Brahme, Mishra and Inal30]
 $$v = Mf\quad ,$$
where M is a function of temperature, which is related to the characteristic thickness of grain boundary (δ), grain boundary diffusion coefficient (D ob) and diffusion activation energy (Q b)
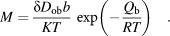 $$M = {{\delta {D_{{\rm{ob}}}}b} \over {KT}}\;\exp \left( { - {{{Q_{\rm{b}}}} \over {RT}}} \right)\quad .$$
The difference of dislocation density between recrystallization grain and matrix provides a driving force (f) for grain boundary migration. f can be formulated as [Reference Popova, Staraselski, Brahme, Mishra and Inal30]
 $$f = {F / {4\pi r_i^2 = - {{{{{\rm{d}}W} \over {{\rm{d}}R}}} / {4\pi r_i^2}} = \tau \left( {{\rho _{\rm{m}}} - {\rho _{ij}}} \right) - {{2\gamma } \over {{r_i}}}\quad ,}}$$
where ρm is the dislocation density of matrix, ρij is the dislocation density of the recrystallized grain, r i is radius of recrystallized grain,γ is grain boundary energy, γ can be determined by Read–Shockley equation [Reference Chen, Yuan, Li and Zou21]
 $$\gamma = \left\{ {\matrix{ {{\gamma _{\rm{m}}}{\theta \over {{\theta _{\rm{m}}}}}\left( {1\; - \;\ln {\theta \over {{\theta _{\rm{m}}}}}} \right)} \hfill & {\left( {\theta \; \lt \;{\theta _{\rm{m}}}} \right)} \hfill \cr {{\gamma _{\rm{m}}}} \hfill & {\left( {\theta \; \ge \;{\theta _{\rm{m}}}} \right)} \hfill \cr} } \right.\quad ,$$
where θ is the grain boundary misorientation between the recrystallized grain and its neighbor grain, θm is the critical misorientation of high angle boundary.
The time step is the quotient of the cell size L CA and the maximum moving velocity of grain boundary V max [Reference Liu, Lin, Li, Wen, Chen and Chen31]
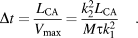 $$\Delta t = {{{L_{{\rm{CA}}}}} \over {{V_{\max }}}} = {{k_2^2{L_{{\rm{CA}}}}} \over {M\tau k_1^2}}\quad .$$
It is necessary to point out that annealing twins may appear during nucleation and growth since the C276 superalloy has low SFE. To focus on the topology characters of the tested superalloy during hot working, the twin nucleation and growth has not been simulated in this work.
Determination of CA parameters
C276 has a tendency for the occurrence of DRX. The flow stress curves generally exhibit a typical form of DRX behavior, as observed in previous papers [Reference Zhang, Zhang, Shen, Xu and Cui23, Reference Zhang, Zhang, Shen, Li and Gu24]. To implement the CA model, some parameters need to be determined based on the stress–strain curves.
In order to calculate work hardening parameter (k 1) and dynamic recovery parameter (k 2), an approach combining K–M model and work hardening curve was used. Deriving K–M equation, the following relationship can be received
 $$\ln \left( {{\sigma _{{\rm{sat}}}} - \sigma } \right) = \ln \left( {{\sigma _{{\rm{sat}}}} - {\sigma _0}} \right) - {{{k_2}} \over 2}\varepsilon \quad .$$
The ln(σsat − σ) − ε curve was fitted to decide the value of k 2. When the effects both of work hardening and dynamic softening arrive at equalization, k 1 can be determined by [Reference Mateusz and Lukasz32]
 $${k_1} = {{{\sigma _{{\rm{sat}}}}{k_2}} \over {\alpha \mu b}}\quad .$$
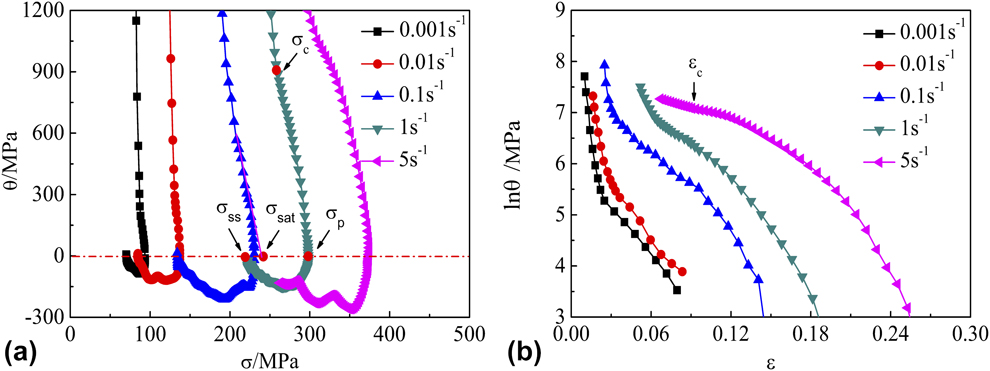
The characteristic points, σp, σc, and σsat can be determined from the strain hardening rate curves (θ − σ) proposed by Poliak and Jonas [Reference Poliak and Jonas33]. The strain hardening curves for the tested C276 superalloy are drawn in Fig. 1. The flow stress dependence of strain hardening rate (θ = dσ/dε) reflects the deformation mechanism changes [Reference Zhang, Zhang, Shen, Xu and Cui23, Reference Zhang, Tian, Volinsky, Chen, Sun, Chai, Liu and Liu26]. At the beginning, the value of θ decreases rapidly from a high value. This is caused by the high softening effect of DRX at the initial work hardening period. As the flow stress increases further, the rate of the decrease of θ becomes slow. This period corresponds to the formation of subgrain structure. Once the deformation degree reaches a critical value σc, DRX is initiated and causes θ to decrease dramatically. Thus σc is identified as the inflection point at which the second derivative of the θ with respect to stress is zero [Reference Zhang, Tian, Volinsky, Chen, Sun, Chai, Liu and Liu26]. When the softening of DRX dominates, the flow stress decreases with increasing strain, causing a peak stress σp occur in the stress–strain curves. Thus σp can also be determined at the point of θ = 0 in the strain hardening curves. And the saturation stress σsat is defined by the extrapolation of the θ − σ plot to θ = 0 again.
Strain hardening behavior of C276 superalloy deformed at 1423 K. (a) Work hardening curves, (b) ln θ − ε.
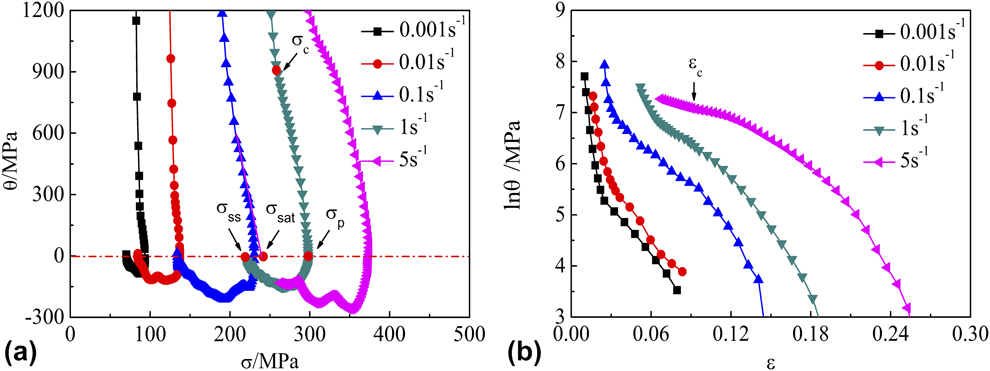
After determination of the σp, σc, and σsat, the values of k 1 and k 2 can be calculated using Eqs. (11) and (12). In this work, attempts were made to establish the relations between k 1, k 2 and deformation parameters.
The Zener–Hollomon parameter (Z) is widely accepted to characterize the combined effects of strain rate and temperature on the deformation process [Reference Zener and Hollomon34]
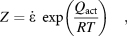 $$Z = \dot{\varepsilon }\;\exp \left( {{{{Q_{{\rm{act}}}}} \over {RT}}} \right)\quad ,$$
where the parameters have been illustrated previously. The activation energy for DRX (Q act) can be determined by regressing the equation using peak stress σp. In previous research, the Q act is obtained as 450 kJ/mol.
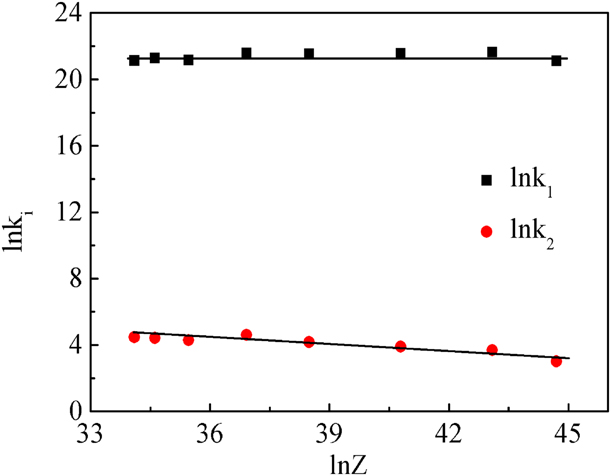
The dependences of the values of k 1 and k 2 on the Z parameter are drawn in Fig. 2. It indicates that ln k 1 and ln k 2 have an ideal linear relations with the ln Z. This agrees with the linear relations found by Liu et al. during using CA to model DRX of a Ni-based superalloy [Reference Liu, Lin, Li, Wen, Chen and Chen31, Reference Liu, Lin and Zhou35]. Therefore, k 1 and k 2 were expressed by
 $${k_{^1}} = 1.058 \times {10^9}\,{Z^{0.016}}\quad ,$$
 $${k_2} = 6.003 \times {10^3}\,{Z^{ - 0.12}}\quad .$$
Relationships between ln k i (i = 1, 2) and ln Z.

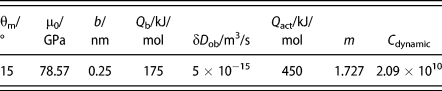
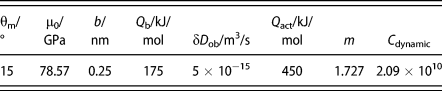
For other material parameters in CA model, the values of θm and Q act, were referred to previous researches [Reference Jaeger, Solas, Fandeur, Schmitt and Rey19, Reference Zhang, Zhang, Shen, Li and Gu24]. Some other parameters, b, m, C dynamic, and δD ob were optimized by comparing the kinetics of DRX of CA with the experimental results. Hot compression parameters, including deformation strain, strain rate, and temperature, were applied to the CA model. The final optimized material parameters in the CA model of tested C276 superalloy are listed in Table I.
Values of material parameters used in the CA model.
Simulation stages
The characteristic of CA method is that the time and space are discrete, namely, the whole system can be discretized into certain number of cells and time steps. The simulation area was composed of 500 × 500 square lattice cells with the length of 2 μm.
Five state variables were assigned to each cell:
(i) the color variable represents the appearance of recrystallization grains;
(ii) the orientation variable is used to distinguish different grain;
(iii) the dislocation density variable stands for deformation stored energy;
(iv) the grain boundary variable indicates whether the cell locates on grain boundaries;
(v) the distance variable records that the distance of boundary migration during grain growth.
The evolution of each cell’s states is determined by the states of its neighboring cells and its previous states according to a determined or probabilistic transformation rule [Reference Ding and Guo18].
Simulate processes of DRX are as follow:
(i) generating an initial microstructure with color variable and orientation variable;
(ii) calculating the time step (Δt) based on Eq. (10);
(iii) calculating the evolution of dislocation density based on Eq. (1);
(iv) simulating the process of nucleation. A nucleation criterion must fulfill that the local value of dislocation density reaches critical value (ρc) based on Eq. (4);
(v) simulating the progress of grain growth based on Eqs. (6) to (9).
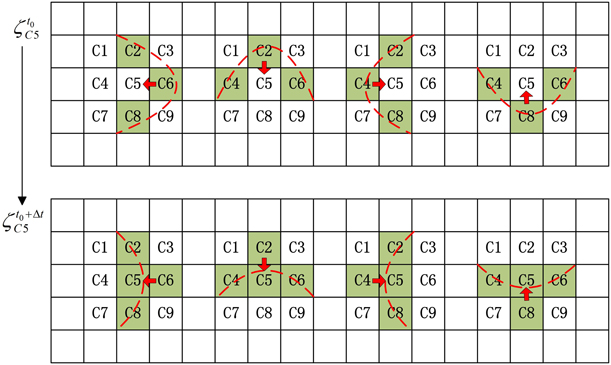
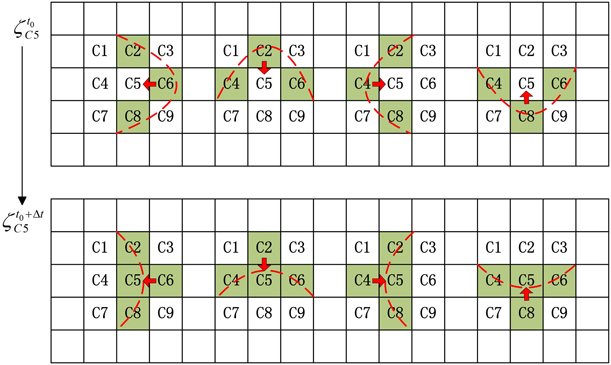
During DRX, un-recrystallized grains are switched to recrystallized state having to satisfy several conditions: (i) the cell is located on grain boundary; (ii) driving force (f) is positive; (iii) the random number generated by computer is less than transformation probability p (p = i/4), in which i is the number of neighborhood cells with the same orientation variable; (iv) the migration distance in one step is higher than the cell size (2 μm). Actually, the grain growth is a process of grain boundary migration that grain boundary always moves to the center of the curvature. And the main driving force of grain growth is the interfacial energy. The transformation rule of curvature-driven mechanism during grain growth is based on the von Neumann neighborhood, as shown in Fig. 3. If the arbitrary three cells among C2, C4, C5, and C8 around center cell C5 have same orientation S at t 0, then C5 will change its state into S at next time step (t 0 + Δt) [Reference Chen, Cui, Liu, Chen and Chen15].
Schematically illustration of the migration of grain boundary during recrystallization base on von Neumann neighborhood transformation rule.
Results and discussion
Evaluation of the simulation results with experiments
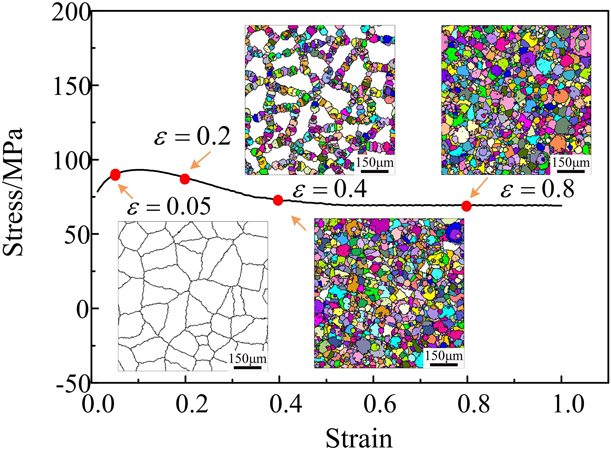
Figure 4 depicts the flow curve during hot compression calculated by the established CA model at a temperature of 1423 K and strain rate of 0.001 s−1. The corresponding microstructures are also shown. The white regions and colorful regions represent the deformed matrix and recrystallized grains, respectively. The calculated stress–strain curve shows a typical DRX behavior. Due to the high strain hardening associated with the increase of dislocation density at the initial stage of compression, the stress increases rapidly with the increasing strain. No recrystallized grains form at this stage. When the deformation proceeds to a value higher than εc or σc, DRX is initiated and the increasing rate of stress slows down quickly. The recrystallized grains form at grain boundaries and possess relatively much lower dislocation density. And with the fraction and grain size of DRX grains increase, the softening effect caused by DRX becomes dominated, causing the flow resistance decreases with the further increasing strain. When a dynamic equilibrium between strain hardening and DRX softening reaches, the stress tends to be steady while nearly completed DRX occurs.
The flow stress curve and corresponding microstructure evolution simulated by CA at 1423 K & 0.001 s−1.
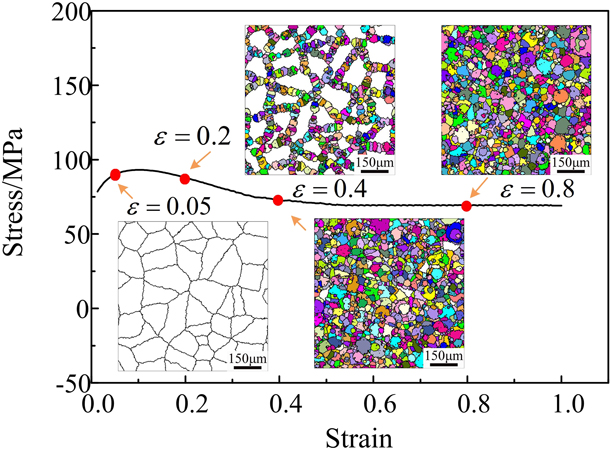
Figure 5 shows the stress–strain curves and the critical stresses (σp and σss) calculated by CA and experimental ones. One can infer that the CA simulated stress–strain curves agree well with the experimental curves. This indicates that the established CA models can reflect the variation of flow resistance with strains at different deformation conditions. Moreover, the predicted σp and σss under various deformation conditions by CA were also plotted against the experimental data in Fig. 5(c). It shows the predicted ones have good correspondence with the experimental ones.
Comparisons of the experimental results and predicted ones using CA. (a) stress–strain curves at  $\dot{\varepsilon } = 0.01\;{{\rm{s}}^{ - 1}}$, (b) stress–strain curves at T = 1423 K, (c) σp and σss.

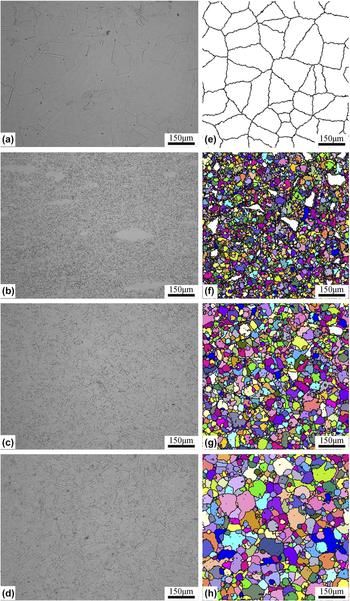
Figure 6 shows the microstructures observed in experiments and simulated ones using the developed CA model. Before compression, the tested material is composed of homogeneous equiaxed grain microstructure with the average grain size of 175 μm [Fig. 6(a)]. Fine grains were obtained after hot compression through DRX. And it can be found that the grain size varies with the deformation conditions. The simulated results indicate that there exists a reasonable agreement between the simulate topologies and the experimental ones. Besides, twin boundaries were observed in the optical photography. Twins are supposed to be formed associated with the formation of DRX grains [Reference Zhang, Zhang, Shen, Xu and Cui23]. Since twin formation was not considered in the CA model, the simulated ones do not contain twins in grain interiors. Nevertheless, both the microstructural topology and flow behavior suggest that the established CA model can be reliable to predict the DRX behavior of C276 superalloy.
Comparisons between the experiment and the simulated microstructures under various deformation conditions. (a, e) initial microstructure, (b, f) 1373 K & 0.01 s−1, (c, g) 1423 K & 0.01 s−1, (d, h) 1423 K & 0.001 s−1.

DRX characteristics of C276 superalloy
DRX of alloys is a complicated thermal activated process with the microstructure undergoing significant changes and stress–strain response varying with the deformation conditions. The deformation parameters, such as strain, strain rate, deformation temperature, are supposed to affect the DRX kinetics. The microstructure evolution and flow behavior of C276 superalloy during hot compression process can be simulated by the developed CA model. Moreover, once the CA model established, the continuous microstructure evolution during deformation process at arbitrary condition in the evaluated ranges can be monitored.
As shown in Fig. 4, with the increasing strain, new DRX grains nucleate at grain boundaries and grow into the deformed grains, stimulated by the strain energy. At the last stage of DRX, the deformed grains are replaced by the newly formed DRX grains with low dislocation density. Equiaxed and fine grain structures are then obtained though DRX. The DRX softening fraction X d can also be estimated by the decrease in the flow stress, i.e., Eq. (16) [Reference Xia, Zhang, Zhang, Shen and Xu36]
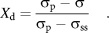 $${X_{\rm{d}}} = {{{\sigma _{\rm{p}}} - \sigma } \over {{\sigma _{\rm{p}}} - {\sigma _{{\rm{ss}}}}}}\quad .$$
And DRX fraction is also tracked by CA simulation based on Eq. (17):
 $${X_{\rm{d}}} = {{{N_{{\rm{DRX}}}}} \over {{N_{{\rm{tol}}}}}}\quad ,$$
where N DRX is the number of recrystallized cells, N tol is the number of total cells.
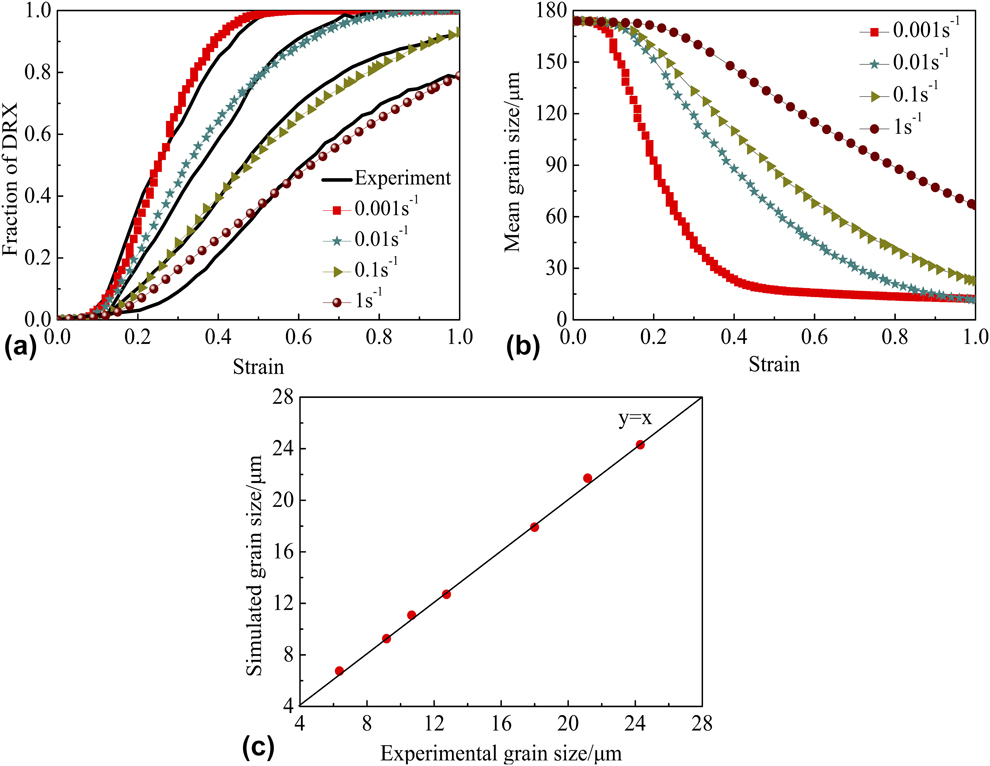
The variations of DRX fraction with deformation strain both simulated by CA and calculated from experiments are drawn in Fig. 7. The corresponding grain size evolutions are also drawn. The variations of DRX are of sigmoidal type with increasing strain, which means that the kinetics of DRX follow the Avrami equation [Reference Kugler and Turk37]. And with the proceeding of DRX, the mean grain size decreases, as shown in Fig. 7(b). After DRX, the mean grain size obtained by CA simulating agrees well with calculated results as shown in Fig. 7(c) based on Eq. (18)
 $${d_{{\rm{DRX}}}} = 6.58 \times {10^3}\,{Z^{ - 0.168}}\quad .$$
The kinetics of DRX and grain size variation during deformation at the temperature of 1423 K. (a) DRX kinetics, (b) mean grain size (c) comparison between experiment and simulation.

Furthermore, as shown in Fig. 5, it can be found that the critical strain (εc) for initiation of DRX decreases with the increasing temperature and decreasing strain rate. This indicates that DRX prefers to occur at the regions with higher temperatures and lower strain rates. Chen et al. also found that the fast rate of dislocation accumulation can reduce the incubation period at higher temperature and lower strain rates, causing DRX easily occur [Reference Chen, Cui, Ou and Long38].
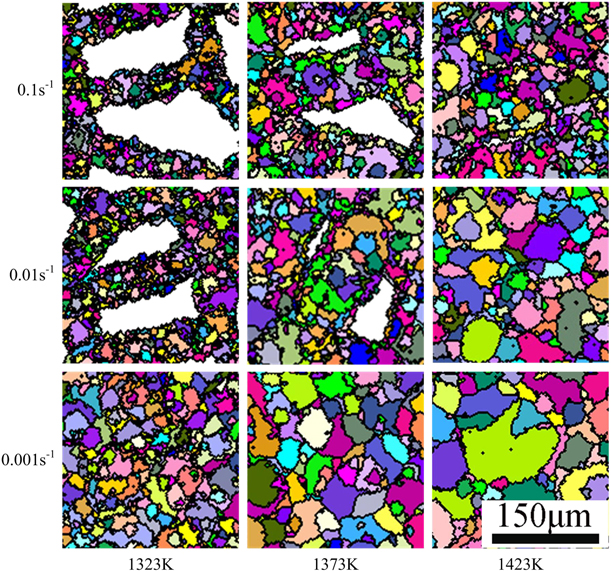
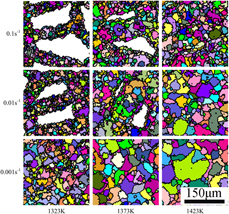
Figure 8 shows the simulated morphologies of microstructure at different hot compression conditions. It clearly depicts that DRX is thermal activated, in which the values of DRX nucleation rate and grain boundary migration velocity are smaller at lower temperatures [Eqs. (5) and (6)]. And the rate of mobile dislocation generation would become slower with the increasing strain rate [Eq. (1)], causing more difficult for the occurrence of DRX. With the increasing temperature and decreasing strain rate (from left-up corner to the right-down corner in Fig. 8), DRX becomes easy to occur and grain growth can be found. Therefore, in order to achieve fine and equiaxed grain microstructure, optimum processing parameters can be defined using the developed CA model.
The CA simulated morphologies of the grain structure of C276 superalloy at the strain of 1.0.

The microstructure evolution and flow behavior of C276 superalloy have been successfully simulated using the developed CA model. Moreover, the CA model is capable of simulating the deformation with time-varied strain rates or temperatures, which are more similar to actual production conditions. The verification of CA model also demonstrates the validity of the theoretical models in CA. It should be pointed out that the crystal orientation of grains has not been considered in the developed CA model. Generally, the distributions of deformation strain and dislocation density at mesoscale are supposed to be heterogeneous because of the grain orientation. And the growth of DRX nucleus also depends on the misorientation between the recrystallized grains and deformed matrix. These situations were simplified in this work. Nevertheless, the results confirm that the developed CA model can predict the flow behavior and microstructure evolution of the tested superalloy during DRX effectively.
Conclusions
A two-dimensional CA model has been developed in this work to model the DRX behavior of C276 superalloy. The evolution of microstructure, flow behavior, grain size and recrystallization kinetics during DRX were analyzed. The main conclusions are as follows:
(1) The models of dislocation density evolution, nucleation and growth of DRX grains were developed and integrated to a CA model to model the DRX behavior of C276 superalloy. The work hardening parameter k 1 and the dynamic recovery parameter k 2 were described as a function of Zener–Hollomon parameter. The activation energy of DRX was determined by experiments. Some of the parameters were optimized by comparing the kinetics of DRX of CA with the experimental results.
(2) The flow behavior, microstructure evolution and DRX kinetics calculated using CA show reasonable agreements with the experiments, indicating that the developed CA model is capable of monitoring the microstructure evolution and flow behavior synchronously. Since the CA model is based on the accumulation of dislocation stored energy and restoration through DRX, the developed CA model is supposed to be capable of predicting the microstructure and flow behaviors in both isothermal and non-isothermal compression conditions.
(3) The DRX behavior of C276 superalloy has close relations with the processing parameters, including deformation temperature, strain, and strain rate. The tested superalloy has a high tendency for the occurrence of DRX. But fine and homogeneous grain structures can only be obtained around 1323 K & 0.001 s−1 and 1423 K & 0.1 s−1.
Material and physical experiments
The commercial C-276 superalloy with the chemical compositions (wt%) of 16.34Mo–16Cr–5.98Fe–3.46W–0.4Mn–0.25Co–0.16V–0.04Cu–0.01Si–0.005P–0.004C–(Bal)Ni was used. It is a Ni–Cr–Mo-based superalloy with little C to improve weldability. The as-received material are commercial bars with diameter of 20 mm, which are in solution and aging state with homogeneous microstructure.
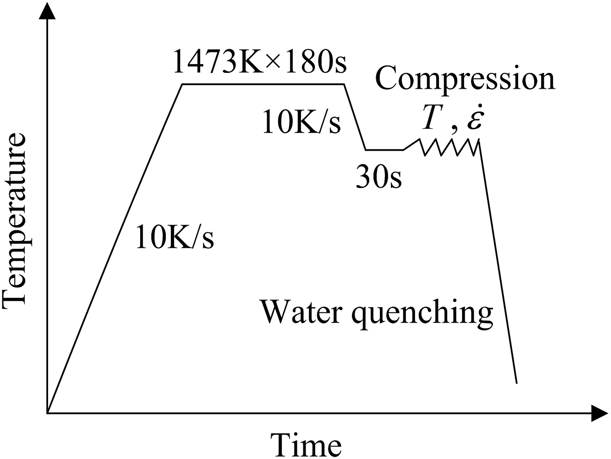
Single-pass isothermal hot compression tests were operated on a Gleeble-1500 (Dynamic Systems Inc., Poestenkill, New York) thermal mechanical simulator to determine the material parameters in CA. Figure 9 is a schematically illustration of the single-pass hot compression tests. Cylindrical specimens with diameter of 8 mm and height of 12 mm were machined from the bars. The specimens were heated to 1473 K at a heating rate of 10 K/s and held for 180 s to get a homogeneous equiaxed grain microstructure. Then they were cooled to 1273 K, 1323 K, 1373 K, 1423 K, 1473 K at a cooling rate of 10 K/s respectively and held for 30 s to eliminate the temperature gradient. Hot compressions to a true strain of 1.0 were performed with strain rates of 0.001 s−1, 0.01 s−1, 0.1 s−1, 1 s−1, 5 s−1, respectively. After deformation, the specimens were directly water quenched.
Schematically illustration of single-pass hot compression test.

Microstructure observation was conducted to evaluate the CA simulation results. The quenched specimens were sectioned parallel to the compression axis. Then the mechanically polished samples were etched in a solution of hydrochloric acid (80 mL), nitric acid (4 mL), and CuCl2 (1 g). The region with a half radius from the compression axis at middle layer was examined using an optical microscope.
Acknowledgment
This work was supported by the National Natural Science Foundation of China (No. 51604058), the major state basic research development program of China (973 program) (No. 2015cb057305), the Open Research Fund from the State Key Laboratory of Rolling and Automation, Northeastern University, and the Fundamental Research Funds for the Central Universities of China.