




No CrossRef data available.
Usability of a theory of visual attention (TVA) for parameter-based measurement of attention II: Evidence from two patients with frontal or parietal damage
Published online by Cambridge University Press: 16 December 2005
Abstract
Based on a ‘Theory of Visual Attention’ (TVA), whole and partial report of brief letter arrays is presented as a diagnostic tool to estimate four clinically significant attentional components: perceptual processing speed, visual working memory storage capacity, efficiency of top-down control, and spatial distribution of attention. The procedure used was short enough to be applicable within a standard clinical setting. Two brain-damaged patients, selected based on lesion location and neuropsychological test profile, were compared to a control group of 22 healthy subjects. One patient with a right inferior parietal lesion showed a pattern of non-spatially and spatially lateralized attention deficits that is typically found in neglect patients. Results from the second patient supported the decisive role of superior frontal brain structures for top-down control of visual attention. This double dissociation supports the hypothesis that, even with a short version of whole and partial report, valid and meaningful results can be obtained in the neuropsychological assessment of attention deficits. The potential and constraints of TVA-based parameter estimation for the clinical application are discussed. (JINS, 2005, 11, 843–854.)
Keywords
Information
- Type
- Research Article
- Information
- Journal of the International Neuropsychological Society , Volume 11 , Issue 7 , November 2005 , pp. 843 - 854
- Copyright
- © 2005 The International Neuropsychological Society
INTRODUCTION
A companion study (Finke et al., 2005) suggested that short whole and partial report procedures in combination with a theory of visual attention (TVA; Bundesen, 1990) provide reliable and meaningful estimates of four clinically significant attention parameters: perceptual processing speed, working memory storage capacity, spatial distribution, and top-down control. However, this study examined neurologically healthy subjects, only. Therefore, to allow conclusions as to its clinical validity, the present study examined the TVA-based approach in two patients with frontal and, respectively, parietal damage. The results show that this assessment tool is able to disclose a double dissociation of attentional impairments.
We started from Duncan et al.'s (1999) study of neglect patients suffering from right inferior parietal brain damage. These patients had spatially non-lateralized attention deficits with respect to perceptual processing speed and working memory storage capacity. Furthermore, the expected ipsi-lesional spatial bias of attention was found, while top-down control of attention was largely preserved. This pattern suggests that spatial distribution of attention and top-down control are independent attentional components supported by separate cerebral structures. Given these findings, in order to evaluate the TVA-based short diagnostic tool with respect to its clinical validity, we focused on the following two questions: (1) Would we obtain the same pattern of impaired and intact attentional functions as Duncan et al. (1999) in a single patient with right inferior parietal damage? (2) Would it be possible to find the reverse pattern—unbiased spatial attention but impaired top-down control—in a second patient with a frontal lobe lesion? The patients were tested in a typical rehabilitation setting, and selected based on lesion location as revealed by CT-scans and the results of standard clinical neuropsychological testing.
GENERAL METHOD
Participants
Case reports
Patient EG: Patient EG is a 48-year-old male industrial mechanic who collapsed on the way to work and subsequently developed blurred speech and an increasing weakness of his left side. Computer-assisted tomography (CT) revealed a right-sided medial cerebral artery infarction. Another CT scan taken three months later (see Fig. 1) indicated a rather large lesion within the right hemisphere, affecting basal ganglia structures, inferior frontal areas, and the temporal lobe, extending to parietal regions, including the angular gyrus.

CT-scan (horizontal slices) of patient EG.
The neuropsychological examination (summarized in Table 1) suggested major problems in psycho-motor speed, short-term and working memory, and spatial attention. Executive functions, on the other hand, seemed to be largely unaffected.
Results of the neuropsychological assessment of patients EG and DG

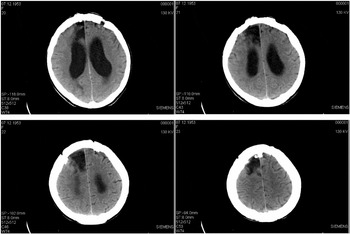
Patient DG: Patient DG is a 58-year-old female retired shop assistant. She underwent neurological examination due to gait ataxia and a left-sided dysdiadochokinesia. Magnetic resonance imaging (MRI) revealed a colloid cyst of the third ventricle blocking the inter-ventricular foramen. During neurosurgical intervention, DG suffered from an anterior cerebral artery infarction. After surgery, she presented with a left-sided hemiparesis, incontinence, reduced vigilance, impaired apprehension and orientation, and psycho-motor slowing. A CT scan obtained two months later revealed a dilation of the lateral ventricles, and a circumscribed right frontal paramedian lesion (see Fig. 2) affecting the superior frontal gyrus.

CT-scan (horizontal slices) of Patient DG.
The neuropsychological assessment (summarized in Table 1), also performed two months after the infarction, showed normal intelligence and short-term memory functions, and there were no signs of spatial inattention. DG mainly suffered from a mild deficit in executive control functions, which might also explain difficulties in maintaining preparedness in a simple response time task without external cueing (“tonic alertness”).
Control group
Twenty-two healthy participants (14 females, 8 males; age: 40–69 years, M = 52.5, SD = 9.3) were tested as control subjects and paid for their participation. Mean IQ was M = 115.8 (SD = 14.0, Range = 91–143). They all had normal or corrected-to-normal vision. None of them reported any history of neurological or psychiatric disorders, and had any experience with tests involving brief stimulus presentation.
Stimuli and General Method
Informed consent according to the Declaration of Helsinki II was obtained from all participants. Basic visual perceptual functions were screened to exclude basic sensory impairments (e.g., gross visual field defects). Testing occurred in two experimental sessions, separated by a few days, with the partial-report condition performed in the first and the whole-report condition in the second session. Each session took 30–40 minutes to complete, including breaks, which were allowed as required by the participants.
Patients were tested in the hospital, control subjects in a laboratory at the University of Eichstaett-Ingolstadt. Experiments were computer-controlled and conducted in a dimly lit room, with a small lamp positioned behind the monitor as the only luminance source. Stimuli were presented on a 17′′ VGA monitor (screen refresh rate 70 Hz, resolution 1024 × 768). Viewing distance was approximately 50 cm.
The partial- and whole-report tasks were conducted identically to the procedure described in our companion study (Finke et al., submitted; see there for experimental details). The general procedure for a single experimental trial is shown in Figure 3 and was the same for both tasks. Subjects fixated a white digit, randomly drawn from the set {0,1,…9}, then a letter display was presented for a pre-specified exposure time, after which subjects reported either all letters (whole-report) or only red letters (partial-report). Subjects were instructed to focus the digit and maintain fixation at its location; the importance of fixating the central marker at the start of each trial was strongly emphasized. Maintenance of fixation was monitored by the experimenter, especially during the testing of patients.a
Although eye movements occurred occasionally, these were unlikely to systematically affect performance, due to the short stimulus exposure times (e.g., in partial report, used to assess the spatial distribution of attention, the maximum exposure duration was only 157 ms) and the unpredictable presentation of the stimuli in the left and right visual hemi-fields. Maintenance of fixation was not video-controlled, however, and trials on which eye movements occurred were not excluded from analysis.

An example trial in the whole-report experiment. First, a white digit is presented that has to be fixated by the subject. Then, the letter display is presented for a pre-determined exposure duration. In masked trials (example), white square masks are presented at each previous letter position. The figure shows an example whole report display with a five-letter column on the left side.
The reported letters were entered into the computer by the experimenter. In this way, all reported letters were recorded. Occasionally reported letters that had not been displayed before (“false positives”) were also registered, but not analyzed any further.
PARTIAL REPORT
TVA has strong relations to the biased-competition view of selective visual attention, on which objects compete for representation within brain areas processing visual information (Desimone & Duncan, 1995). Competition can be biased by bottom-up sensory or top-down task-related factors. “Preferred” objects gain greater competitive strength because they receive higher attentional weighting, and are selected (i.e., represented within the processing system) with higher probability. For clinical purposes, two weighting aspects are of particular interest: first, the ability to process objects in both visual hemi-fields equivalently (spatial distribution of attention); second, the ability to confer a competitive advantage to (target) objects relevant to the task at hand and, thus, to prevent interference by irrelevant (distractor) objects (efficiency of top-down control).
Empirically, attentional weighting of an object can be estimated by combining TVA with a partial-report paradigm (see Fig. 4). In this task, one or two letters are presented at one or two out of four possible locations (one in each display quadrant), and subjects have to report only those (target) stimuli that belong to a pre-specified category (e.g., color: red items), whilst ignoring distractors (e.g., green items). Each subject's accuracy in performing this task is fitted by the TVA computational model (see Kyllingsbæk, in press, for mathematical details), using a maximum-likelihood procedure. This produces estimates of the attentional weight (w) assigned to a target or, respectively, distractor at each of the four locations. From these eight weight estimates (four targets and four distractors), it is possible to derive parameters reflecting spatial distribution of attention (parameter wλ), and efficiency of top-down control (parameter α).

Different trial types in the partial-report experiment with targets (depicted as “T”) and distractor letters (depicted as “D”). Targets and distractors differed with regard to color. Presentation of a single target (at the top), of a target accompanied by a distractor in the same or the opposite visual hemi-field (left and right center) and of two targets in the same or in opposite hemi-fields (bottom left and right).
Parameter wλ indicates whether attentional weighting of objects—averaged across targets and distractors is equal in the left and the right visual hemi-field. If objects in the left visual field receive the same amount of attentional weighting as those in the right field (i.e., wL = wR), the spatial lateralization parameter wλ = wL /(wL + wR) equals 0.5. By contrast, greater weighting of objects within the right hemi-field, as in visual neglect, is reflected in values of wλ < 0.5, denoting a rightward bias of spatial attention.
Parameter α indicates whether—averaged across locations—attentional weighting of targets is greater than that of distractors. If so, the ratio between distractor and target weights (wD /wT), expressed by α, would be less than 1, with lower α-values indicating more efficient top-down control. Impaired control functions, by contrast, would give rise to equally weighted target and distractor processing, increasing α to approach 1.
In neglect patients suffering from right inferior parietal damage, Duncan et al. (1999) found an ipsilesional spatial bias, while top-down control functions were largely preserved. The authors concluded that task-related weighting of attention is not a function of parietal, but of frontal areas. Habekost & Bundesen (2003) presented the first case with an inferior frontal lesion (patient GL) examined by a TVA-based partial-report procedure. GL's top-down control functions were found to be unimpaired, however. These authors, therefore, assumed voluntary control of visual attention to be more strongly reliant on superior frontal areas. The results of these two studies would thus predict a double dissociation between superior frontal and inferior parietal brain damage with respect to task-related and, respectively, spatial weighting of objects. We tested this prediction in patients EG and DG, and expected to find intact spatial weighting, but impaired task-related weighting for DG, whereas the reverse pattern for EG.
METHOD
Red letters were pre-defined as targets (to be reported), and green letters as distractors (to be ignored). On each trial, either a single target letter, a target letter and a distractor letter, or two target letters were presented (see Figure 4). The letters were presented at the corners of an imaginary square centered on fixation. On trials with dual stimuli, letters were always arranged in either rows or columns. Conditions were presented in random order and with equal frequency within each block of 48 trials. Four blocks (a total of 192 trialsb
As pointed out in our complementary paper (Finke et al., 2005), 192 trials may not be enough to obtain sufficiently reliable data in the partial report experiment. Therefore, we initially aimed at a test length of 288 trials. However, we had to abandon this aim due to the time constraints imposed by the hospital routine. Therefore, we decided to conduct the experiment with 192 trials only.
A constant stimulus exposure duration was used for each participant, determined individually in a preliminary test phase, to equate the baseline performance across participants. The test phase presented 32 trials with masked single targets displayed for 100 ms, to ascertain whether a subject could report the letter correctly with a probability in the 60–80% range. If a subject's accuracy was outside this range (i.e., either < 60% or > 80%), the following adjusted exposure durations were used: 157 ms (for accuracy < 50%); 128 ms (for accuracy between 50–60%); 86 ms (for accuracy between 80–90%); 71 ms (for accuracy > 90%).c
This procedure was based on preliminary (pilot) experiments, guided by the information provided by previous TVA-based studies (Duncan et al., 1999; Habekost & Bundesen, 2003). The same applies to the determination of exposure durations in whole report.
RESULTS
Accuracy Data
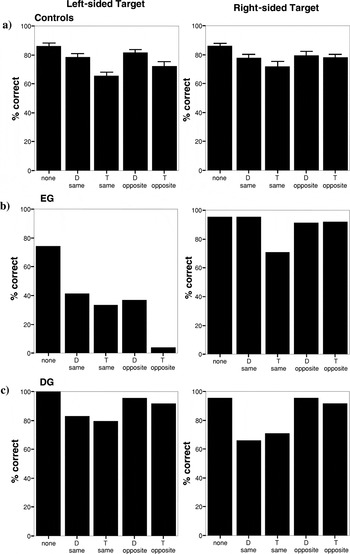
Figure 5 shows the mean accuracy scores for patients and control subjects in each condition, separately for the left and right visual fields. The performance pattern found in control subjects resembles that from earlier reports (Duncan et al., 1999; Habekost & Bundesen, 2003). There were only minor differences between the two hemi-fields. In general, accuracy was highest when only a single target was presented, and it was lower when a target was presented together with a distractor or, respectively, a second target, with the latter causing a more marked decrement. The decline in accuracy seemed to be stronger when a target was accompanied by an additional stimulus in the same, as compared to the opposite, hemi-field, and a second target appeared to reduce accuracy more strongly for left-sided, as compared to right-sided, targets.

Partial report results. Mean percentage of correctly reported targets presented either in the left or the right hemi-field for the control group (a), patient EG (b), and DG (c). Each bar represents the mean in one condition: Target presented alone, target accompanied by a second target (T) in the same hemi-field, target accompanied by a distractor (D) in the same hemi-field, target accompanied by a distractor in the opposite hemi-field, target accompanied by a second target in the opposite hemi-field. The error bars in Figure 5a represent the standard errors in the control group.
In contrast, patient EG showed a clear field effect: relatively high accuracy for the right, but a substantial decrement for the left hemi-field. This was true even for single targets. In conditions with dual stimuli, the decline in accuracy was substantial, with a left-sided target being more or less extinguished when accompanied by a right-sided target. In contrast, accuracy for right-sided targets was only minimally affected by accompanying stimuli on the left side. Finally, when a right-sided target had to be reported, distractors on the same (right) side could be efficiently ignored.
Patient DG, like the control subjects, displayed hardly any left-right differences in accuracy. With single targets, accuracy was nearly perfect for both hemi-fields. However, at least when dual stimuli were presented within the same hemi-field, her accuracy decrement due to a second stimulus was as large with an accompanying distractor as with a second target.
Taken together, the distribution of the raw data suggested a clear attentional bias towards right-sided stimuli in patient EG, while patient DG mainly had difficulties in differentiating targets from distractors.
Parameter Estimates
TVA-model based estimates of attentional weights were determined for each participant that represented the best fit of her/his partial-report performance. The quality of fit of the TVA model to the empirical data for each participant is indicated by the correlation between the observed position scores (the probability of reporting a letter at a given display position in a certain experimental condition) and those predicted by the TVA model. The average correlation between the observed and predicted scores was r = .88 for the control group (range: .65–.97)d
The mean correlation was computed after the correlations had been z-transformed according to Fisher. The same applies for the average correlation as seen in whole report.
The bootstrap method is an alternative to repeating an experiment in order to measure the reliability of parameter estimates (see Efron & Tibshirani, 1993). Instead of repeating the experiment several times, the data is resampled with replacement several times, yielding a number of so called bootstrap samples. In the present implementation, the bootstrap sampling is done within conditions, so that the number of trials per condition is the same as in the original experimental data sample. This ensures that the model may be estimated successfully for every possible bootstrap sample. After each bootstrap sample has been made, the model is estimated and the bootstrap parameter estimates are stored. When enough bootstrap estimates have been made (usually about 200), the standard error of each parameter may be estimated by simply calculating the sample standard deviation of the bootstrap estimates (see also Finke et al., 2005, and Kyllingsbæk, in press, for further details).
Partial-report parameter estimates for patients and control subjects

Due to the broad age range of the participants, we assessed a possible relationship between parameter estimates and age. None of the calculated correlations between age and each of the parameter estimates reached significance (highest r-value: r = .15, all P > .50).
Spatial Distribution of Attention
Estimates of wλ (M = 0.48; S.D. = 0.09) indicated equally distributed spatial attention in the control group, but a strong rightward spatial bias for patient EG (wλ = 0.06). His value deviated significantly from the control group mean (P < .01, one-tailed binomial test) and was below the value for any of the control subjects. In contrast, patient DG's estimate (wλ = 0.50) was virtually identical to the control group mean, indicative of unimpaired spatial attention.
To differentiate between true attentional and pure sensory effects of stimulus processing, the TVA model additionally provides parameter estimates for basic sensory processing. They are reflected by A parameters determined for each of the four possible stimulus locations. A parameters, which are independent of attentional weighting, are derived from the accuracy for each (target) location in the single-target condition. Congruent with the wλ value for spatial attentional weighting, equal sensory processing of stimuli in both visual hemi-fields is indicated by an Aλ value of 0.5 [Aλ = AL /(AL /AR)]. Aλ values above and below 0.5 indicate better sensory processing on the left and on the right side, respectively. The obtained Aλ values are also provided in Table 2.
Aλ values (M = 0.52; S.D. = 0.11) confirmed symmetrical sensory effectiveness in both hemi-fields for control subjects. Patient EG displayed a highly significant difference in sensory processing between the two visual hemi-fields, with better function in the right visual field (Aλ = 0.28; P < .01, one-tailed binomial test). In contrast, patient DG (Aλ = 0.73) showed more efficient sensory processing in the left visual field (P < .01, one-tailed binomial test).
Efficiency of Top-Down Control
The parameter estimates for the efficiency of top-down control (α) varied considerably within the control group (M = 0.51; S.D. = 0.31), a finding that has already been reported elsewhere (e.g. Duncan et al., 1999). Patient EG (α = 0.08) showed very high efficiency of top-down control; in fact, none of the control subjects' scores was below this value. In contrast, efficiency of top-down control was significantly impaired in patient DG (α = 1.18; P < .01, one-tailed binomial test).
DISCUSSION
Partial report revealed the predicted double dissociation between two patients with right-hemispheric brain damage: a rightward spatial bias, but intact top-down control after a lesion affecting inferior parietal regions (patient EG), and impaired top-down control in presence of unbiased spatial attention following a superior frontal lesion (patient DG).
Patient EG's performance closely corresponded to the results reported by Duncan et al. (1999) for their group of neglect patients, who also suffered from right inferior parietal damage. Like these patients, EG displayed reduced sensory effectiveness in the left visual field, a strong rightward spatial bias of attention, and intact top-down control functions. This pattern also agrees with a recent study emphasizing the role of inferior parietal lesions in unilateral neglect (Mort et al., 2003). EG's efficient top-down control was mainly due to excellent target-distractor selectivity in the right hemi-field, only (see Fig. 5). A separate estimate of the α values for the left hemi-field is inappropriate, however. Estimates of α inherently tend to vary relatively strongly, because α is the ratio of the weight for distractors divided by the weight for targets. If, as was the case with patient EG, both weights are close to zero in the left hemi-field (targets: w = 0.03; distractors: w = 0.05), a small variability in the weight estimates causes a large variability in the α estimate. As a result, such an estimate would not have the desired validity in a patient with hemi-neglect (Kyllingsbæk, in press). Additionally, due to the small weighting of the left hemi-field stimuli, they have only a minimal effect on the resulting α-value, which is almost exclusively determined by the right hemi-field stimuli. Consequently, EG's top-down control can be considered intact within the (intact) right hemi-field.
The impairment of top-down control in patient DG confirms previous claims that the superior frontal cortex is critically involved in this function. Stuss et al. (2001) have suggested that the superior medial frontal cortex (mainly on the right side) is required for implementing and maintaining a consistent activation of an intended response mode—for example, to name the colors, rather than read the words, in the Stroop task. A similar requirement may be inherent to the partial-report task, that is, activating and maintaining the intention to report red letters instead of green ones. Also, Corbetta & Shulman (2002) have recently proposed that a dorsal system, comprising the superior frontal cortex and the superior parietal lobe, is involved in setting up and implementing goal-directed selection of stimuli and responses.
Our present finding of a double dissociation diverges somewhat from a recent group study using TVA. Peers et al. (2005) found patients with both frontal and parietal lesions to show top-down control deficits together with an ipsi-lesional spatial bias. Interestingly, the degree of both impairments was correlated with lesion volume. Unfortunately, we were unable to compare lesion volume between EG and DG with the anatomical data available. However, an explanation based on lesion volume alone would be incompatible with any finding of a double dissociation between spatial bias and top-down control impairments. Assuming a larger lesion in patient EG, as suggested by inspection of the CT scans, his larger spatial bias would be consistent with the results of Peers et al. At the same time, it would also predict greater impairment of top-down control in EG, contrary to our finding. On the other hand, patient DG, additionally to her frontal lesion, had a significant enlargement of the lateral ventricles pointing to a possible reduction of fibre tracts connecting frontal and parietal areas. In agreement with Corbetta & Shulman (2002), this would be compatible with a critical role of a dorsal fronto-parietal system in implementing top-down control. Clearly, further studies are needed to assess the impact of lesion volume and lesion location more specifically. Differential involvement of cortical versus white matter damage may be a key feature for resolving this issue.
WHOLE REPORT
In TVA, selection of an object corresponds with its encoding into a visual working memory store which has a limited capacity of n = K elements. Competition for selection is modeled as a stochastic race for encoding with the fastest K objects to reach the visual working memory store first being selected. Then the store is filled, and the race terminates. The speed of an object in the race is given by its processing rate parameter v. It depends on the attentional weight an object receives, related to the total amount of attentional capacity (weight) that is distributed across all objects in the visual field (see Kyllingsbæk, in press).
Processing speed and working memory storage capacity, the two general efficiency aspects of the processing system, are assessed in a whole-report experiment (see Fig. 3), in which aspects of spatial or task-related weighting are irrelevant. Five letters are briefly presented, for variable exposure durations, in a column either within the left or the right hemi-field, and subjects have to report as many items as possible. In this task, performance accuracy as a function of presentation time is represented by an exponential growth function. It is fitted (based on a maximum-likelihood procedure) by the TVA computational model (see Kyllingsbæk, in press). Thereafter, estimates can be derived for the growth parameter of the exponential curve (parameter C, derived from the rate parameters v for each single object) and for the asymptote of the curve (parameter K). Parameter C (estimated separately for each hemi-field, CL, CR), reflects processing speed (the number of elements that can be processed per second). Parameter K (also estimated separately for each hemi-field, KL, KR), reflects the capacity of the working memory store (the number of elements that can be maintained in parallel).
In neglect patients, Duncan et al. (1999) found reduced perceptual processing speed and working memory storage capacity within both visual hemi-fields. Moreover, patients tended to process objects faster within the right compared to the left visual field. We tested the prediction that a similar pattern would prevail for patient EG with a whole report task.f
Of course, we would have also been interested to evaluate perceptual speed and working memory storage in patient DG. However, the patient was released from the hospital after having performed the partial-report experiment, as a result of which we were no longer able to conduct the whole-report experiment with patient DG.
Method
On each trial, a column of five equidistant letters, either all green or red, was presented either to the left or to the right of fixation (see Finke et al., 2005). Subjects had to report as many letters as possible. Three exposure durations were determined in a pre-experimental session, which comprised 24 trials with letter columns presented for 157 ms, followed by a mask. If a subject reported, on average, at least one letter (20 %) correctly per trial, then 157 ms were used as intermediate, 86 ms as short, and 300 ms as long exposure durations; this was the case for patient EG and for eight control subjects. If a subject performed below the criterion (20% correct per trial), longer exposure durations of 157, 300, and 600 ms, were used; this was the case for 13 control subjectsg
This relatively large proportion of subjects requiring longer exposure durations for the test proper seemed to be related to the higher age of these subjects.
Results
Raw data
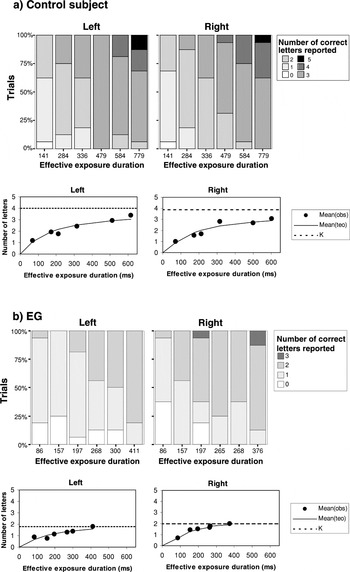
Figure 6 presents the results for a typical control subject (aged 40 years) and for patient EG. The control subject showed a typical data pattern. Initially, accuracy of letter report rose steeply with increasing exposure duration. Later, performance approached an asymptote at about 3–4 letters. This pattern was comparable for both the left and the right visual field.

Whole report performance in the left and the right hemi-field (a) for a typical control subject (aged 40 years), representing the performance of the control group (Kleft = 4.0, Kright = 3.9; Cleft = 29, Cright = 24) and (b) for patient EG . The upper half of each panel shows, separately for each visual hemi-field and effective exposure duration, the proportion of trials on which 0, 1, 2, 3, 4, or 5 letters were correctly reported. The lower half of each panel presents the mean number of correctly reported letters as a function of effective exposure duration, separately for each visual field. Filled circles indicate observed values, solid lines represent the best fits of the observed scores by the TVA model. The origin of each curve was normalized to the perceptual threshold t0. The estimate of the visual working memory capacity K is marked by a dashed horizontal line. (teo: theoretical; obs: observed).
Patient EG clearly had a lower limit at about 2 letters. Also, increasing exposure duration had a much smaller effect. That is, EG exhibited a much slower rate of performance increase with increasing exposure duration, and the rate seemed to be especially low in the left visual field.
Parameter estimates
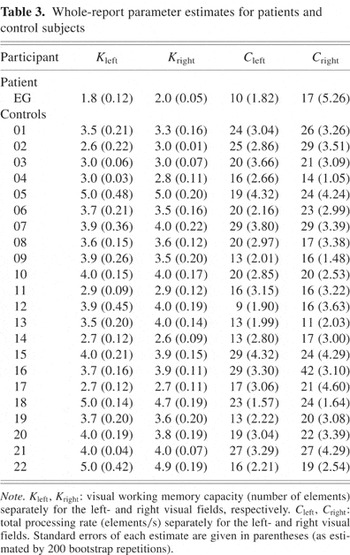
TVA-based quantitative descriptions of the whole-report data pattern were derived for each subject. In particular, separately for each visual hemi-field, estimates for processing speed (CL, CR) and working memory storage capacity (KL, KR) were obtained. TVA also provides estimates for the minimum effective exposure duration (t0), below which nothing is perceived, and for the effective additional exposure duration of an unmasked display (sensory store, parameter μ). These two latter estimates are not considered any further, here (details are available from the authors). The scores predicted by the individual TVA-models correlated, on average, with the observed scores across the twelve task conditions with r = .97 (range: .83–.99) for control subjects, and r = .99 for patient EG. Table 3 presents the parameter estimates (together with standard errors, again derived from the bootstrapping procedure) obtained for each subject. For working memory storage capacity, the estimates appeared quite robust; for perceptual processing speed, the estimates were more variable.
Whole-report parameter estimates for patients and control subjects

Perceptual processing speed
In the control group, the mean values for perceptual speed were 19.5 (SD = 5.8) for CL and 21.7 (SD = 6.6) for CR; the difference between the two hemi-fields was significant (t(21) = −2.63, P < .05). There was also a significant correlation of perceptual processing speed with age (r = −.63 for CL, r = −.65 for CR, both P < .01). The six eldest subjects (60–69 years) had significantly slower perceptual speed scores than the sixteen younger subjects (40–59 years; t(20) = 2.89, P < .01 for CL, t(20) = 2.56, P < .05 for CR).
For patient EG, the scores were CL = 10 and CR = 17. Both values were significantly reduced compared to the younger subjects (40–59 years). Each of these control subjects exhibited higher CL values than EG (P < .01 by a one-tailed binomial test), and only three of them had a CR score equal or lower than that of EG (P < .05 by a one-tailed binomial test). Thus, the perceptual speed of patient EG was reduced on both sides, but more markedly so in the left visual field.
Storage capacity
Within the control group, there was no systematic relationship of storage capacity with age (r = −.15 for KL, r = −.08 for KR, both P > .50). The same mean values, 3.7, were obtained for KL and KR (SD = 0.7). This is close to the score of about 4 typically reported for working memory storage capacity (cf. Cowan, 2001; Luck & Vogel, 1997). Table 3 shows that patient EG (KL = 1.8; KR = 2.0) had a lower working memory storage capacity than control subjects (P < .01, one-tailed binomial test), for both visual hemi-fields; there was no difference between the left and the right side.
DISCUSSION
Patient EG had a reduction of both working memory storage capacity and perceptual processing speed within both visual hemi-fields. These spatially non-lateralized attentional deficits agree with those found in neglect patients by Duncan et al. (1999). However, Duncan et al. generally found higher K values even for control subjects (K = 4.0, calculated from Duncan et al., 1999, Table 3), despite the fact that their control subject's average age (68 years) was higher than that of ours. This could be due to the larger trial number used in their study. Since working memory storage capacity essentially reflects the maximum number of letters reported correctly on any one trial within the experiment, a larger number of trials may increase the chance to report the maximum number.
Patient EG's performance is compatible with the assumption suggested by Husain & Rorden (2003), and Peers et al. (2005), that the right inferior parietal cortex/temporo-parietal junction region may be critically involved in supporting non-spatially lateralized attention functions, such as processing speed and working memory storage capacity, in both visual hemi-fields.
CONCLUSION
Our results suggest that combining TVA with whole- and partial-report represents an efficient diagnostic tool for assessing attention deficits. Critical advantages arise compared to paper and pencil tests. For example, both patients performed deficiently on the d2 and BIT cancellation tasks and, based on these results alone, it would be difficult to decide whether impairment is related to spatial bias or deficient top-down control. Moreover, using a TVA-based approach, nonspatial aspects of perceptual processing speed and working memory storage capacity can be identified which are not easily detected with standard paper and pencil tests. This is important for guiding appropriate treatment, since strategies that focus on improving non-spatial aspects of attention are obviously needed. After all, rehabilitation for spatial impairment appears not to work in all patients (Ferber et al., 2003; Jalas et al., 2002). In sum, the possibility provided by a parameter-based approach to address separate aspects of attention independently appears as a major strength. It results both from the coherent theoretical framework provided by TVA, and from the consistent methodology assessing different aspects with highly comparable stimuli and response requirements.
Of course, a number of important constraints should not be ignored. For example, testing aphasic patients will be difficult using a tool requiring letter report. Second, instead of using a time-consuming computational bootstrapping procedure to obtain reliability estimates, it would seem preferable to collect normative data, to standardize them with reliability and validity coefficients, and to subsequently apply them for psychometric single-case analyses along the lines proposed, for instance, by Huber (1973). Certainly, such normative data would also help to establish the normal range for the parameter values, which is not in all cases known at present (e.g., some control subjects had rather high α-values, whereas none fell below that of patient EG). Third, the procedures—although significantly shortened—nevertheless involve rather intensive, computer-based testing, and as such are hardly suited for bedside testing as well as screening of patients at early stages of brain damage.
ACKNOWLEDGMENTS
We wish to thank Petra Boehm and Sybille Redl for assistance with data acquisition, and Claus Bundesen and Thomas Habekost for valuable discussions. We are also grateful to three reviewers and the associate editor for valuable comments on an earlier draft of this paper. A substantial part of this work was done at the former affiliation of P.B. and K.F., the University of Eichstaett-Ingolstadt, Germany. Preliminary results of this study were presented at the Joint Meeting of the International Neuropsychological Society and the German Society for Neuropsychology 2003, in Berlin, Germany. This work was supported by the Deutsche Forschungsgemeinschaft (project Mu 773/6-1). S.K. was supported by grants from the Carlsberg Foundation and the National Research Foundation for the Humanities.
References
REFERENCES
Bäumler, G.
(1985).
Farbe-Wort-Interferenztest (FWIT) nach J. R. Stroop.
Goettingen:
Hogrefe.
Brickenkamp, R.
(1994).
Test d2. Aufmerksamkeits-Belastungs-Test.
Goettingen:
Hogrefe.
Corbetta, M. &
Shulman, G.L.
(2002).
Control of goal-directed and stimulus-driven attention in the
brain.
Nature Reviews Neuroscience,
3,
201–215.Google Scholar
Cowan, N.
(2001).
The magical number 4 in short-term memory: A reconsideration of
mental storage capacity.
Behavioral and Brain Sciences,
24,
1–68.Google Scholar
Desimone, R. &
Duncan, J.
(1995).
Neural mechanisms of selective visual attention.
Annual Review of Psychology,
18,
193–222.Google Scholar
Duncan, J.,
Bundesen, C.,
Olson, A.,
Humphreys, G.,
Chavda, S., &
Shibuya, H.
(1999).
Systematic analysis of deficits in visual attention.
Journal of Experimental Psychology: General,
128,
450–478.Google Scholar
Efron, B. &
Tibshirani, R.J.
(1998).
An Introduction to the Bootstrap.
London:
Chapman & Hall.
Ferber, S.,
Danckert, J.,
Joanisse, M.,
Goltz, H.C., &
Goodale, M.A.
(2003).
Eye movements tell only half the story.
Neurology,
60,
1826–1829.Google Scholar
Finke, K.,
Bublak, P.,
Krummenacher, J.,
Kyllingsbæk, S.,
Müller, H.J., &
Schneider, W.X.
(2005).
Usability of a theory of visual attention (TVA) for parameter-based
measurement of attention I: Evidence from normal subjects.
Journal of the International Neuropsychological Society,
11,
832–842.Google Scholar
Habekost, T. &
Bundesen, K.
(2003).
Patient assessment based on a theory of visual attention (TVA):
Subtle deficits after a right frontal-subcortical lesion.
Neuropsychologia,
1578,
1–18.Google Scholar
Härting, C.,
Markowitsch, H.J.,
Neufeld, H.,
Calabrese, P.,
Deisinger, K., &
Kessler, J.
(2000).
Wechsler Gedächtnis Test—Revidierte Fassung: Deutsche
Adaptation der revidierten Fassung der Wechsler Memory Scale.
Bern:
Verlag Hans Huber.
Huber, H.P.
(1973).
Psychometrische Einzelfalldiagnostik.
Weinheim:
Beltz.
Husain, M. &
Rorden, C.
(2003).
Non-spatially lateralized mechanisms in hemispatial neglect.
Nature Reviews Neuroscience,
4,
26–36.Google Scholar
Jalas, M.J.,
Lindell, J.A.,
Brunila, T.,
Tenovuo, O., &
Hämäläinen, H.
(2002).
Initial rightward orienting bias in clinical tasks: Normal subjects
and right hemispheric stroke patients with and without neglect.
Journal of Clinical and Experimental Neuropsychology,
24,
479–490.Google Scholar
Kyllingsbæk, S.
(in press).
Modeling visual attention.
Behavior Research Methods.
Lehrl, S.,
Triebig, G., &
Fischer, B.
(1995).
Multiple choice vocabulary test MWT as a valid and short test to
estimate premorbid intelligence.
Acta Neurologica Scandinavica,
91,
335–345.Google Scholar
Luck, S.J. &
Vogel, E.K.
(1997).
The capacity of visual working memory for features and
conjunctions.
Nature,
390,
279–281.Google Scholar
Mort, D.J.,
Malhotra, P.,
Mannan, S.K.,
Rorden, C.,
Pambakian, A.,
Kennard, C., &
Husain, M.
(2003).
The anatomy of visual neglect.
Brain,
126,
1986–1997.Google Scholar
Oswald, W.D. &
Roth, E.
(1987).
Der Zahlen-Verbindungs-Test.
Göttingen, Germany:
Hogrefe.
Peers, P.V.,
Ludwig, C.J.H.,
Rorden, C.,
Cusack, R.,
Bonfiglioli, C.,
Bundesen, C.,
Driver, J.,
Antoun, N., &
Duncan, J.
(2005).
Attentional functions of parietal and frontal cortex.
Cerebral Cortex.
Advanced online publication, February.Google Scholar
Stuss, D.T.,
Floden, D.,
Alexander, M.P.,
Levine, B., &
Katz, D.
(2001).
Stroop performance in focal lesion patients: dissociation of
processes and frontal lobe lesion location.
Neuropsychologia,
39,
771–786.Google Scholar
Wilson, B.,
Cockburn, J., &
Halligan, P.
(1987).
Behavioural Inattention Test.
Suffolk:
Thames Valley Test Company.
Zimmermann, P. &
Fimm, B.
(1997).
Test for Attentional Performance (TAP).
Herzogenrath:
Psytest.

CT-scan (horizontal slices) of patient EG.

Results of the neuropsychological assessment of patients EG and DG
CT-scan (horizontal slices) of Patient DG.

An example trial in the whole-report experiment. First, a white digit is presented that has to be fixated by the subject. Then, the letter display is presented for a pre-determined exposure duration. In masked trials (example), white square masks are presented at each previous letter position. The figure shows an example whole report display with a five-letter column on the left side.

Different trial types in the partial-report experiment with targets (depicted as “T”) and distractor letters (depicted as “D”). Targets and distractors differed with regard to color. Presentation of a single target (at the top), of a target accompanied by a distractor in the same or the opposite visual hemi-field (left and right center) and of two targets in the same or in opposite hemi-fields (bottom left and right).
Partial report results. Mean percentage of correctly reported targets presented either in the left or the right hemi-field for the control group (a), patient EG (b), and DG (c). Each bar represents the mean in one condition: Target presented alone, target accompanied by a second target (T) in the same hemi-field, target accompanied by a distractor (D) in the same hemi-field, target accompanied by a distractor in the opposite hemi-field, target accompanied by a second target in the opposite hemi-field. The error bars in Figure 5a represent the standard errors in the control group.

Partial-report parameter estimates for patients and control subjects
Whole report performance in the left and the right hemi-field (a) for a typical control subject (aged 40 years), representing the performance of the control group (Kleft = 4.0, Kright = 3.9; Cleft = 29, Cright = 24) and (b) for patient EG . The upper half of each panel shows, separately for each visual hemi-field and effective exposure duration, the proportion of trials on which 0, 1, 2, 3, 4, or 5 letters were correctly reported. The lower half of each panel presents the mean number of correctly reported letters as a function of effective exposure duration, separately for each visual field. Filled circles indicate observed values, solid lines represent the best fits of the observed scores by the TVA model. The origin of each curve was normalized to the perceptual threshold t0. The estimate of the visual working memory capacity K is marked by a dashed horizontal line. (teo: theoretical; obs: observed).
Whole-report parameter estimates for patients and control subjects
 You have
Access
- 41
- Cited by