

Introduction
Social network relationships are widely believed to impact on mental health in late life (Kawachi and Berkman, Reference Kawachi and Berkman2001). However, there is still little agreement in the domain of social networks as to what exactly accounts for better psychological state in older age (Zunzunegui et al., Reference Zunzunegui, Beland and Otero2001; Okabayashi et al., Reference Okabayashi, Liang, Krause, Akiyama, Sugisawa and 2004; Merz and Huxhold, Reference Merz and Huxhold2010). A key debate, in this regard, is whether it is the structure of the network or its perceived subjective nature that matters most: that is, is it the quantity or the quality of social relations (Antonucci et al., Reference Antonucci2002).?
There is ample evidence that social connectedness is related to better mental health among older people (Cornwell and Waite, Reference Cornwell and Waite2009; Smith and Hirdes, Reference Smith and Hirdes2009). Correspondingly, lack of social support is a recognized risk factor for psychiatric illness and other disabling conditions (Kristjansson et al., Reference Kristjansson, Breithaupt and McDowell2001). Social connectedness is essentially a reflection of social capital, which has been defined as “the array of social contacts that give access to social, emotional and practical support” (Gray, Reference Gray2009). Studies that examine the association between various aspects of social connectedness and selected health outcomes actually posit a relationship between social network structure and health status (Berkman et al., Reference Berkman, Glass, Brissette and Seeman2000).
Analysis of social network structure among older adults has been challenged, however, by the complex and multifaceted nature of the phenomenon and by the lack of singular measures that effectively capture its varying components. A promising recent development in this regard is the introduction of the construct of social network type into the study of mental health (Litwin, Reference Litwin2001; Fiori et al., Reference Fiori, Antonucci and Cortina2006; Litwin and Shiovitz-Ezra, Reference Litwin, Shiovitz-Ezra and 2010). Such inquiry considers whether embeddedness in different kinds of social network constellations is related to the emotional state of older persons. The findings thus far suggest that people who are embedded in more socially endowed or resourceful network groupings demonstrate better mental health. Socially endowed networks are those with greater social capital, that is, greater support potential. Greater social capital is reflected in a greater number of social ties, a greater diversity of sources of ties and/or a greater intensity of exchange with one's ties. Correspondingly, those who belong to less resourceful networks are at greater risk of poor mental state or psychiatric disorder.
Alongside structural analysis of social network relationships, there is increasing interest in measures of the subjective nature of social relations, as reflected in their perceived benefit or harm. The quality of social network relationships is reflected in indicators of perceived support and perceived strain (Shiovitz-Ezra and Leitsch, Reference Shiovitz-Ezra and Leitsch2010), which may also be termed as positive and negative ties, respectively. Positive ties tend to be stress buffering whereas negative ties generally constitute a source of stress (Cohen, Reference Cohen2004).
Studies show that both positive and negative ties are related to mental health in late life, with positive ties associated with fewer depressive symptoms and negative ties associated with more such symptoms (Finch and Zautra, Reference Finch and Zautra1992; Ha, Reference Ha2010). August and colleagues maintain that negative ties have more severe effects on emotional distress in the context of some stressors but less severe effects in the context of others (August et al., Reference August, Rook and Newsom2007). Newsom and others ask whether it is positive ties or negative ties that affect psychological health more strongly (Newsom et al., Reference Newsom, Nishishiba, Morgan and Rook2003). In one study they reported that positive ties were related to positive well-being only, whereas negative ties were related both to lesser well-being and greater psychological distress (Newsom et al., Reference Newsom, Rook, Nishishiba, Sorkin and Mahan2005). A dominant negative effect of negative ties on psychological well-being has been noted in other research as well (Mavandadi et al., Reference Mavandadi, Sorkin, Rook and Newsom2007b).
The current study examines the associations between social network relationships and depressive symptoms among older adults. Study of depression and its correlates in late life is of much current interest in a wide range of countries (Chi et al., Reference Chi2005; Anstey et al., Reference Anstey, von Sanden, Sargent-Cox and Luszcz2007; Castro-Costa et al., Reference Castro-Costa2007; McDougall et al., Reference McDougall2007; Mechakra-Tahiri et al., Reference Mechakra-Tahiri, Zuzunegui, Preville and Dube2009; Steffens et al., Reference Steffens, Fisher, Langa, Potter and Plassman2009). But, the extent of depression that is considered in such studies varies. Some of them count the number of depressive symptoms whereas others employ clinical cut-off points for diagnosis of probable or major depression disorder. The present study focuses on the presence of a high level of depressive symptoms or psychological distress as measured by the appropriate designated cut-off on the Center for Epidemiological Studies – Depression Scale (CES-D) (Radloff, Reference Radloff1977), a widely employed measure (Zunzunegui et al., Reference Zunzunegui, Beland and Otero2001; Anstey et al., Reference Anstey, von Sanden, Sargent-Cox and Luszcz2007).
Examination of predictors of depression in late life requires controlling for background and health factors known to correlate with mental health measures. These generally include age (Zunzunegui et al., Reference Zunzunegui, Beland and Otero2001), gender (Antonucci et al., Reference Antonucci2002; Navarro et al., Reference Navarro, Andres, Parraga, Morena, Latorre and Lopez-Torres2010), socioeconomic status (Robison et al., Reference Robison, Curry, Gruman, Covington, Gaztambide and Blank2003; Chang et al., Reference Chang, Yang, Tang and Ganguli2009), race/ethnicity and religion (Robison et al., Reference Robison, Curry, Gruman, Covington, Gaztambide and Blank2003; Steffens et al., Reference Steffens, Fisher, Langa, Potter and Plassman2009), and functional and physical health (Bryant et al., Reference Bryant, Jackson and Ames2009; Chang et al., Reference Chang, Yang, Tang and Ganguli2009; Navarro et al., Reference Navarro, Andres, Parraga, Morena, Latorre and Lopez-Torres2010).
Drawing upon the preceding review of the literature, the current inquiry posits two hypotheses:
1. Negative relationship ties are more strongly associated with a high level of depressive symptoms than are positive relationship ties.
2. Older adults embedded in social network types that are characterized by greater social capital have less presence of depressive symptoms than older adults located in networks types having lesser social capital.
Methods
The inquiry was based upon data from the first wave of the National Social Life, Health and Aging Project (NSHAP) – a nationally-representative probability household sample of community-dwelling individuals, aged 57–85 years, in the USA. The current study focused exclusively upon respondents aged 65 years and older within the sample, in order to ascertain the correlates of the presence of depressive symptoms among members of the older cohort. The data were collected in 2005/2006, in the same field operation that was employed for the Health and Retirement Study (HRS). The NSHAP survey consisted of two main instruments: an in-home computer-assisted personal interview (CAPI) conducted in English or Spanish; and a self-administrated post-interview questionnaire. The present analysis included only respondents who answered both survey instruments.
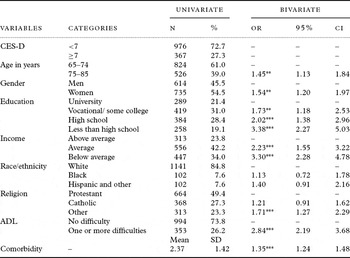
The sampling procedure in NSHAP included an over-sampling of selected groups in the population in order to guarantee their sufficient representation, specifically, African-Americans, Latinos, men and the older age group (O'Muircheartaigh et al., Reference O'Muircheartaigh, Eckman and Smith2009). The current inquiry, executed by means of the SPSS statistical program, applied weights that are supplied by NSHAP. The weights, which adjust for non-response by age and urbanicity, were limited to those that are executed in SPSS. The resultant sample numbered 1350. Table 1 reveals that the analytical sample included slightly more women (54.5%) than men (45.5%). Older-old respondents (those aged 75 and older) accounted for 39%. Whites made up about 85% and Protestants accounted for almost half of the respondents in the current study.
Background characteristics, health and depressive symptoms among older Americans: univariate description and unadjusted bivariate associations (logistic regressions)

*p <0.05, **p <0.01, ***p <0.001
Variables
The dependent variable in the inquiry was a dichotomous indicator of depressive symptoms, as measured on an 8-item version of the Center for Epidemiological Studies Depression Scale (CES-D). This version of the CES-D was chosen because it has a documented recommended cut-off for identification of persons with significant distress (Measurement Group, 2005). The eight items are: felt depressed, everything an effort, restless sleep, felt happy, felt lonely, enjoyed life, felt sad and could not get going. The probe queried the extent of these feelings in the previous week on a scale that ranged from rarely or none of the time (0), to most of the time (3). The total scale thus ranged from 0 to 24. The clinical cut-off point was a score ≥ 7. It should be noted that the NSHAP questionnaire includes 11 CES-D items. Accordingly, a sensitivity analysis was run with the 11-item version as a continuous outcome variable. The results were similar (available upon request).
For purposes of validation of the outcome measure, the dichotomous CES-D variable was compared to scores on a modified version of the 7-item anxiety subscale of the Hospital Anxiety and Depression Scale (HADSA). This measure is also included in the NSHAP questionnaire. Cross-tabulation of the CES-D with a parallel version of the HADSA (total scale range = 0–21; cut-off for the presence of possible anxiety ≥ 8 (Herrmann, Reference Herrmann1997)) revealed that more than three-quarters of the respondents who reported a high level of depressive symptoms also reported anxiety levels above the cut-off point (76.8%).
The main independent variables in the analysis reflect key selected aspects of the interpersonal milieu of older adults, namely the subjective quality of relationships with family, friends and spouse or partner, and the structure of the social network – addressed here as network type. Subjective quality of relationships was determined by a series of probes regarding the nature of one's feelings toward family, friends and spouse or partner. Presence of a partner was determined by marital status and/or cohabitation (846 respondents) or by another question which queried whether the respondent had a romantic or intimate partner independent of marital status and cohabitation. This probe yielded an additional 57 respondents who could be said to have a partner.
The questionnaire asked the following subjective questions: How often can you open up to members of your family if you need to talk about your worries? How often can you rely on them for help if you have a problem? How often do members of your family (not including partner) make too many demands on you? How often do they criticize you? The same probes were asked in relation to friends and partner. The answer scale for each probe was hardly ever (1), some of the time (2) and often (3).
In the larger NSHAP sample (Shiovitz-Ezra and Leitsch, Reference Shiovitz-Ezra and Leitsch2010), as in the MIDUS study before it (Walen and Lachman, Reference Walen and Lachman2000), factor analyses indicated that the two positive relationship indicators (open up to, rely on) and the two negative relationship indicators (demands, criticize) constituted separate domains for each of the relationship categories. Consequently, in the current analysis the respective pairs of items were summed, yielding six relationship variables, termed as: positive family ties, negative family ties, positive friend ties, negative friend ties, positive partner ties and negative partner ties. For each variable, a dichotomous score was obtained by dividing the total score at the midpoint of the possible score range. Thus, those with scores up to 3 were classified as (1) “low” and those with scores from 4 to 6 were classified as (2) “high.” (For the multivariate analysis, a zero score was added to the positive partner ties variable to take into account those who had no partner.)
The variable “network type” reflected five different social groupings that were derived in a previous inquiry of the NSHAP data. The procedure applied K-means cluster analysis, based upon Euclidian distance, to selected criterion variables that are cited in the literature as constituting the realm of social network. These variables were: marital status, number of children, number of close relatives, number of friends, frequency of getting together with neighbors, frequency of attendance at religious services, and frequency of attendance at organized group meetings. The resultant network types – termed “diverse,” “friend,” “congregant, “family” and “restricted” – are described briefly below. Greater detail on their derivation and respective criterion values is reported elsewhere (Litwin and Shiovitz-Ezra, Reference Litwin, Shiovitz-Ezra and 2010).
The more resourceful of the networks in terms of social capital were the diverse, friend and congregant network types. The diverse network was the type with the most varied extent of interpersonal resources. It reported the greatest percentage of married persons, the greatest number of children and close family members, and the most frequent neighbor get-togethers and attendance at religious services. It also reported a sizable number of friends and moderately frequent attendance at organized group meetings. The friend network reflected a large number of friends and frequent attendance at organized group meetings, as well as moderately frequent attendance at religious services. It differed from the diverse network type primarily in its having relatively fewer familial ties. That is to say, friend networks were more characterized by friends and acquaintances. The congregant network was an average network grouping in most of the criterion variables, with two exceptions. Respondents reported frequent attendance at religious services and the least frequent attendance at organized group meetings. It can be assumed, therefore, that the place of worship constituted an important source of social contact for respondents in this particular network constellation.
The less resourceful networks in terms of social capital were the family and restricted network types. The family network had a comparatively high number of children, on average. But it also scored low on other kinds of ties, especially those of a non-familial nature. Thus, respondents embedded in this type of network seemed to rely primarily on their partner, and/or their children. Finally, the restricted network reported the fewest children and close relatives, the least attendance at a place of worship and the fewest life partners. Moreover, it had only average contact with friends and neighbors and average attendance at organized group meetings. On the whole, members of this network type had a more limited amount of interpersonal resources.
The independent control variables in the present analysis included sociodemographic background characteristics and health status. The former were age, gender, education, income, race or ethnicity and religious affiliation. Age was collapsed into a two-category variable to reflect the young-old (65–74) and the older-old (75–85). Gender (men/women) was also addressed as a categorical variable. Education was considered according to four levels: less than high school, high school or equivalent, vocational education or some college and bachelor's degree or more.
Income was based upon a probe that asked respondents to compare their household incomes with those of “American families in general.” In the current inquiry a three value response was employed: below average, average, and above average. This subjective indicator was selected as the key income measure because of missing data on other income measures queried in NSHAP. Moreover, subjective income has been shown to constitute a valid indicator of economic status (Litwin and Sapir, Reference Litwin and Sapir2009).
Race/ethnicity was addressed by means of three categories: white, black, and a combined category of non-black Hispanics and others (the latter were mostly Asian). Religious affiliation was recorded in the NSHAP questionnaire according to five categories: Protestant, Catholic, Jewish, others and none. The current analysis combined Jewish, others and none into a single category due to the small number of respondents in each.
Health status was measured on two variables. Functional capacity was tapped on a six-item list of basic activities of daily living (ADL), which included walking across a room, dressing, bathing, eating, getting in or out of bed, and using the toilet. Respondents were asked the degree of difficulty they encountered in carrying out each task on a 4-point scale that ranged from no difficulty to unable to do so. The current analysis employed a dichotomous indicator – no ADL difficulty and one or more ADL difficulties. Physical health status was considered in terms of comorbidity – a count reflecting 0–5 or more previous diagnoses of health conditions. Based upon the Charlson Comorbidity Index (Charlson et al., Reference Charlson, Pompei, Ales and McKenzie1987), the NSHAP comorbidity measure is believed to be informative as a gross measure of disease burden (Williams et al., Reference Williams, Pham-Kanter and Leitsch2009).
Analysis
In the first stage of the analysis, a univariate description of the study variables was undertaken. Next, the inquiry employed a series of bivariate logistic regressions to identify the unadjusted associations between each of the study variables and the depressive symptoms outcome measure. Finally, a multi-model multivariate analysis was executed in which the presence of a high level of depressive symptoms was regressed on the respective study variables. The first model regressed the depressive symptoms outcome measure on the background characteristics and the relationship quality measures. The second model regressed the depressive symptoms measure on the background characteristics and the network types. The third model considered all the study variables. In each case, multiple logistic regressions were performed.
Results
The data revealed that just over a quarter of the respondents (27.6%) scored above the clinical cut-off for depression (Table 1). This is similar to the reported prevalence of clinically significant depressive symptoms in Brazil (26%) (Barcelos-Ferreira et al., Reference Barcelos-Ferreira, Izbicki, Steffens and Bottino2010) and in Mexico (22%) (Garcia-Pena et al., Reference Garcia-Pena2008), and it corresponds to the average depression prevalence found in ten European countries (24%). However, it is considerably higher than prevalence rates for depression that have been reported in the USA (e.g. Steffens et al., Reference Steffens, Fisher, Langa, Potter and Plassman2009).
Table 1 also summarizes the respondents' background characteristics. As may be seen, whites, Protestants, women and young-old respondents constituted the majority categories. About a fifth of the sample had a degree-level education and the same proportion reported having less than high school. The remainder divided almost equally between high school and some post-secondary schooling. About a third reported below average household incomes, more than 40% had average incomes and almost a quarter indicated having above average incomes. About a quarter of the respondents experienced one or more difficulties in performing basic tasks of daily living (ADL). The average number of previously diagnosed health conditions was more than two.
The second set of columns in Table 1 presents the unadjusted odds ratios for each of the background and health characteristics in relation to the dichotomous outcome measure. As may be seen, all but one of the background variables – race/ethnicity – were significantly associated with the outcome. (Blacks and Hispanics/others were not different from white respondents in the level of reported depressive symptoms.) People with less than a high school education were much more likely to report a high level of depressive symptoms than university graduates; high school graduates and those with some post secondary schooling were also more likely to report depressive symptoms. Respondents reporting below average household incomes were much more likely to report a high level of depressive symptoms than respondents with above average incomes, and those with average incomes were also more likely. Persons who had one or more ADL difficulties were much more likely to report a high level of depressive symptoms than those with no ADL difficulties. Associations were also observed in regard to religious affiliation – those in the “other” group were more likely to report a high level of depressive symptoms than the Protestants. Women were more likely than men to report a high level of depressive symptoms, and respondents aged 75–85 years were more likely than those aged 65–74. Respondents with higher comorbidity scores were also more likely to report a high level of depressive symptoms. Each point increase on the comorbidity measure was associated with a 35% increase in the likelihood of reporting a high level of depressive symptoms.
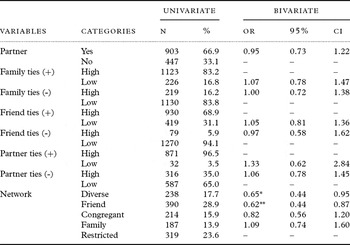
Table 2 summarizes the social network relationship variables in the sample and presents the unadjusted odds ratios in relation to the symptoms outcome measure. The table shows that two-thirds of the respondents had a spouse or intimate partner. Almost all those with a partner rated their positive partner ties as high (96.5%), but more than a third reported having had a high extent of negative ties as well. Some 83% of all respondents indicated having had a high degree of positive family ties, and the same proportion reported having had a low degree of negative family ties. A high extent of positive friend ties was reported by more than two-thirds of the sample while very few reported having had a high extent of negative friend ties (about 6%).
Social relationship variables and their associations with depressive symptoms: univariate description and unadjusted bivariate associations (logistic regressions)

*p <0.05, **p <0.01, ***p <0.001
Table 2 also shows the distribution of the network types in the sample. The friend network was the most common (about 29%), followed by the restricted network (almost 24%). Close to 18% of the sample were embedded in a diverse network. Smaller proportions were situated in congregant networks (about 16%) or family networks (about 14%).
The unadjusted odds ratios that are presented in the second set of columns in Table 2 show that none of the relationship quality variables was associated with the depressive symptoms measure in the current study sample. In order to verify this unexpected finding, analyses were run using these same variables on the full NSHAP sample of adults aged 57–85 years. In the expanded sample, positive family ties were inversely related to the dichotomous CES-D outcome measure (R = -0.05, p<0.01). Moreover, some of the relationship quality indicators were related in the larger sample to loneliness, which has been considered elsewhere as an inverse measure of network quality (Litwin, Reference Litwin2010). Specifically, positive family ties (R = -0.05, p<0.05) and positive friend ties (R = -0.04, p<0.05) were inversely associated with loneliness in the larger sample, albeit to a modest degree. Thus, the lack of association between the relationship quality variables and the depressive symptoms measure in this analytic sample of persons aged 65–85 is most likely not an artifact of the mode of measurement.
In comparison, the structural measure of network type was related to the outcome measure at the bivariate level. Specifically, respondents in diverse networks or friend networks were one and half times less likely than those in restricted networks to report a high level of depressive symptoms. Further analyses (not shown) in which the network type reference categories were varied provide additional backing for this trend. Thus, respondents in family networks (OR = 1.68, 95% CI = 1.10–2.58) or restricted networks (OR = 1.54, 95% CI = 1.05–2.26) were about one and half times more likely than those in diverse networks to report a high level of depressive symptoms. In turn, respondents in diverse networks (OR = 0.60, 95% CI = 0.39–0.91) or friend networks (OR = 0.57, 95% CI = 0.39–0.83) were more than one and half times less likely than those in family networks to report a high level of depressive symptoms.
A separate analysis (available on request) examined the associations between the subjective quality of relationship variables and the continuous version of the 8-item CES-D score. Here too, no associations were discerned. Similar analyses using each of the original subjective quality of relationship probes in their ordinal form did not reveal any different trends. Comparison of the network types on the continuous 8-item CES-D score by means of ANOVA, on the other hand, showed significant differences (F = 5.22, df = 4,1,338, p < 0.001). Post hoc multiple group comparisons revealed that the friend network type had less reported presence of depressive symptoms than both the family and the restricted network types.
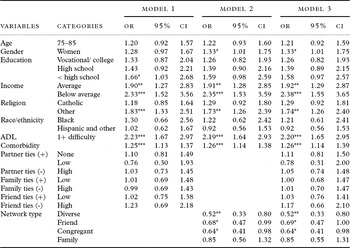
The results of the multi-model analysis are presented in Table 3. Model 1 shows that even after taking background and health characteristics into account, the social relationship quality variables were not related to the depressive symptoms measure among the study population. Model 2 shows, in comparison, that the network type measure retained its earlier bivariate relationship with the depression outcome, and even added a third network type to those reporting a lower presence of depressive symptoms. That is, respondents in diverse networks and friend networks remained less likely to report a high level of depressive symptoms than those in restricted networks. In addition, the congregant network type emerged as a negative correlate of depressive symptoms, with respondents in this grouping also reporting a lower presence of symptoms than those in the reference category, all else considered. Overall, the effect size of the network type construct in this model was small (pseudo R2 = 0.02), but nevertheless meaningful.
Adjusted correlates of depressive symptoms among older Americans: background characteristics, social relationship quality and social network type

*p < 0.05, **p < 0.01, ***p < 0.001
Reference categories: Partner ties (+) – high; Partner ties (-) – low; Family ties (+) – high; Family ties (-) – low; Friend ties (+) – high; Friend ties (-) – low; Network type – restricted; Age – 65–74; Gender – men; Education – university; Income – above average; Religion – Protestant; Race/ethnicity – white; ADL – no difficulty
Model 3 examined all of the social relationship variables together. As may be seen, the relationship quality variables remained unassociated with the depressive symptoms measure in this model. In contrast, all three of the network types that were found to be associated with the depressive symptoms outcome in the previous model retained their associations in the final model. Thus, after taking all the study variables into account, diverse, friend and congregant network types reported a lower presence of depressive symptoms.
As for the background and health characteristics, Model 3 shows that gender, income, religion and health status (both ADL and comorbidity) all remained associated with the depressive symptoms outcome, albeit to varying degrees. Age, education and race/ethnicity proved to be unrelated to the outcome measure in the multivariate analysis. The full model accounted for some 17% of the variance in the depression outcome measure, as indicated by the pseudo R2.
Discussion
The main aim of the present study was to examine the association between social network relationships and depressive symptoms in a sample of community-dwelling older American adults. A key issue considered, in this context, was whether the structure of the social network is related to depressive symptoms more than is the perceived subjective quality of the network. The first hypothesis addressed the subjective side of social network relations and posited that negative ties are more strongly associated with a high level of depressive symptoms than are positive ties. The results of the analysis revealed, however, that this was not the case. That is, there were no differences between the negative and positive ties vis-à-vis the symptoms outcome. This was true for family and friend ties among the entire sample and for spouse/ partner ties among those with spouse/ partner. In fact, the subjective social relationship variables showed no relationship whatsoever to the presence of a high level of depressive symptoms among respondents in this sample.
The explanation for the lack of association just described may well lie in the complexity of the presumed relationships between social network indicators and health outcomes. Various studies cite differing trajectories of association in the relationships between social network factors and health, as, for example, between positive and negative exchanges and disability (Mavandadi et al., Reference Mavandadi, Rook and Newsom2007a), and in the association between pain and depressive symptomatology (Mavandadi et al., Reference Mavandadi, Sorkin, Rook and Newsom2007b). This suggests that there may indeed be an association between the quality of social ties, on the one hand, and mental health, on the other, but in order to fully discern them one must take into account other significant variables and multiple paths of association. The implication of this finding is that the quality of relationships may ultimately be important for understanding the etiology of the presence of depressive symptomatology, but it is not helpful as a means of initial screening for possible psychological distress.
The second hypothesis posited that social capital is inversely correlated with the presence of depressive symptoms. This hypothesis was confirmed. Respondents embedded in social networks characterized by lesser social capital reported depressive symptoms to a greater degree than those who were located in more resourceful networks. As recalled, three network constellations were identified as socially resourceful from varying points of view: the diverse, friend and congregant types. Two other network groupings were less resourceful in this capacity: the family and restricted network types. The bivariate results showed that compared to respondents located in restricted or family network types, those in diverse or friend networks had less presence of depressive symptoms. The multivariate results underscored the negative association between one's belonging to a diverse network and the reporting of a high level of depressive symptoms. They also pointed to a modest inverse relationship between friend and congregant networks, on the one hand, and the depressive symptoms outcome measure, on the other.
These findings demonstrate that gregarious social networks are indeed associated with a lower presence of depressive symptoms. The diverse network type has the greatest social capital and support potential, given that it contains the widest range and scope of relationships. Previous research in different settings has indeed shown that diverse networks and their derivatives are associated with better morale (Litwin, Reference Litwin2001), less depressive symptomatology (Fiori et al., Reference Fiori, Antonucci and Cortina2006), and greater longevity (Litwin and Shiovitz-Ezra, Reference Litwin and Shiovitz-Ezra2006). The current findings reinforce this line of interpretation.
Friend networks are unique mainly in the extent of extra familial ties that they maintain. That is, these groupings are noted particularly by the kinds of ties that occur outside the family domain. The results from the current analysis suggest that friend relations may be modestly protective against depressive symptoms. However, it could be that the background characteristics that typify older persons in friend networks are what govern this grouping's bivariate relationship with mental health, as for example their higher incomes, higher education and better health. This might explain why the relative strength of the inverse bivariate association between the friend network type and depressive symptoms weakened somewhat in the multivariate analysis.
The congregant network type has support potential of a particular kind obtained through religious affiliation. The findings from the current multivariate analysis showing an inverse relationship between congregant networks and depressive symptoms have backing from other studies. For example, analysis of longitudinal data from the Netherlands found a consistent negative association over time between church attendance and depressive symptoms in older Dutch citizens (Braam et al., Reference Braam2004).
It is also important to note that respondents embedded in family networks had a greater tendency, at the bivariate level, to report a high level of depressive symptoms than those in the diverse and friend networks. They were also shown, in the multivariate analyses, to be indistinguishable from the restricted network vis-à-vis the depressive symptoms outcome. These findings underscore the premise that was examined in the current analysis. That is, older adults who are located in social networks with lesser social capital do indeed seem to have greater psychological distress, all else considered. Additional inquiry is warranted, nevertheless, to better understand the health and social antecedents of family network formation.
A few limitations of the present study need to be recognized. First, the analysis was based upon cross-sectional data. As such, causal connections between social network relationship variables and mental health could not be examined. It is possible, at this stage, to speak only about associations between the variables. It could well be, for example, that older distressed individuals generate less resourceful networks rather than the opposite. Nevertheless, this limitation does not decrease the value of the demonstrated association between network type and the depressive symptoms outcome, insofar as it offers a means for identifying older persons at risk in community screening efforts.
A second limitation that stems from this same restraint is that the present inquiry could not consider whether it is network type per se or rather a change in one's network type that predicts mental state. It could be that older persons who have been located in a less resourceful network type for quite some time are less at risk of having a high level of depressive symptoms than those who have recently shifted from a socially endowed network type to a less endowed type in terms of social capital. Here too, longitudinal analysis can aid in clarifying this issue.
Despite these limitations, the results of the present study suggest that social network relationships are variously related to mental health. They also show that the structure of the network may matter more than the perceived quality of the ties, at least at the most basic and direct level, as an initial indicator of depressive symptoms. Moreover, the study demonstrates that it is the network type variable among the social network relationship variables considered that stands out in capturing the differences in mental state.
The findings from the present analysis underscore the importance of considering social capital in relation to mental health. They also have practical implications. It is recommended to incorporate the construct of network type in mental health screening among older people who reside in the community. Identification of one's social network type can provide an important early indication that one is at risk.
Conflict of interest
None.
Acknowledgments
The National Social Life, Health and Aging Project (NSHAP) is supported by the National Institute on Aging (NIA), Office of Women's Health Research, Office of AIDS Research, and the Office of Behavioral and Social Science Research (5R01AG021487).