


Impact statement
Water scarcity is increasing the need for safe wastewater management and advanced water reuse. One challenge is that some harmful chemicals are extremely small and can pass through widely used reverse osmosis membranes. Nitrosamines are a particular concern because some are cancer-causing and are often difficult to remove completely. This work presents a new membrane design that improves the removal of these contaminants while still allowing water to be treated at useful rates.
The developed membranes contain specially organized molecular structures that help water pass through while making it harder for small harmful chemicals to cross. Compared with commercial reverse osmosis membranes, they removed more of the nitrosamines tested, including some of the most difficult ones. Their performance also remained stable under high-recovery operation using model feeds containing both ionic and neutral organic solutes, providing a more stringent test than simple single-solute experiments.
The results support the development of safer treatment technologies for advanced wastewater management and high-recovery reuse approaching minimal liquid discharge. Moving this approach toward real use will require testing with real wastewater, longer operating studies, and evaluation of large-scale manufacturing.
1. Introduction
Water scarcity and increasing contamination are defining challenges of the 21st century, with far-reaching consequences for public health, agriculture, and economic development. This issue is reflected in the United Nations Sustainable Development Goal 6 (SDG 6), which calls for universal and equitable access to drinking water and sanitation [Reference Lynch, Elliott and Phang1]. Achieving this target requires the development of energy-smart, reliable treatment technologies capable of addressing a wide range of legacy and emerging contaminants in water supply schemes. Wastewater reuse offers a practical pathway to reduce the gap between demand and available freshwater resources [Reference Lynch, Elliott and Phang1,Reference Scanlon, Fakhreddine and Rateb2].
Membrane-based processes, particularly reverse osmosis, are central to modern wastewater reuse strategies, as they effectively eliminate pathogens and remove most dissolved solutes, including salts, metals, and a wide range of organic contaminants [Reference Castro and Abejón3–Reference Pezeshki, Hashemi and Rajabi6]. However, conventional reverse osmosis membranes remain less effective in removing small neutral organic contaminants, typically characterized by molecular weights below 150 g mol⁻1 [Reference Duan, Wang, Shocron and Elimelech7,Reference Zhou, Zhang and Li8]. These compounds are of particular concern because their small size and neutral character facilitate transport through traditional polyamide layers [Reference Fujioka, Khan and McDonald9].
Among the neutral molecules of concern, N-nitrosamines have attracted particular attention due to their high carcinogenic potency. These compounds are frequently detected in wastewater and can form as disinfection by-products during chloramination processes [Reference Chen, Zeng and Huang10–Reference Wang, Chen and Andrews16]. For instance, molecules such as N-nitrosomethylethylamine (NMEA, 88.1 g mol⁻1, electrically neutral at pH 7) can permeate traditional reverse osmosis membranes. A wide range of rejection values has been reported depending on the membrane structure and operating conditions [Reference Fujioka, Khan and McDonald9,Reference Fujioka, Kodamatani, Nghiem and Shintani17,Reference Sgroi, Vagliasindi, Snyder and Roccaro18]. Specifically, commercial brackish-water reverse osmosis membranes typically exhibit rejection values between 20% and 60% for low-molecular-weight nitrosamines [Reference Fujioka, Kodamatani, Nghiem and Shintani17,Reference Sgroi, Vagliasindi, Snyder and Roccaro18,Reference Rho, Cho and Chon19]. This limited removal reflects the physicochemical properties of nitrosamines, which are small (<150 g mol⁻1), neutral, and weakly hydrophobic. This enables transport through nanoscale free volumes in polyamide layers and reduces the effectiveness of size exclusion and electrostatic repulsion mechanisms [Reference Huang, Chen and Su12]. In response to these risks, the World Health Organization (WHO) has set guideline values for nitrosamines, underscoring their toxicological relevance [Reference Chain, PoCit and Schrenk20].
Overcoming this limitation requires membranes that simultaneously reduce non-selective transport pathways and enhance solute-membrane interactions within the selective layer. Tailoring the nanoscale structure and chemistry of polyamide active layers is a promising approach to achieve this objective [Reference Deshmukh, Elimelech and Lienhard21]. By incorporating functional nanostructures within the polymeric matrix, thin-film nanocomposite (TFN) membranes can regulate free volumes and interfacial interactions, thereby improving the rejection of small neutral organic contaminants while maintaining high water flux. In particular, supramolecular assemblies based on hydrogen-bonding interactions offer a means to modulate molecular transport within polymeric networks [Reference Di Vincenzo, Tiraferri and Musteata22–Reference Yuan, Zhang and Qi31].
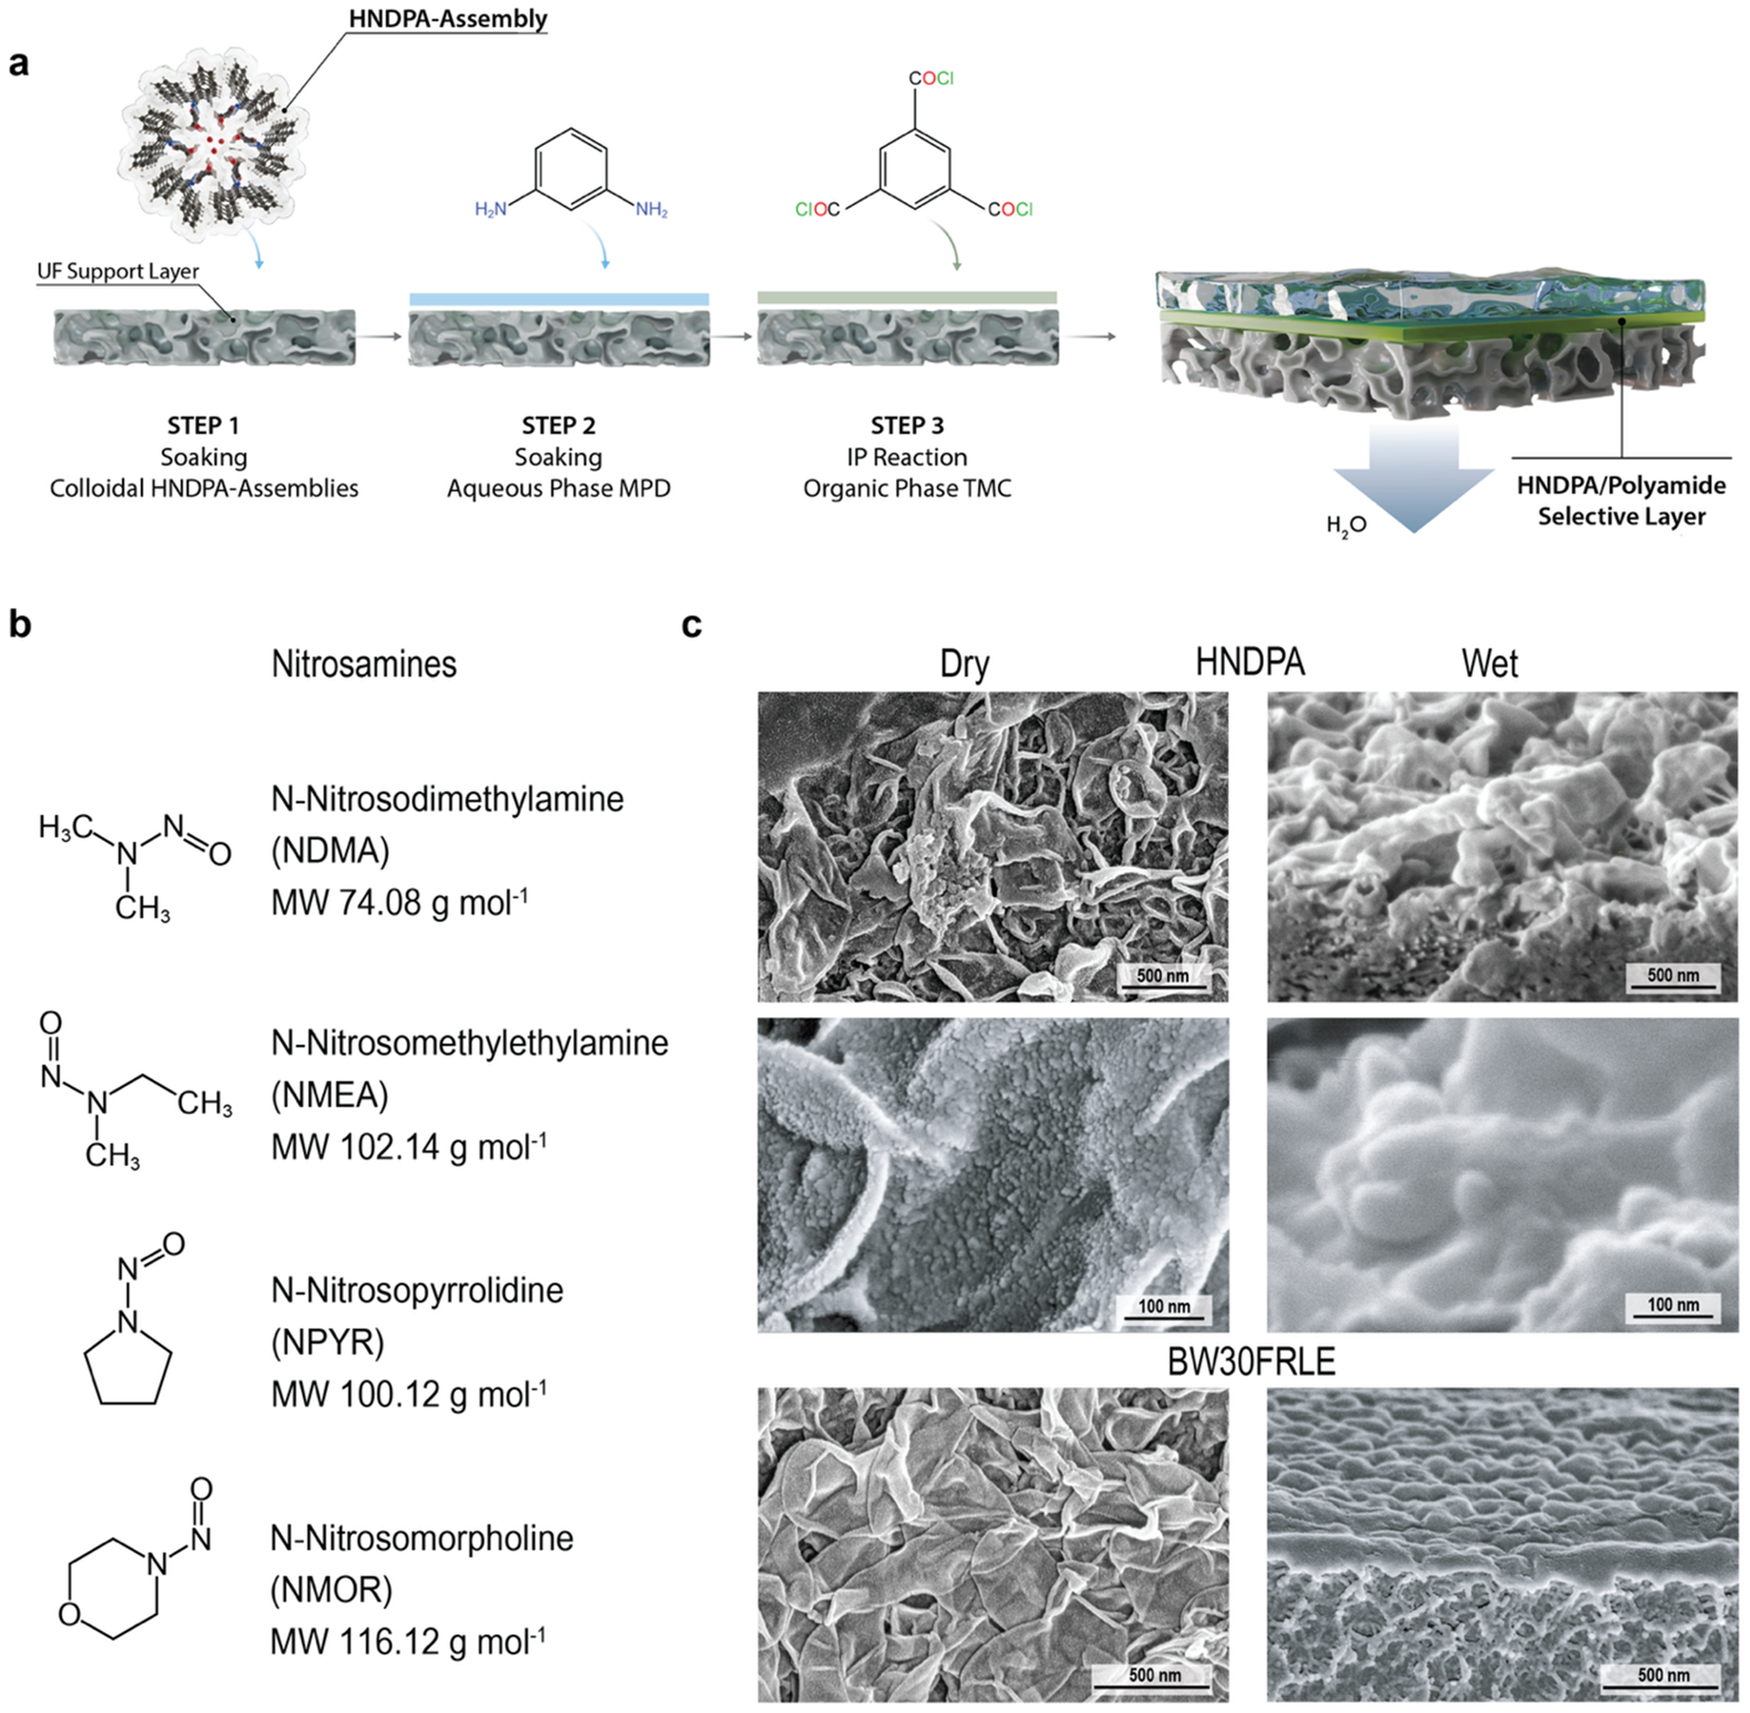
In this study, we investigate polyamide membranes incorporating crosslinked assemblies of 2-hydroxy-N-(diphenylmethyl)acetamide (HNDPA) (Figure 1a) for the preferential water transport and selective removal of low-molecular-weight nitrosamines. These supramolecular assemblies have previously demonstrated excellent performance in seawater and brackish water desalination [Reference Di Vincenzo, Tiraferri and Górecki32]. By increasing the energetic barrier, they can limit the transport of small neutral pollutants. Their potential is explored here for the removal of representative nitrosamines, including N-nitrosodimethylamine (NDMA), N-nitrosomethylethylamine (NMEA), N-nitrosopyrrolidine (NPYR), and N-nitrosomorpholine (NMOR) (Figure 1b). Although nitrosamines in reuse treatment streams are typically detected at trace levels, often in the ng L⁻1 to low μg L−1 range, such concentrations are analytically challenging for bench-scale experiments. Therefore, the 500 μg L⁻1 feed concentrations used here for each nitrosamine are not intended to reproduce environmental conditions, and they should be interpreted as an analytical challenge condition selected to enable quantification and robust membrane-to-membrane comparison. The membranes are challenged with both single and mixed solute systems, as well as more complex feed solutions. HNDPA nanocomposite membranes are compared with commercial brackish water reverse osmosis membranes, using rejection of nitrosamines and permeance as key metrics. Furthermore, to elucidate the origin of the observed performance, the membranes are characterized using cryo-scanning electron microscopy to visualize the polyamide layer in both dry and hydrated states. In parallel, a combination of density functional theory (DFT) and molecular dynamics (MD) simulations are employed to investigate interactions between nitrosamines, including NDMA, NMEA, NPYR, and NMOR, and the polyamide/HNDPA network. Specifically, DFT is applied to quantify the binding energies and assess molecular affinity, while MD simulations are conducted to analyze solute transport pathways and mobilty hydrated within nanostructured channels. Together, these approaches provide a comprehensive framework for understanding solute–membrane interactions and transport in the proposed system.
Fabrication and multiscale structural characterization of HNDPA membranes. (a) Schematic representation of the nucleation-assisted interfacial polymerization procedure used for the fabrication of HNDPA membranes. (b) Investigated nitrosamines. (c) Representative cryo-SEM images of the HNDPA and commercial BW30FRLE membranes in dry and hydrated states.

Figure 1. Long description
Panel a is a flowchart of the fabrication process. Step 1 shows a porous UF Support Layer being soaked in colloidal HNDPA-Assemblies, which are depicted as circular molecular clusters. Step 2 involves soaking in an aqueous phase MPD solution. Step 3 shows the IP Reaction with an organic phase TM C solution. The final result is a composite membrane with a green H N D P A forward slash Polyamide Selective Layer on top of the gray support, with a blue arrow indicating H sub 2 O flow through the structure
Panel b lists four nitrosamines with their chemical structures and molecular weights. From top to bottom: N-Nitrosodimethylamine NDMA at 74.08 g mol super minus 1, N-Nitrosomethylethylamine NMEA at 102.14 g mol super minus 1, N-Nitrosopyrrolidine NPYR at 100.12 g mol super minus 1, and N-Nitrosomorpholine NMOR at 116.12 g mol super minus 1.
Panel c contains six cryo-SEM images. The top four images show the HNDPA membrane. In the dry state, the surface appears highly textured with leaf-like folds at 500 nm and 100 nm scales. In the wet state, these features appear swollen and rounded. The bottom two images show the BW 30 FRLE membrane. The dry state shows a dense, crumpled surface, while the wet state shows a cross-section with a distinct nodular top layer over a porous sub-structure, both at a 500 nm scale.
2. Methods
2.1. Membrane Fabrication Procedure
Selective active layers were prepared through a tailored interfacial polycondensation procedure, as summarized in Figure 1. The loading HNDPA ethanolic phase was formulated by dissolving the HNDPA monomer (1.1 wt%) in an ethanol–water solvent system (70:30 v/v). Following ultrasonication to ensure homogeneity, the solution was conditioned overnight to promote supramolecular organization driven by hydrogen-bonding interactions. The partial aqueous environment favors HNDPA self-assembly, facilitating the formation of an extended hydrogen-bonded network within the precursor solution.
The polysulfone asymmetric support (nominal molecular weight cut-off of 20 kg mol⁻1) was subsequently contacted with the HNDPA loading solution and retained under static conditions for approximately 60 s to favor the nucleation process at the support interface. An aqueous solution of m-phenylenediamine (MPD, 2 wt%) was applied for 120 s, and excess solution was removed using a controlled air stream. The surface was then contacted with a hexane solution of trimesoyl chloride (TMC, 0.1 wt%) for 60 s to initiate polymerization at the interface and form a continuous polyamide selective layer. The resulting composite membranes underwent a sequential post-treatment protocol consisting of thermal conditioning in deionized water (95°C, 120 s), oxidative rinsing in an aqueous sodium hypochlorite solution (200 ppm, 120 s), and quenching in a sodium metabisulfite solution (1,000 ppm, 30 s), followed by a final thermal rinse in deionized water (95°C, 120 s). The short NaOCl treatment was used to remove residual unreacted MPD from the freshly formed polyamide layer. The concentration and exposure time were kept mild (200 ppm, 120 s), and the membrane was immediately quenched in sodium metabisulfite solution to minimize further oxidative reactions. The TFN membranes were stored in deionized water at 4°C prior to characterization and testing.
2.2. DFT and MD Simulations
DFT calculations were performed to evaluate the interaction energies between the target nitrosamine pollutants and the polymer matrices, namely, PA and PA/HNDPA, using Gaussian 16 (revision C.02) [Reference Frisch, Trucks, Schlegel, Scuseria, Robb, Cheeseman, Scalmani, Barone, Petersson and Nakatsuji33]. The M06-2X [Reference Zhao and Truhlar34] functional was employed in combination with the 6-31G(d) basis set, which provides a reliable description of non-covalent interactions. The interaction energy, Eint, between each pollutant molecule and the polymer system was calculated as:

where Epolymer/molecule is the total electronic energy of the polymer-solute complex, and Epolymer and Emolecule are the electronic energies of the isolated polymer system and solute molecule, respectively.
All molecular models were constructed using BIOVIA Materials Studio 23, which was also used to perform MD simulations. The COMPASS III force field was applied for both geometry optimization and MD simulations. The polyamide membrane model was constructed following previously reported methodologies [Reference Kinooka, Nakagawa and Matsuyama35], while the HNDPA structure was obtained from its crystallographic configuration. HNDPA molecules were randomly incorporated into the polyamide matrix to generate the nanocomposite systems. After initial geometry optimization, MD simulations were performed in the NVT ensemble at 298 K. Each system, both in the absence and presence of nitrosamine molecules (NDMA, NMEA, NPYR, NMOR), was equilibrated for 5 ns. Subsequently, an additional 5 ns NVT simulation was performed as a production run for data collection and analysis.
The diffusion behavior of the nitrosamine molecules within the membrane matrix was evaluated using the mean square displacement (MSD) obtained from MD trajectories. Diffusion coefficients, Di, were calculated using the Einstein relation:

where ri(t) represents the position of molecule
$ i $
 at time
$ t $
 , and the angular brackets denote an ensemble average.
2.3. Membrane Performance Evaluation
The transport properties of the membranes were first evaluated using a laboratory-scale cross-flow filtration unit, operated in a closed-loop configuration, with both permeate and retentate streams continuously recycled to the feed reservoir, resulting in 0% recovery. The system comprises a 4 L feed tank, a hydraulic pressure pump (Hydra-cell pump, Wanner Engineering, Inc., Minneapolis, MN), a flat-sheet membrane cell (Sterlitech, USA mod. CF016SS) accommodating membrane samples with an active area of 20.1 cm2, a back-pressure valve to regulate the pressure (Swagelok, USA), a manometer (Span, USA), a permeate flux meter, and a chiller with heat exchanger coils (Model MC 1200, Lauda, Lauda-Königshofen) immersed in the feed tank to keep the feed temperature equal to 25 ± 2°C. The filtration tests consisted of two sequential phases: initially, 3 L of deionized water (resistivity >107 Ohms); subsequently, appropriate volumes of stock solutions were directly added into the feed tank to obtain a desired feed solution to evaluate the rejection rates. Before each experiment, the membrane coupon was immersed in DI water overnight. Membrane samples were initially compacted at a transmembrane pressure of 174 psi (12 bar) for 4 h to ensure stabilization. The pressure was subsequently reduced to 145 psi (10 bar), and the steady-state pure water flux (J
w,0) was determined from the permeate volumetric flow rate normalized by the effective membrane area. The corresponding pure water permeance value, A, was calculated from J
w,0, by dividing it by the applied pressure of 10 bar. Solute rejection experiments were conducted at an applied pressure of 145 psi (10 bar). Tests were first performed using aqueous solutions containing individual nitrosamines, namely, N-nitrosodimethylamine (NDMA), N-methyl-N-nitrosoethanamine (NMEA), 1-nitrosopyrrolidine (NPYR), or N-nitrosomorpholine (NMOR), at 500 μg L⁻1. Subsequently, experiments were conducted using a synthetic wastewater matrix containing all four nitrosamines at 500 μg L⁻1 each, together with 10 mM NaCl and 2,000 mg L⁻1 urea. A total feed volume of 3.5 L was used in all cases. Each filtration test was operated for 8–10 h. Once steady-state conditions were reached, the permeate flux (J
w) was calculated from the permeate flow rate normalized by the membrane active area. Sodium chloride concentrations in feed and permeate samples were determined from electrical conductivity measurements using a conductivity meter (WTW ProfiLine Cond 3310). Total organic carbon (TOC), measured using a Shimadzu TOC-LCSH/CPH analyzer, was employed as an indirect measure of urea concentration in both streams. The feed solution pH was maintained at 7.4 using sodium bicarbonate as a buffer, with fine adjustment by NaOH to represent typical wastewater conditions. Nitrosamine concentrations in feed and permeate samples collected at steady state were quantified by liquid chromatography–tandem mass spectrometry (LC–MS/MS) using a Thermo Altis Plus system operated in multiple reaction monitoring (MRM) mode with a positive electrospray ionization (ESI) source. Observed rejection values were calculated as described
$ \mathrm{Observed}\ \mathrm{rejection}\;\left(\%\right)=\left(1-\frac{c_p}{c_f}\right)\bullet 100 $
 . For each membrane, three rejection measurements were obtained at steady state at 30 min intervals and averaged. The temperature was maintained at 25 ± 2°C throughout the experiments.
High-recovery tests were performed using a cross-flow bench-scale set-up, equipped with a 10 L feed tank, a high-pressure pump (Hydra-cell, Wanner Engineering, Inc., USA), a three-way valve for bypass control and feed flow rate regulation (Swagelok, USA), a flat-sheet membrane cell (model CF016D, active area 20.6 cm2, Sterlitech, USA), and a back-pressure valve for pressure regulation. Feed flow rate and pressure were monitored with a flowmeter (ASA, Italy) and a manometer, respectively (SPAN, USA). Permeate was collected in a tank placed on a computer-interfaced scale, allowing continuous gravimetric determination of permeate flux. The temperature was measured at constant intervals with a probe immersed in the feed tank and maintained at 23 ± 2°C with a recirculating chiller (model MC 1200, Lauda, Germany), equipped with a stainless-steel coil submerged in the feed tank. Two feed solutions were tested. Test A consisted of deionized water with 500 μg L⁻1 of each of the four nitrosamines. Test B contained the same nitrosamine concentrations, with the addition of urea (2 g L⁻1) and NaCl (10 mM). The test protocol included 1-hour membrane compaction at a pressure of 12 bar with permeate recirculation, 1-hour membrane compaction at 10 bar with permeate recirculation, and finally collection of the permeate up to a target recovery of 75%. Feed cross-flow velocity was set at 0.7 m s−1. Samples of both feed and permeate were collected at 0%, 40%, and 75% recovery. Overall, the high-recovery tests lasted approximately 1 month and included cycles of permeate recirculation and permeate collection, during which the membranes were exposed to feed solutions with progressively increasing solute concentrations as recovery increased. At the end of each test, a composite sample of the total permeate was also collected. Note that, while all filtration experiments were performed at applied pressures representative of the operating range of brackish-water reverse osmosis systems used in advanced water reuse, the feed compositions were intentionally designed as a controlled challenge matrix rather than to reproduce the composition of a specific wastewater stream.
Instantaneous observed rejection of single compounds was calculated as
$ \mathrm{Observed}\ \mathrm{rejection}\;\left(\%\right)=\left(1-\frac{c_p}{c_f}\right)\bullet 100 $
 , where cp is the concentration of the compound in the permeate produced around the interval of a given recovery and cf is the corresponding concentration of the same compound in the feed tank in the same time interval. Estimation of the obtainable rejection in a full-scale system was assessed from the overall system rejection, defined as:
$ {\mathrm{Rejection}}_{\mathrm{System}}=\left(1-\frac{c_{p,\mathrm{tot}}}{c_{f,0}}\right)\bullet 100 $
 , where c
f,0 is the initial feed concentration, and c
p,tot is the concentration measured in the combined permeate collected over the entire experiment. For Test A, rejection was determined for individual nitrosamines. For Test B, rejection was evaluated for nitrosamines, electrical conductivity (NaCl), and total organic carbon, the latter used as a proxy for urea concentration.
2.4. Liquid Chromatography Mass Spectrometry (LC–MS/MS)
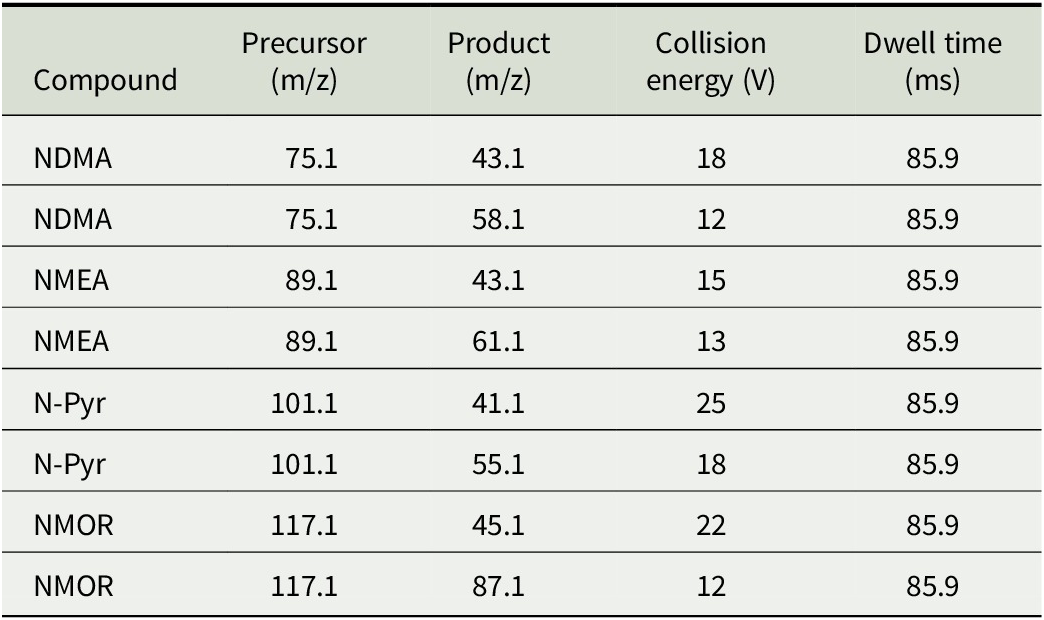
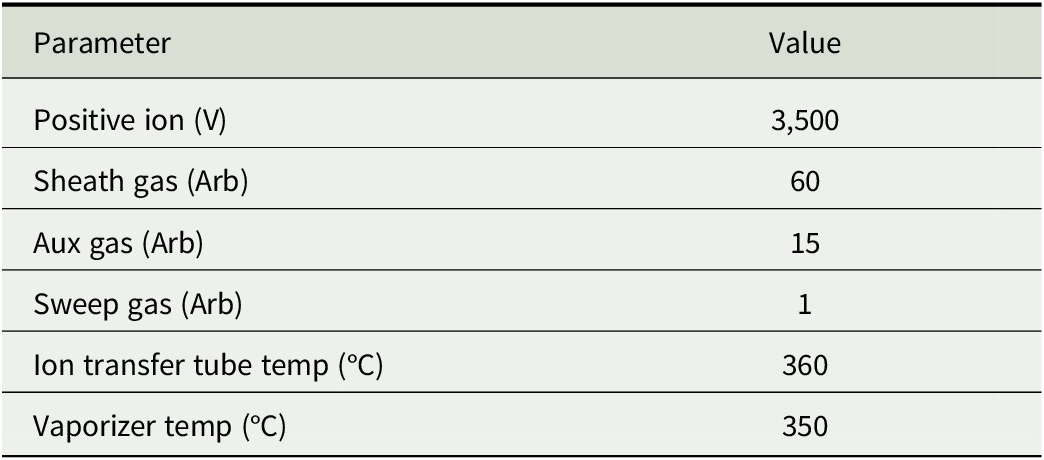
Analysis was performed with a Thermo Altis Plus LC–MS/MS system operated in MRM mode with a positive ESI source. The optimized MRM transitions and their corresponding collision energies (CE) for the four target nitrosamines are summarized in Table 1, and the source parameters are listed in Table 2. Separation was achieved with a Luna® C18 reversed-phase column (4.6 × 150 mm, 3 μm particle size). The mobile phases consisted of (A) 0.1% formic acid in water, and (B) 0.1% formic acid in acetonitrile. The pump flow rate was at 0.5 mL min–1. The gradient program was as follows: 0.0–1.0 min, 10% B; 1.0–3.0 min, linear increase from 10% to 30% B; 3.0–5.5 min, linear increase from 30% to 98% B; 5.5–7.8 min, held at 98% B; 7.8–8.0 min, returned to 10% B; followed by a 2 min re-equilibration at 10% B until a total run time of 10 min. Calibration curves were constructed for each of the nitrosamines using pure standards with concentrations ranging from 5 to 500 μg L−1. All the nitrosamines calibration curves gave linearities (R 2) ≥ 0.95. The intensities of the respective product ions in Table 2 were used to determine the amount of nitrosamine in each sample based on the calibration curves.
MRN transitions and collision energies for target nitrosamines.

Table 1. Long description
The table consists of five columns: Compound, Precursor (m/z), Product (m/z), Collision energy (V), and Dwell time (ms). There are eight data rows, with two transitions listed for each compound.
* NDMA: Precursor 75.1. Product 43.1 at 18 V; Product 58.1 at 12 V. Dwell time 85.9 ms.
* NMEA: Precursor 89.1. Product 43.1 at 15 V; Product 61.1 at 13 V. Dwell time 85.9 ms.
* N-Pyr: Precursor 101.1. Product 41.1 at 25 V; Product 55.1 at 18 V. Dwell time 85.9 ms.
* NMOR: Precursor 117.1. Product 45.1 at 22 V; Product 87.1 at 12 V. Dwell time 85.9 ms.
Note: Multiple reaction monitoring (MRN) transitions, corresponding collision energies, and dwell times used for the quantification of NDMA, NMEA, NPYR, and NMOR. For each pollutant, two product ions were monitored to ensure analytical reliability and confirmation of compound identity.
Optimized electrospray ionization (ESI) source parameters for LC–MS/MS analysis.

Table 2. Long description
The table consists of two columns titled Parameter and Value.
* Positive ion (V): 3,500
* Sheath gas (Arb): 60
* Aux gas (Arb): 15
* Sweep gas (Arb): 1
* Ion transfer tube temp (degrees Celsius): 360
* Vaporizer temp (degrees Celsius): 350
These settings are for the Thermo Altis Plus M C M S M S system in positive ion mode for nitrosamine quantification.
Note: Operating conditions of the Thermo Altis Plus MC-MS/MS system in positive ion mode used for nitrosamine quantification. Parameters include spray voltage, sheath, auxiliary and sweep gas settings, and ion transfer tube and vaporizer temperatures, optimized to ensure stable ionization and signal sensitivity during analysis.
2.5. Attenuated Total Reflectance Fourier Transform Infrared Spectra (ATR-FTIR)
ATR-FTIR spectra were recorded on a Thermo Scientific Nicolet iS20 spectrometer. The ATR accessory contained a monolithic diamond crystal at a nominal angle of incidence of 45°, yielding about 1 internal reflection at the sample surface. ATR-FTIR spectra were acquired within the range of 500–3,600 cm−1. A total of 32 scans were recorded for each sample.
2.6. Cryo-Scanning Electron Microscopy
Cryogenic scanning electron microscopy (cryo-SEM) analysis was performed to investigate the nanostructure of the membranes in their hydrated and dry state. Samples were rapidly plunge-frozen in liquid nitrogen to preserve their native morphology. The frozen specimens were subsequently manually fractured using a precooled blade to expose the cross-section. The fractured samples were mounted onto a freeze-fracture holder pre-cooled to −100°C inside the Leica EM VCM system and transferred under cryogenic conditions using a Leica VCT500 shuttle to a Leica ACE900 freeze-fracture system. Sublimation (etching) was carried out at −80°C for 5 min with a controlled heating ramp of 5°C min⁻1 to remove superficial ice contamination and enhance structural contrast. After etching, the samples were sputter-coated with a 10 nm platinum (Pt) layer to ensure electrical conductivity. Cryo-scanning electron microscopy imaging was conducted using a Helios G4 (Thermo Fisher Scientific) field emission scanning electron microscope equipped with a Leica cryostage maintained at −140°C. Both the membrane top surface and cross-section were imaged. All cryo-SEM images were acquired at temperatures below −140°C to prevent structural alteration during observation.
2.7. Atomic Force Microscopy
Atomic force microscopy (AFM) was performed using a Dimension Icon scanning probe microscope (Bruker) operating in ScanAsyst mode under ambient air conditions to investigate the surface topography and three-dimensional morphology of the membranes. Images were acquired using a SCANASYST-AIR probe (Bruker). The surface roughness was quantified by calculating the root mean square (RMS) roughness from the height profiles.
2.8. Surface Zeta Potential
To assess the surface charge characteristics of the membranes, zeta potential measurements were conducted using a SurPASS™ 3 electrokinetic analyzer (Anton Paar, Austria) equipped with an adjustable gap cell designed for planar samples (20 mm × 10 mm). Two distinct KCl electrolyte solutions were employed (i.e., 1 and 10 mM). For the 1 mM solution, tests were conducted across a pH range spanning approximately 2.5–10, while with the 10 mM concentration, the investigated pH range extended from 5.5 to 9. Throughout all measurements, the temperature was consistently maintained at 25°C, and pH adjustments were automatically performed via the instrument’s titration unit using 0.05 M NaOH and 0.05 M HCl solutions.
2.9. Total Organic Carbon
TOC concentrations were quantified using a Shimadzu TOC-L analyzer based on high-temperature catalytic oxidation. Liquid samples were analyzed directly, with filtration applied when required. For urea measurements, non-purgeable organic carbon (NPOC) was determined by acidifying the samples to remove inorganic carbon, followed by catalytic oxidation of the remaining organic carbon to CO₂, which was detected by a non-dispersive infrared (NDIR) detector. Instrument calibration was performed using certified TOC standard solutions. Urea concentrations were subsequently calculated from the measured TOC values, assuming complete oxidation and accounting for the carbon content of urea. All measurements were conducted in triplicate to ensure analytical reproducibility.
2.10. Contact Angle Analysis
Contact angle analysis was conducted using an FM40 Easy Drop instrument (KRÜSS). Two microliter of water droplets were used for the measurements. ADVANCE software was used to acquire all the images with the droplet shape fitted using a mathematical function. The average and standard deviation values were determined for five different measurements.
2.11. Pore Size Distribution
The transport-effective pore size distribution was estimated from neutral solute rejection data using a steric transport model and assuming a log-normal distribution. Solute sizes were described by their Stokes radius, calculated from diffusivity using the Stokes–Einstein relationship. Full details of the model and fitting procedure are provided in the Supporting Information.
3. Results and Discussion
3.1. Structural and Chemical Characterization of HNDPA Membranes
Flat sheet nanocomposite membranes incorporating HNDPA water channels were prepared via an interfacial polymerization procedure, preceded by the HNDPA self-assembly, as illustrated in Figure 1a. A detailed description of the membrane fabrication protocol is provided in the Methods Section. The resulting membranes are referred to as HNDPA.
The surface wettability and morphology of the HNDPA membranes were investigated by static water contact angle measurements, AFM and cryo-scanning electron microscopy (cryo-SEM). As shown in Figure S1, the membrane exhibited a contact angle of ~59.7°, consistent with the presence of polar functionalities within the polyamide matrix and hydroxyl groups [Reference Qin, Kong and Zhang36] associated with the incorporated HNDPA moieties. Cryo-SEM and AFM topographic images (Figures 1c and S2) revealed clear differences in the surface morphology compared with the conventional polyamide membranes. The HNDPA membrane displayed a substantially lower RMS roughness (Sq = 37.3 nm) than reference polyamide membranes (Sq ~ 100 nm) [Reference Tang, Kwon and Leckie37], indicating a smoother and more uniform selective layer. This reduced roughness may also suggest a homogeneous distribution of supramolecular assemblies within the polyamide network. At higher magnification, the surface exhibited interconnected nanoscale protrusions revealing clustered nodular domains and aggregates embedded within the polyamide matrix. These features likely corresponded to localized supramolecular assemblies, resulting in a hierarchical nanostructure distinct from the typical morphology, as relealed by cryo-SEM (Figure 1c), which showed clear differences between HNDPA and a commercial BW30FRLE membrane: nodules of HNDPA assemblies were clearly observed in the dry and wet HNDPA membranes. These nodular features were observed within the selective layer in both dry and wet states, rather than exclusively at the support interface, consistent with HNDPA assemblies being embedded throughout the polyamide layer. When wet, swollen features, which are more representative of the membranes in operation conditions, were observed in both HNDPA and BW30FRLE membranes.
Further support to the incorporation of the artificial water channel assemblies was obtained by ATR-FTIR spectroscopy (Figure S3). In the full spectral range (4,000–600 cm−1), the HNDPA membrane exhibited a broad band in the 3,695–3,155 cm−1 region, attributed to O–H stretching vibrations associated with hydroxyl functionalities of the HNDPA and hydrogen-bonded water within the polyamide matrix [Reference Di Vincenzo, Tiraferri and Górecki32,Reference Hernandez, Brice and Leavitt38]. All membranes, including the commercial references (BW30FRLE and XLE, DuPont Filmtec), displayed the characteristic amide I (~1,675 cm−1) and amide II (~1,650–1,515 cm−1) bands [Reference Do, Tang, Reinhard and Leckie39,Reference Ettori, Gaudichet-Maurin, Schrotter, Aimar and Causserand40], confirming the formation of the polyamide structure. Notably, the fingerprint region (2,000–800 cm−1, Figure S3b) revealed a distinct peak at ~967 cm−1 for the HNDPA membrane, which was absent for the commercial reference and is attributed to the characteristic vibrational signature of HNDPA, as previously reported [Reference Di Vincenzo, Tiraferri and Górecki32]. This feature provides specific spectroscopic support to the successful incorporation of the supramolecular HNDPA assemblies in the selective layer. These observations are consistent with the incorporation of HNDPA assemblies within the selective layer and are further supported by previous characterization using X-ray diffraction, XPS, and NMR analyses [Reference Di Vincenzo, Tiraferri and Górecki32].
3.2. Molecular Selectivity
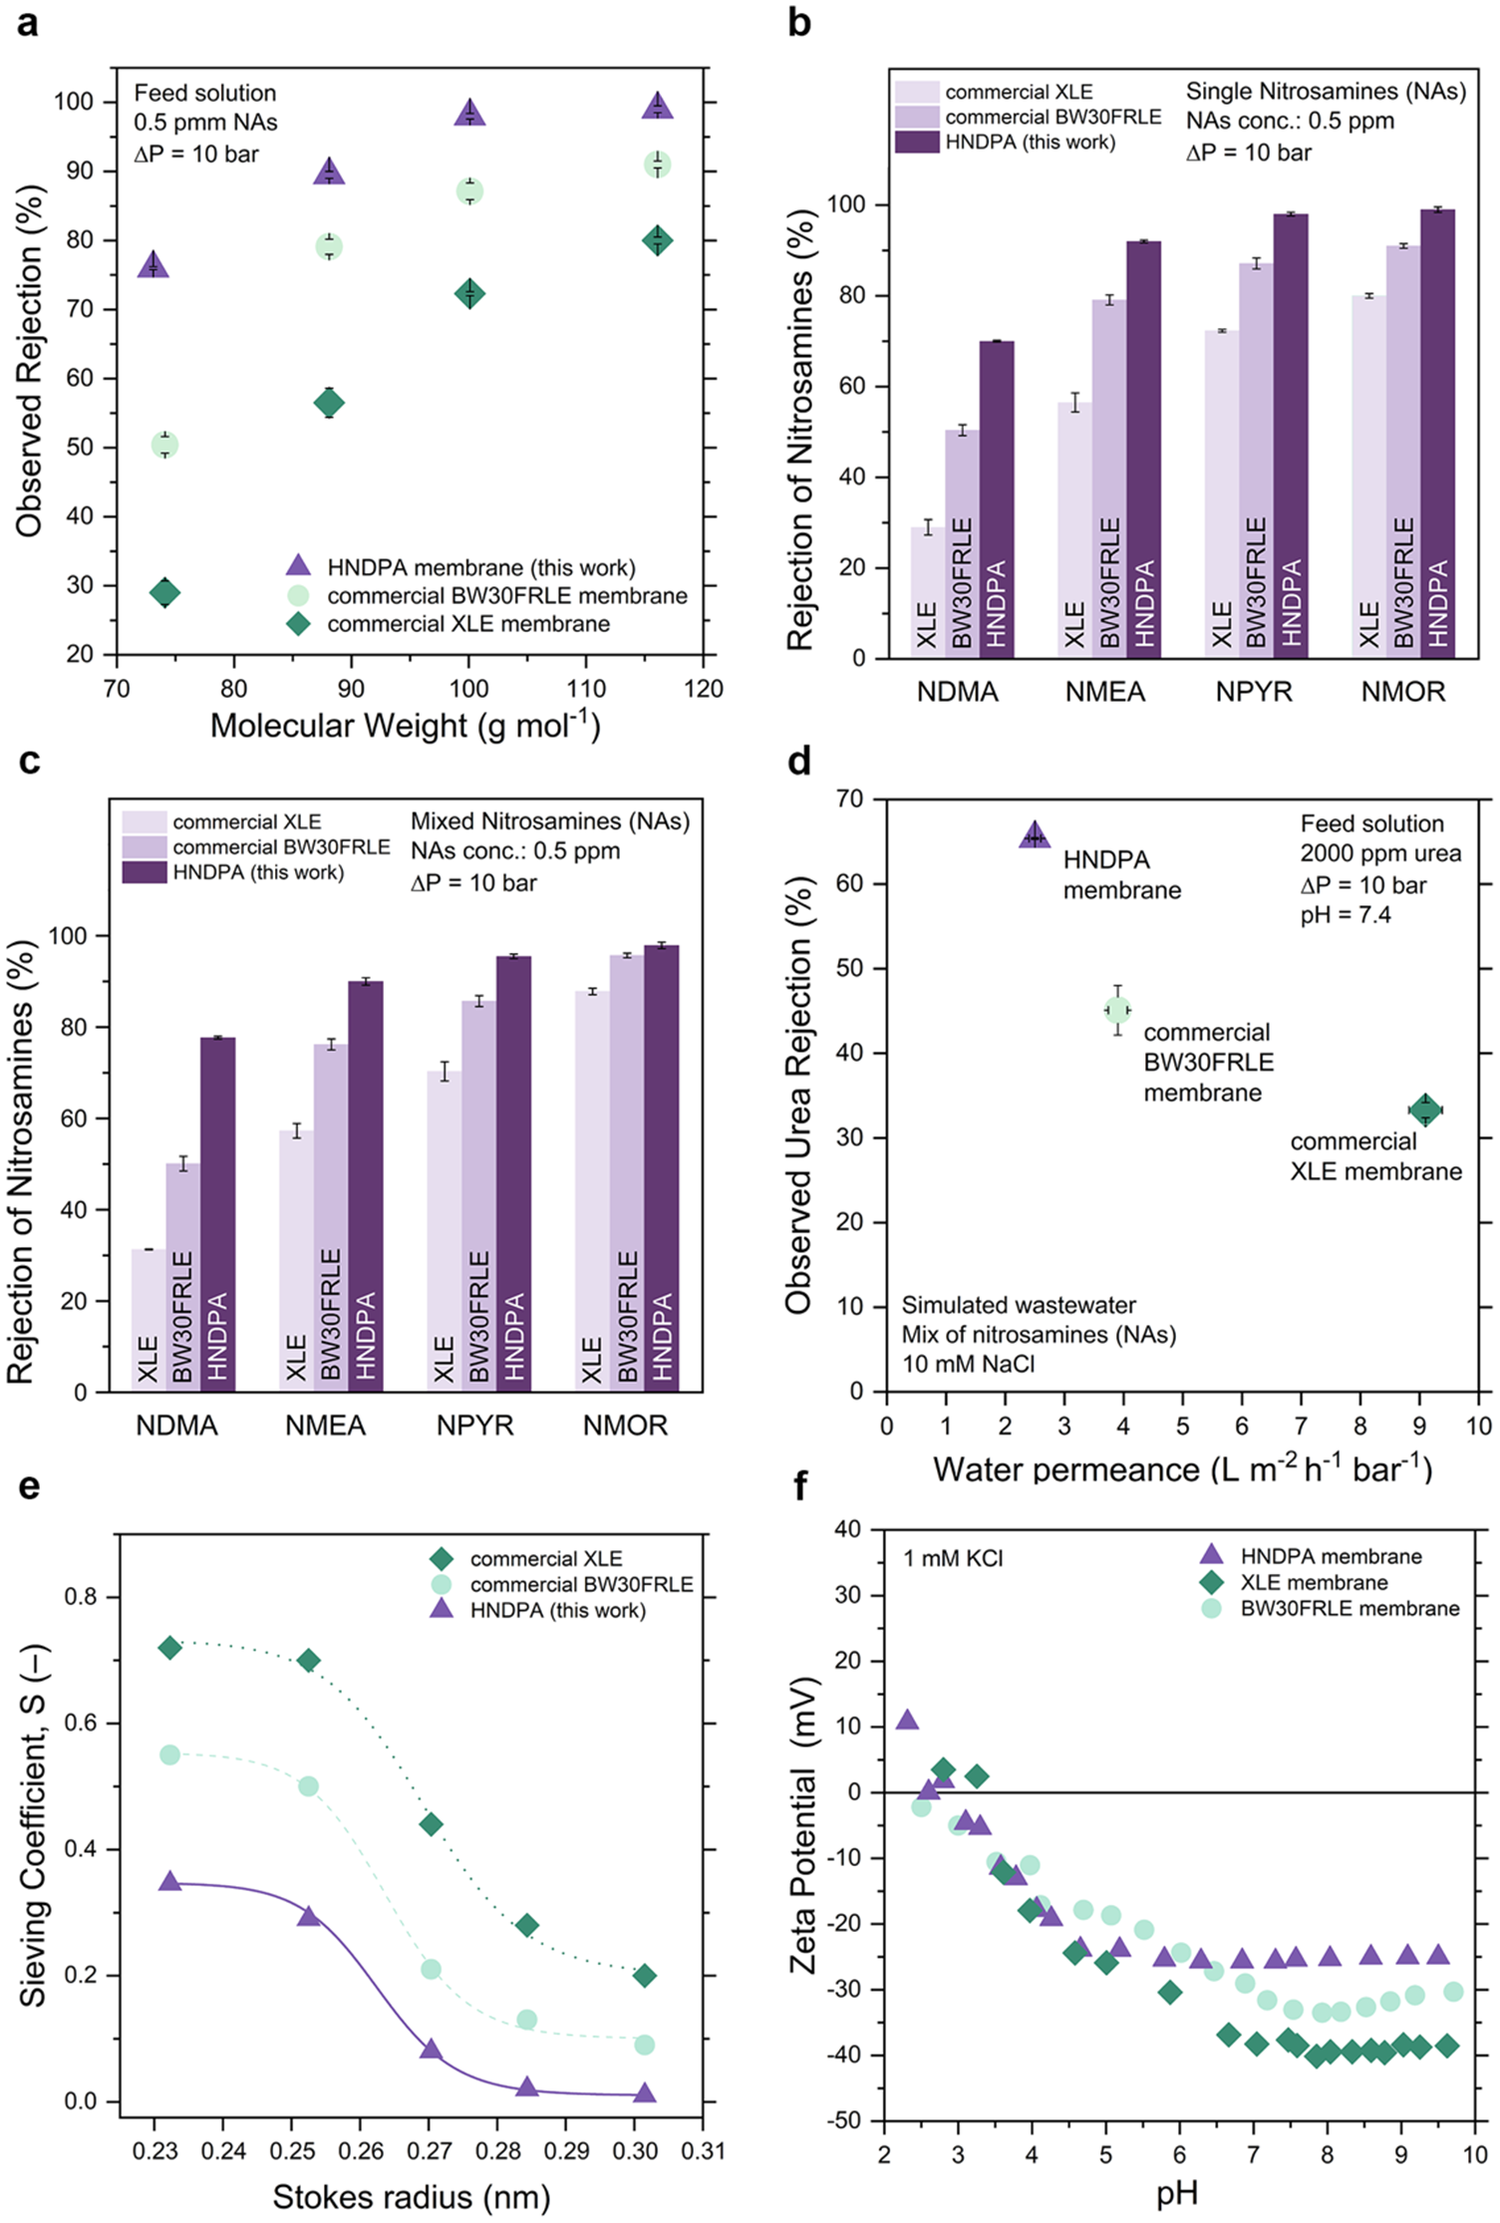
The removal of low-molecular-weight neutral pollutants remains one of the most important challenges in reverse osmosis wastewater reuse applications, as improvements in water permeability are often achieved at the expense of molecular selectivity [Reference Marron, Mitch, von Gunten and Sedlak41]. Nitrosamines, and in particular NDMA and NMEA, represent a stringent test case due to their small molecular size, neutral charge, and high mobility through conventional polyamide selective layers [Reference Fujioka, O’Rourke and Michishio42]. In this context, membranes that can simultaneously achieve high water flux while preserving tight molecular sieving are of particular interest. Here, we investigate the positioning of TFN membranes seamlessly incorporating self-assembled HNDPA water channels within the permeability-selectivity trade-off, and evaluate their rejection of low-molecular-weight solutes in comparison with state-of-the-art commercial reverse osmosis membranes. Figure 2 presents a comparative evaluation of the separation performance of the HNDPA membrane and two commercial reverse osmosis membranes (XLE and BW30FRLE, DuPont Filmtec) for the removal of low-molecular-weight nitrosamines under identical operating conditions (500 μg L⁻1 feed concentration, ΔP = 10 bar). As shown in Figure 2a, the HNDPA membrane exhibited higher rejection values across the investigated molecular weight range, while operating at lower water permeance than commercial membranes, but substantially closer to BW30FRLE than to the high-permeance XLE membrane. The pure water permeance values measured before solute addition are reported in Table S2. Notably, although the HNDPA membrane operated at lower pure water permeance than BW30FRLE (2.5 vs. 3.9 L m⁻2 h⁻1 bar⁻1), its rejection of the smallest nitrosamines increased well beyond what a permeance-driven trade-off would predict, consistent with the sharper molecular cutoff identified below. Rejection values approaching 90% were measured for NMEA (88 g mol−1), a solute close to the apparent transport cut-off, whereas both commercial membranes exhibited a pronounced decrease in rejection in this molecular weight range. Figure 2b, c report nitrosamine rejection for single-solute and mixed-solute feeds. The HNDPA membrane displayed higher rejection values than the commercial membranes for all investigated compounds (NDMA, NMEA, NPYR, and NMOR) under the tested conditions, approaching 100% for the larger nitrosamines. Similar trends are observed under mixed-solute conditions, indicating limited solute–solute competition and suggesting that the transport remains governed primarily by intrinsic membrane properties and single solute-membrane interaction rather than by the feed composition, as detailed in the Supporting Information (Table S1). In contrast, the commercial membranes displayed a stronger dependence on molecular size and reduced rejection for the smallest nitrosamines. For instance, under mixed-solute conditions, NDMA rejection increased from ~31% for the XLE membrane and ~50% for BW30FRLE to ~78% for the HNDPA membrane, while NMEA rejection increased from ~57% and ~76% to ~90%, respectively. See Tables S2–S5 for complete results.
Molecular selectivity of the HNDPA membrane. (a) Rejection of individual nitrosamines as a function of molecular weight for the HNDPA membrane and for two commercial reverse osmosis membranes (XLE, BW30FRLE). Nitrosamine rejection for single-solute (b) and mixed-solute (c) feeds. All filtration experiments were conducted at a total nitrosamine concentration of 500 μg L⁻1, an applied pressure of 10 bar, and a feed temperature of 25 ± 2°C. (d) Relationship between pure water permeance and urea rejection measured at a urea concentration of 2,000 mg L–1 at 10 bar applied pressure. (e) Sieving coefficient (S) as a function of solute Stokes radius derived from neutral solute rejection experiments. (f) Zeta potential profiles of HNDPA, XLE, and BW30FRLE membranes plotted as a function of pH in 1 mM KCl.

Figure 2. Long description
A multi-panel figure containing six graphs labeled a through f.
Panel a: A scatter plot of Observed Rejection percentage versus Molecular Weight in grams per mole. The HNDPA membrane (purple triangles) shows the highest rejection, increasing from 75 to nearly 100 percent. BW 3 0 FRLE (light green circles) follows, and XLE (dark green diamonds) shows the lowest rejection, starting at 30 percent.
Panel b: A bar chart showing rejection of single nitrosamines: NDMA, NMEA, NPYR, and NMOR. For every solute, HNDPA outperforms the commercial membranes, reaching nearly 100 percent for NMOR.
Panel c: A bar chart showing rejection of mixed-solute nitrosamines. The trends mirror panel b, with HNDPA maintaining superior rejection across all four solutes compared to XLE and BW 3 0 FRLE.
Panel d: A scatter plot of Observed Urea Rejection percentage versus Water permeance in liters per square meter per hour per bar. HNDPA is positioned in the top-left (high rejection, low permeance), while XLE is in the bottom-right (low rejection, high permeance).
Panel e: A line graph of Sieving Coefficient S versus Stokes radius in nanometers. HNDPA shows the lowest sieving coefficient (highest selectivity), with a sharp decline toward zero as the radius increases beyond 0.26 nanometers.
Panel f: A scatter plot of Zeta Potential in millivolts versus pH. All membranes show a decreasing trend from positive to negative potential as pH increases. HNDPA plateaus at approximately minus 25 millivolts for pH values above 6, while XLE reaches a more negative potential of minus 40 millivolts.
Figure 2d provides an additional comparison of membrane selectivity toward urea (60.06 g mol−1), used here as a molecular probe. Urea is electrically neutral and has lower molecular weight than nitrosamines; therefore, its rejection provides complementary information on the steric transport of low-molecular-weight neutral solutes. The HNDPA membrane exhibited higher urea rejection than both commercial membranes while operating at moderate water permeance. Rather than defining a universal permeability-selectivity trade-off, these data provide a direct membrane-to-membrane comparison under identical operating conditions. When positioned relative to XLE and BW30FRLE, the HNDPA membrane occupies a region characterized by lower water permeance but substantially higher molecular selectivity. Although the HNDPA membrane exhibited lower pure water permeance than the commercial membranes, its substantially higher rejection of small neutral solutes indicates a more selective transport environment rather than a simple shift toward lower permeability.
To further elucidate the transport characteristics, the sieving coefficient (S) was analyzed as a function of solute Stokes radius (Figure 2e). Fitting of the sieving curves and extraction of effective pore size distributions are reported in the Supporting Information (Figure S4a–f). The estimation of solute size and diffusivity, together with the analysis of neutral solute transport via sieving coefficients, is described in detail in the Supplementary Information. A smaller average effective pore radius was estimated for the HNDPA membrane (~0.44 nm), compared to BW30FRLE (~0.48 nm) and XLE (~0.51 nm). Moreover, the HNDPA membrane exhibited a sharper decline in S with increasing solute size compared to the commercial membranes, indicating a potentially narrower and more defined molecular cutoff. Note that, although the absolute difference of 0.05–0.07 nm appears small, it is in fact considerable at this length scale. In the vicinity of the molecular cut-off, steric exclusion and transport hindrance factors vary nonlinearly with the ratio between solute size and pore radius. Consequently, even a modest reduction in effective pore size can lead to a disproportionately large increase in rejection for solutes whose dimensions approach the transport threshold.
In addition to neutral solute rejection, all membranes exhibited consistently high NaCl rejection under model matrix conditions. As summarized in Tables S6 and S7 and shown in Figure S5, NaCl rejections remained above 97% for all membranes, with observed values of 98.1 ± 0.28% for the HNDPA membrane, 98.3 ± 0.31% for BW30FRLE, and 97.6 ± 0.32% for XLE. These comparable salt rejection values indicate that the incorporation of HNDPA assemblies did not measurably alter the ionic selectivity and that the observed differences in nitrosamine and urea rejection may not be attributable to or correlated with mere variations in salt transport. It should be noted that the effective pore radii were estimated from neutral solute sieving and therefore describe the steric transport environment with uncharged molecules. Salt rejection, in contrast, depends on additional factors, e.g., ion hydration, dielectric effects, and electrostatic exclusion associated with the membrane surface charge. Accordingly, the comparable NaCl rejection values observed for HNDPA and BW30FRLE do not contradict the smaller neutral solute-derived effective pore radius of the HNDPA membrane. The surface charge behavior of the membranes, assessed via zeta potential measurements in 1 mM KCl (Figure 2f) as a function of pH, revealed similar pK values for all membranes and a slightly lower charge density for the HNDPA around neutral pH compared to commercial membranes. Interestingly, the surface charge of HNDPA membranes became increasingly more negative as the pH increased up to 5, and then the zeta potential remained perfectly constant, while commercial membranes exhibited a continuously decreasing charge to roughly pH 8. The charging behavior observed for the HNDPA membrane is consistent with a surface chemistry that may limit additional hydroxyl adsorption at higher pH. Such behavior has been reported for materials exhibiting more hydrophilic interfacial characteristics.
In summary, the nearly identical NaCl rejection values and similar zeta potential of the membrane developed in this work compared to commercial ones indicate that the fixed charge density within the selective layer was not substantially altered by the incorporation of HNDPA assemblies. In practical terms, the density and distribution of charged functional groups responsible for Donnan exclusion remained of the same order of magnitude around the relevant pH for wastewater treatment, and no evidence of additional nonselective defects was observed. Ionic rejection therefore continues to be governed by electrostatic and dielectric exclusion superimposed on steric constraints, similarly to what has been frequently reported for commercial membranes [Reference Freger43]. In contrast, the high rejection of neutral solutes suggests an important modification of the purely size-selective transport pathways. The HNDPA assemblies are expected to introduce low-resistance hydraulic pathways for water. At the same time, the effective pore size analysis and neutral solute rejection data indicate that the characteristic radius of the constrictions controlling steric exclusion was not increased and was, in fact, reduced. This implies that the added water-conducting pathways did not correspond to wider accessible pores for other potential permeant molecules. Within a pore-flow framework, the water transport was partially redistributed through the low-resistance channels while the steric bottlenecks governing neutral solute passage remained tight.
3.3. Performance Under High-Recovery Conditions
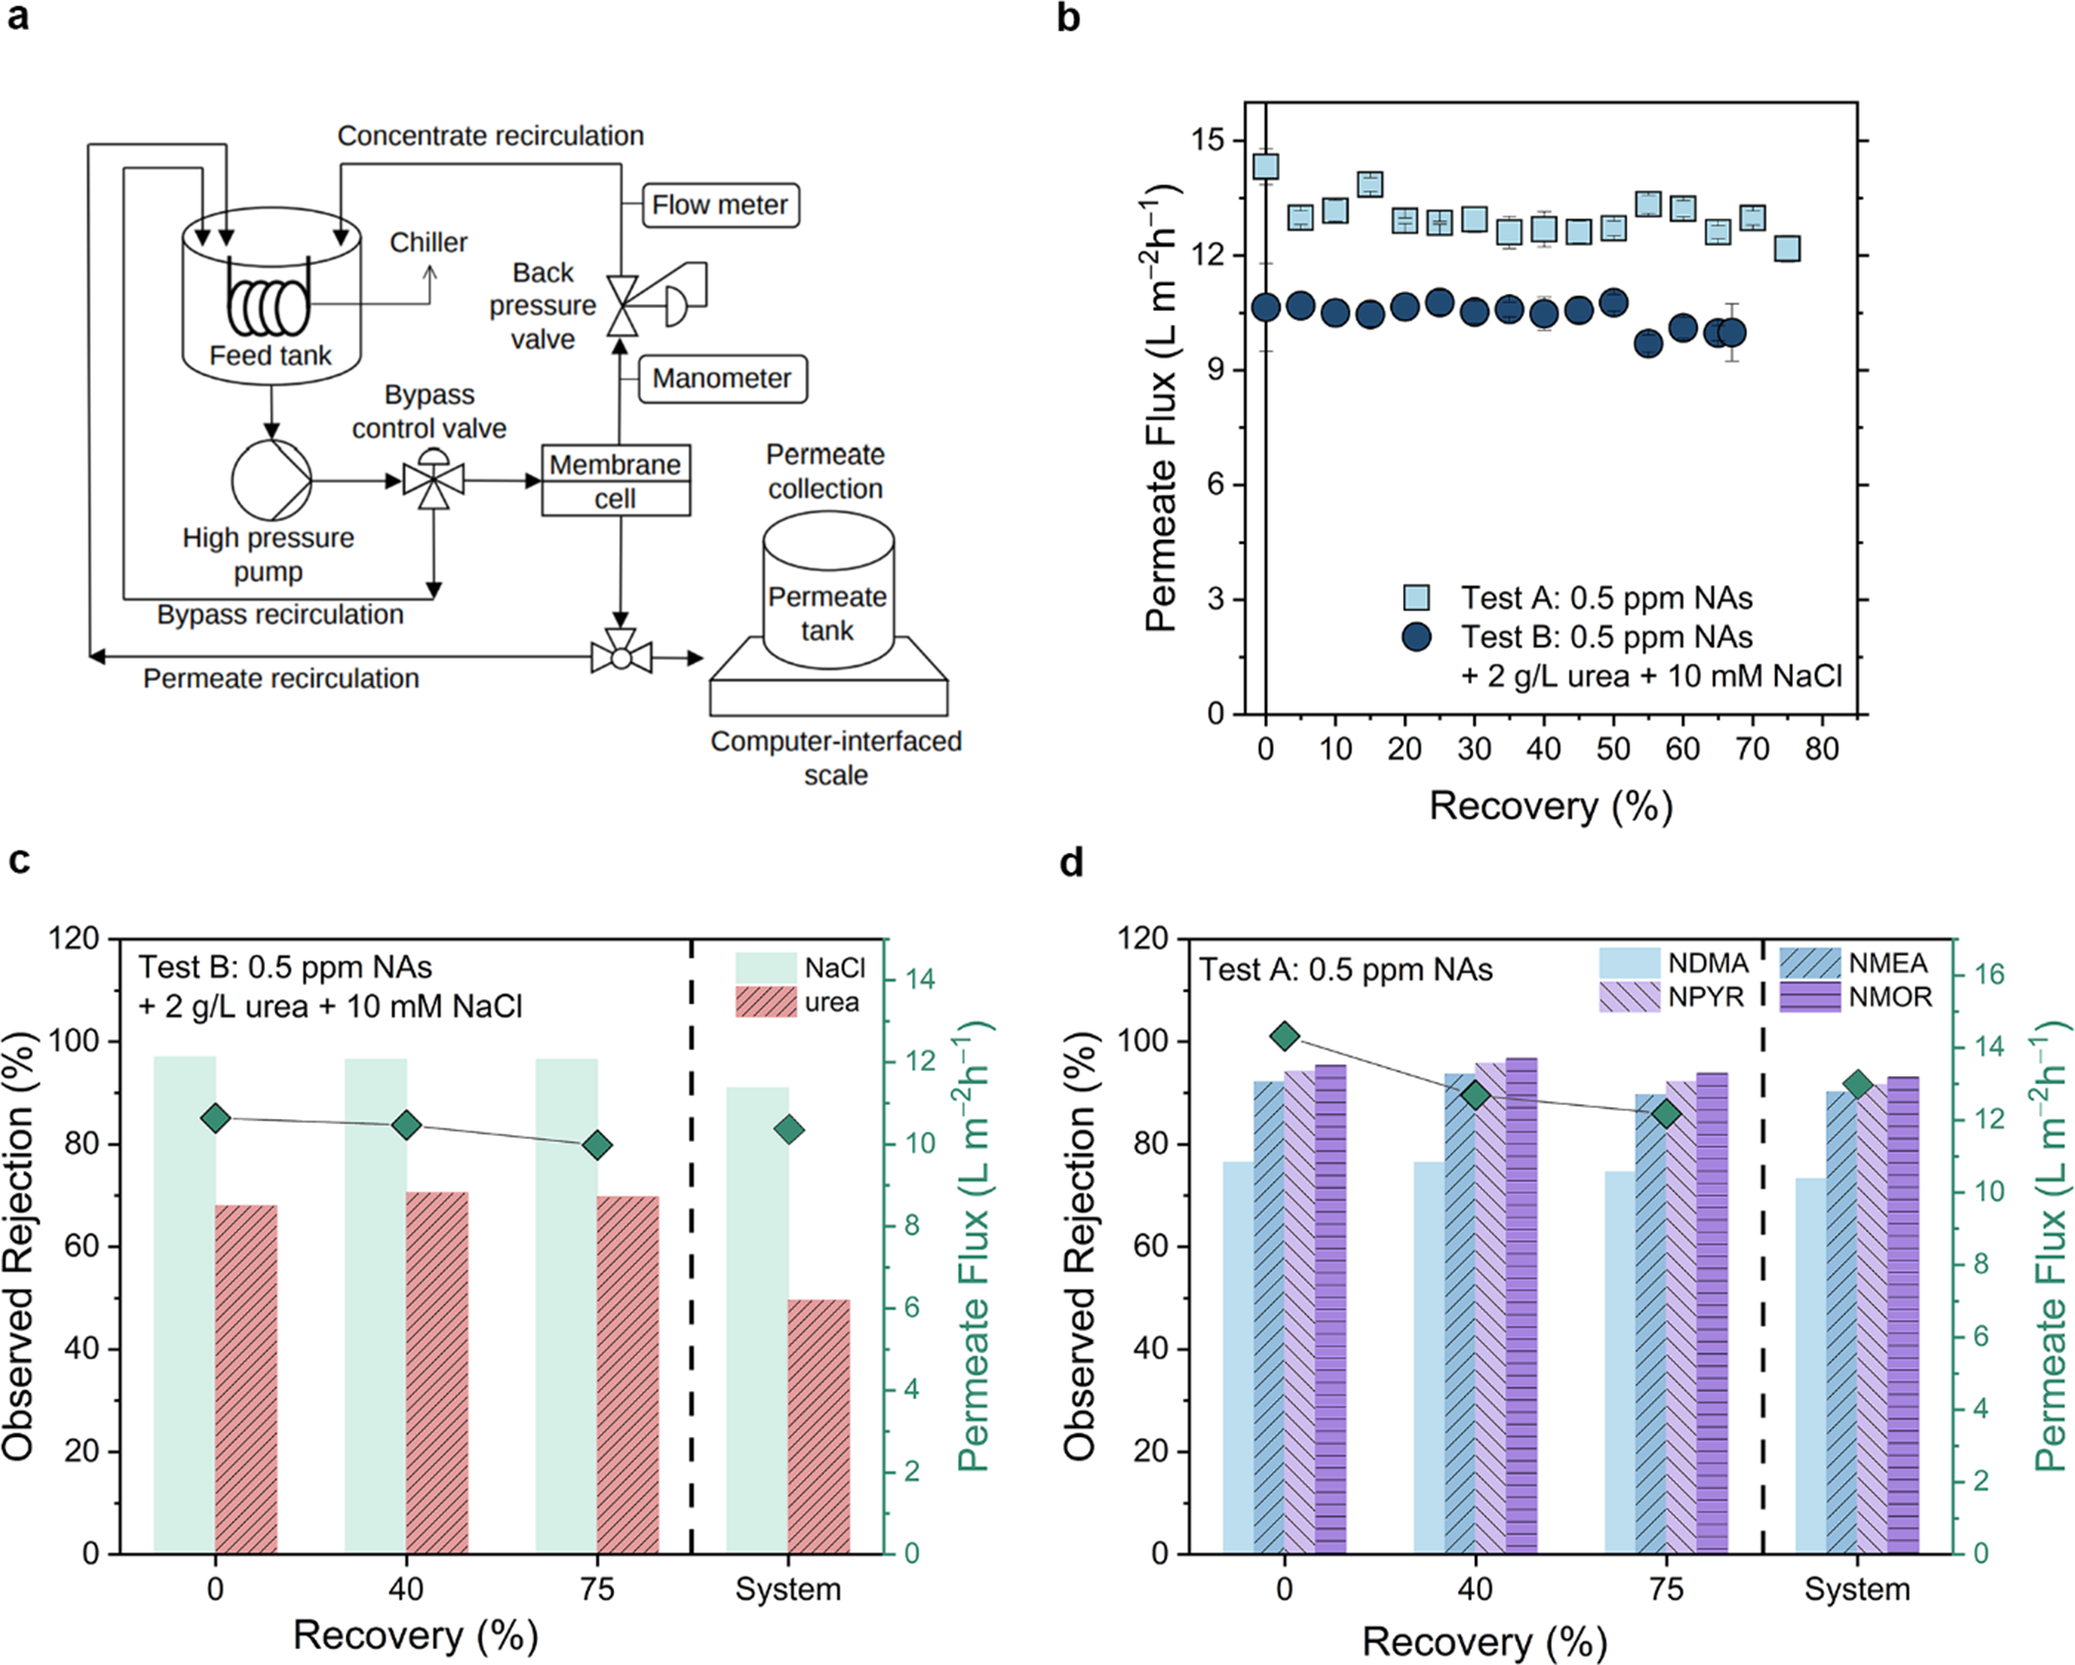
Figure 3 illustrates a schematic of the filtration system, along with the performance of the HNDPA membrane during recovery tests conducted with two feed compositions over a one-month period. Panel (b) presents the measured permeate flux as a function of recovery rate for Test A (nitrosamines only) and Test B (nitrosamines, urea, and NaCl). In both cases, the membrane maintained a stable flux throughout the tests. As expected, the addition of NaCl and urea increased the initial osmotic pressure, resulting in a lower permeate flux in Test B, with a decrease in the average permeate flux of approximately 25%. Specifically, the average flux was 13 L m−2 h−1 and just above 10 L m−2 h−1 in Test A and B, respectively. In both tests, productivity gradually declined over time due to the increasing osmotic pressure of the feed solution; however, the decrease at 75% recovery was limited to within 15% of the initial value in both cases.
Performance of the HNDPA membrane at high recovery. (a) Permeate flux as a function of recovery rate for Test A (squares) and Test B (circles). (b, c) Permeate flux (yellow squares, right y-axis) and observed rejection (bars, left white axis) of nitrosamines (NDMA, NMEA, NPYR, NMOR) from Test A in panel (b) and of electrical conductivity and urea from Test B in panel (c). Values measured at 0%, 40%, and 75% recovery are reported on the left-hand side of the panels, while the right-hand side of the panels reports the overall system rejection and the average flux. Lines connecting permeate flux data points are only meant as guidance for the eye. All experiments were conducted at a pressure of 10 ± 1 bar and a temperature of 21 ± 2°C.

Figure 3. Long description
The figure consists of four panels labeled a through d.
Panel a: A process flow diagram of the membrane system. It starts at a Feed tank containing a chiller coil. Fluid flows to a High pressure pump, then through a Bypass control valve to a Membrane cell. From the cell, the concentrate line passes through a Manometer, a Back pressure valve, and a Flow meter before returning to the Feed tank via Concentrate recirculation. The permeate line flows through a valve to a Permeate tank on a Computer-interfaced scale, with options for Permeate recirculation or Bypass recirculation back to the Feed tank.
Panel b: A line graph showing Permeate Flux in L m super minus 2 h super minus 1 on the y-axis versus Recovery percentage from 0 to 80 on the x-axis. Test A (light blue squares) shows flux fluctuating between 12 and 15 units. Test B (dark blue circles) shows a stable flux around 10 to 11 units.
Panel c: A dual-axis graph for Test B. The left y-axis shows Observed Rejection percentage (0 to 120) and the right y-axis shows Permeate Flux (0 to 15). Bar charts show Na Cl rejection (light green) consistently near 100 percent and urea rejection (red diagonal stripes) around 70 percent at 0, 40, and 75 percent recovery. Green diamonds connected by a line show flux decreasing slightly from 11 to 10 units. A separate section on the right shows ‘System’ averages.
Panel d: A dual-axis graph for Test A. The left y-axis shows Observed Rejection percentage and the right y-axis shows Permeate Flux. Grouped bars show rejection for NDMA (light blue), NMEA (blue stripes), NPYR (purple stripes), and NMOR (dark purple). Rejection rates are generally between 75 and 100 percent. Green diamonds show flux decreasing from 14 to 12 units as recovery increases from 0 to 75 percent. A ‘System’ average section is provided on the far right.
Figure 3b, c and present the observed rejection of nitrosamines in Test A and that of NaCl and urea in Test B, respectively. Among the four nitrosamines investigated in this study, NDMA exhibited the lowest rejection rate, with an overall system rejection of 73%. In contrast, rejection of NMEA, NPYR, and NMOR exceeded 90%. No major change in instantaneous rejection was observed as a function of recovery rate (Figure 3b). In Test B, EC rejection was also stable over the course of the tests, with instantaneous observed rejections exceeding 96.5% for all measurements, and an overall system rejection of 91.1% arising from concentration effects over cumulative permeate collection. The corresponding rejection values for urea were consistently higher than 65%, with only minor variation as recovery increased, highlighting better performance compared to the commercial membranes tested in this study and those reported in the literature [Reference Choi, Crane, Kang, Boyer and Perreault44,Reference Habib and Weinman45]. Nitrosamine rejection remained essentially constant across the 0%, 40%, and 75% recovery steps over the test, with no progressive decline. Moreover, the rejection levels were in agreement with those obtained in closed-loop experiments, indicating that the steric and electrostatic exclusion mechanisms identified previously remained operative under more realistic concentration conditions. Overall, the recovery tests confirm that the HNDPA membrane maintained a stable permeate flux and consistent solute rejection under increasing recovery. The rejection hierarchy among nitrosamines and the magnitude of urea and salt rejection remained aligned with the pore-size-controlled transport behavior identified in earlier sections, indicating that the structural features governing steric exclusion were preserved during prolonged operation and confirming the stability of the membrane under increasing osmotic pressure conditions. Although transient adsorption cannot be completely excluded during the initial exposure of the membrane to nitrosamines, the persistence of rejection during prolonged recovery testing and repeated filtration experiments performed over approximately 1 month indicates that the observed removal is not primarly governed by finite adsorption. Instead the sustained performance is consistent with intrinsic membrane transport selectivity.
3.4. Solute-Membrane Interactions and Transport
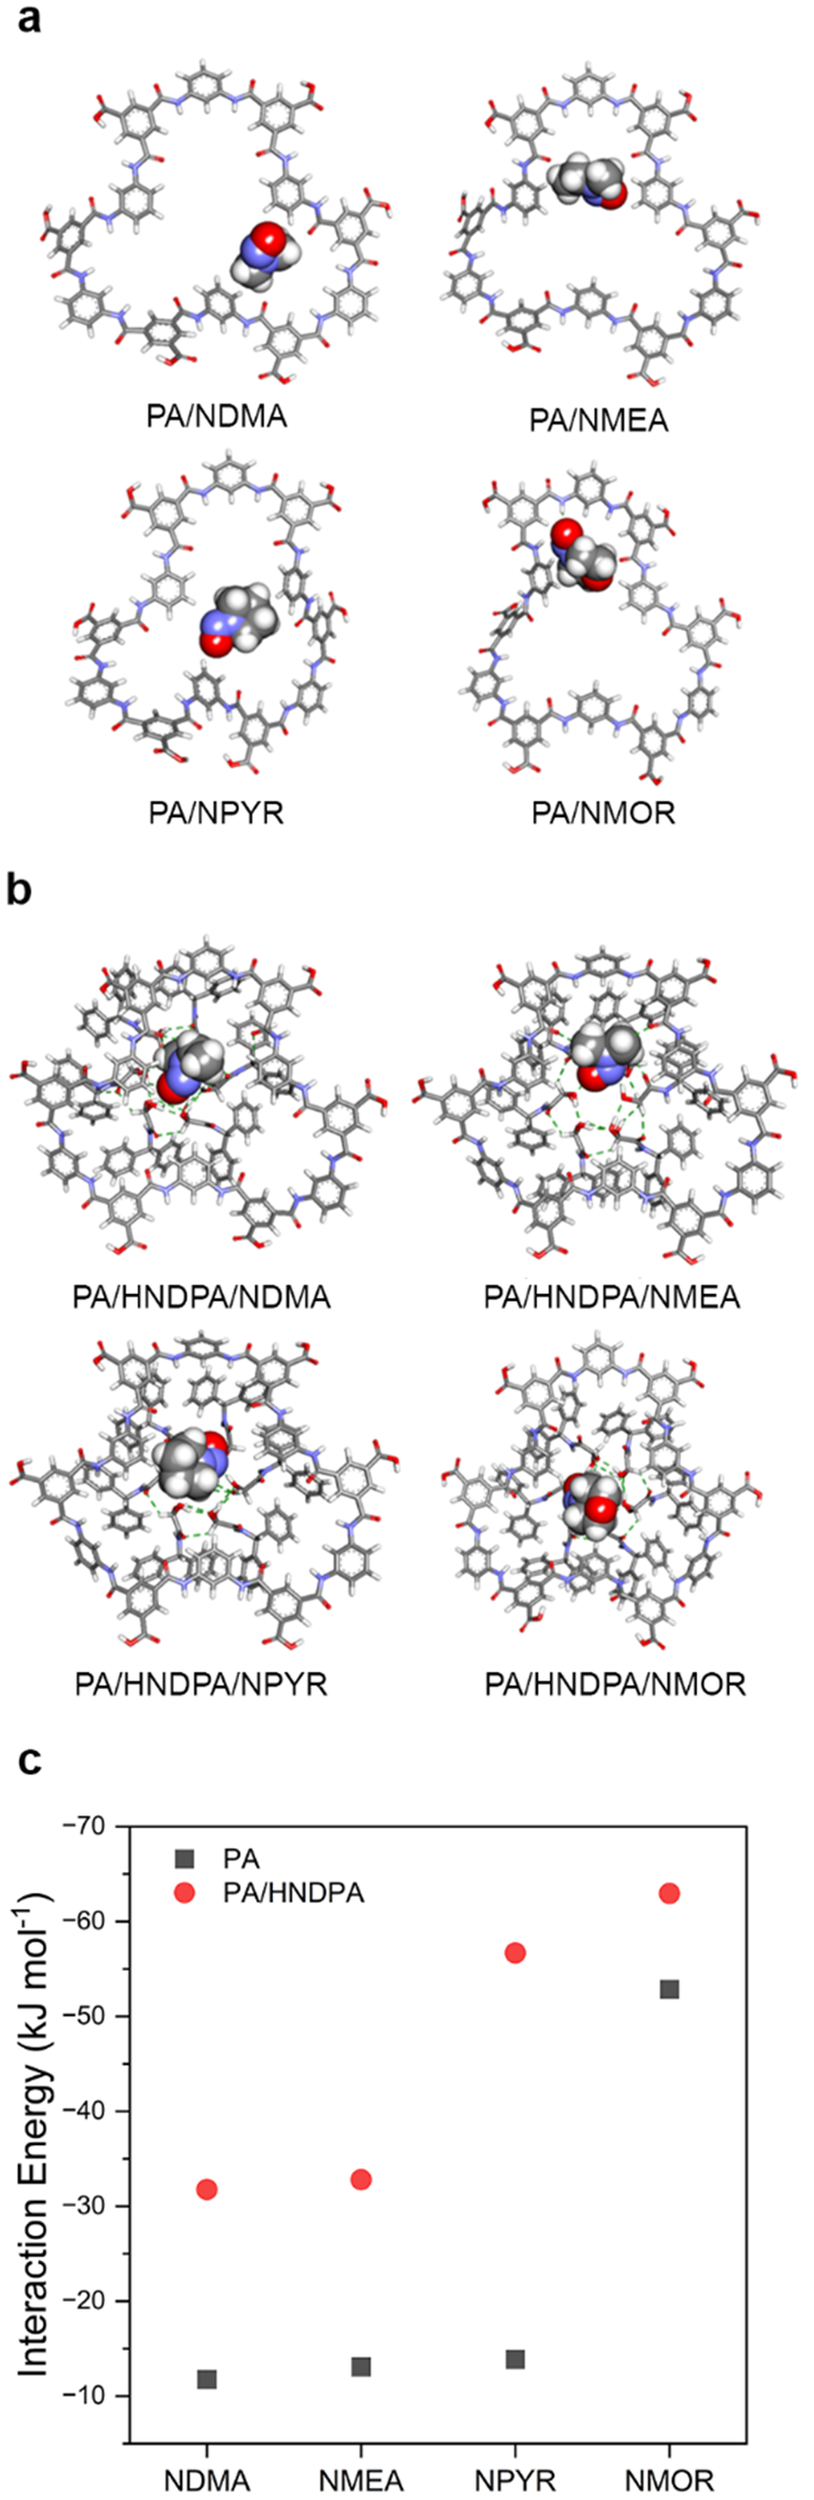
The energy-minimized structures of polyamide-nitrosamine and polyamide/HNDPA-nitrosamine systems are shown in Figure 4a, b. Nitrosamine molecules have an oxygen with lone electron pairs and could act as hydrogen acceptors. The neighboring methyl, ethyl, amine, or ether groups can slightly contribute to increasing or decreasing the electron density of the oxygen. More relevant to the observed behavior are the differences in molecular size and in the ability of each solute to approach the polymer network and access the hydrogen-donor groups of the polyamide (N–H) and HNDPA (O–H). Among the nitrosamines studied, NDMA is the smallest and would be less prone to interacting with the polymer network in the simulations. Figure 4 represents the polyamide (with and without HNDPA) conformations as it interacts with each molecule, comparing the interaction energies. In the pristine polyamide matrix, the nitrosamine molecules (NDMA, NMEA, NPYR, NMOR) were found to be accommodated within the free volume of the polymer network. The pristine polyamide does not strongly interact with NDMA, NMEA, and NPYR. Only NMOR forms substantial hydrogen bonding with the polyamide matrix, specifically between the nitrosamine oxygen and amide groups. In contrast, the simulations indicated that all nitrosamines form hydrogen bonding with the polyamide/HNDPA network, which has a high content of hydroxyl groups and therefore a stronger and more specific interaction environment.
Molecular interactions between polyamide networks and nitrosamine contaminants. (a) Energy-minimized structures of polyamide (PA) interacting with representative nitrosamine molecules (NDMA, NMEA, NPYR and NMOR). (b) Corresponding equilibrated structures of polyamide/HNDPA system, highlighting the modified polymer network and the interaction with the pollutant molecules. (c) DFT-calculated interaction energies for pristine polyamide and polyamide/HNDPA with each nitrosamine.

Figure 4. Long description
Panel a shows four ball-and-stick molecular models of a PA ring interacting with space-filling nitrosamine molecules. The models are arranged in a grid: top-left is PA forward slash NDMA, top-right is PA forward slash NMEA, bottom-left is PA forward slash NPYR, and bottom-right is PA forward slash NMOR. In each, the nitrosamine sits within the central cavity of the polymer.
Panel b shows four similar models but with a modified PA forward slash HNDPA network. The grid follows the same order: NDMA, NMEA, NPYR, and NMOR. These structures show a denser polymer network with green dashed lines indicating hydrogen bonding interactions between the polymer and the central pollutant.
Panel c is a scatter plot. The y-axis is Interaction Energy in k J mol super minus 1, ranging from minus 10 to minus 70. The x-axis lists four nitrosamines: NDM A, NMEA, NPYR, and NMOR. Two data series are shown: grey squares for P A and red circles for PA forward slash HNDPA. For all four molecules, the red circles show significantly more negative interaction energies than the grey squares. The energy values for PA are relatively flat between minus 10 and minus 15 until NMOR which drops to minus 53. The PA forward slash HNDPA values show a sharp downward trend from minus 32 for NDMA to minus 63 for NMOR
The interaction energies derived from DFT calculations (Figure 4c) further indicate that the polyamide/HNDPA membrane may consistently exhibit stronger, more stable (more negative) interactions with the solutes than the pristine polyamide. For PA/HNDPA, the simulated interaction energy followed the order NMOR > NPYR > NMEA > NDMA, which is consistent with the experimentally observed rejection trend. The stronger interactions in this case are responsible for higher friction consistent with a more restrictive transport environment. The larger and cyclic structure of NMOR and NPYR enables a convenient molecular spatial arrangement that favors the interaction with the polyamide and OH groups of the HNDPA. The smaller size and higher mobility of NDMA and NMEA facilitate transport through the polymer free volume.
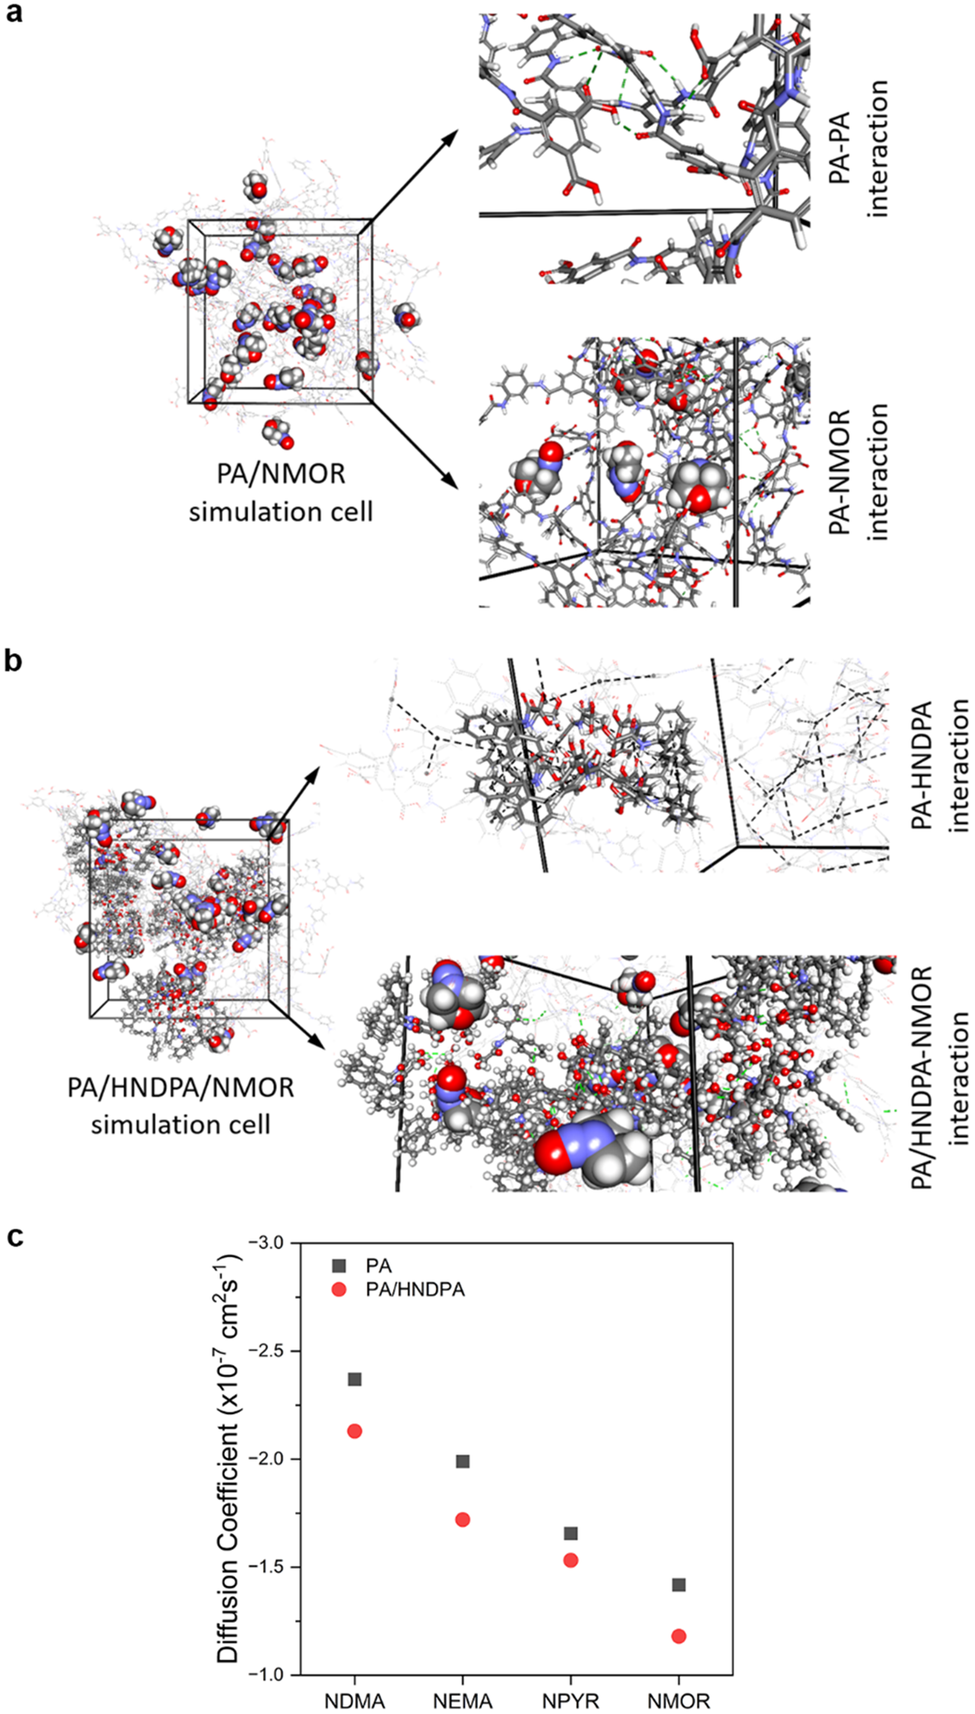
Molecular dynamics simulations provided further insight into the nature of these interactions and their impact on transport. Representative snapshots of the interaction arrangements for the polyamide–NMOR and polyamide/HNDPA–NMOR systems are shown in Figure 5a, b. In the pristine polyamide, hydrogen bonding was found to occur within the polymer network and between polyamide and NMOR, leading to partial confinement of the solute within the polymer free volume. In the polyamide/HNDPA system, additional interaction possibilities were observed from the simulations. Specifically, the aromatic groups of HNDPA interacted with the polyamide chains, while NMOR formed hydrogen bonds with the HNDPA hydroxyl groups. In the simulations, these interactions are associated with stronger binding, increased localization of the solute within the membrane matrix and friction in the transport. Diffusion coefficients obtained from MD simulations (Figure 5c) decreased in the order NDMA > NMEA > NPYR > NMOR for both membranes, reflecting the higher mobility of smaller and less binding molecules within the polymer network. The diffusion coefficients in polyamide/HNDPA membranes were systematically lower than in pristine polyamide for all nitrosamine molecules, indicating a more restrictive transport environment. This reduction was more pronounced for NPYR and NMOR, suggesting that the modified membrane imposed stronger steric and energetic constraints on these larger molecules. The molecular simulations are interpreted as qualitative support for differences in how tight the solute would interact with the membrane environments or, in opposite, be able to move freely with low friction. Representative MD snapshots for all the PA-nitrosamine and the PA/HNDPA-nitrosamine systems are provided in Supporting Figures S6–S11.
Molecular dynamics analysis of nitrosamine-membrane interactions and transport through polyamide and polyamide/HNDPA systems. (a) Representative MD snapshot of the polyamide–NMOR system, showing hydrogen bonding interactions and spatial confinement of NMOR within the polymer matrix. (b) Corresponding polyamide/HNDPA–NMOR system, showing π–π stacking alongside hydrogen bonding interactions. (c) Diffusion coefficients of nitrosamine solutes in polyamide and polyamide/HNDPA membranes obtained from MD simulations.

Figure 5. Long description
The diagram consists of three panels labeled a, b, and c.
Panel a: PA forward slash NMOR system. On the left is a PA forward slash NMOR simulation cell showing a cubic box containing a polymer matrix with NMOR molecules represented as space-filling spheres. Two arrows point to zoomed-in views on the right. The top zoom shows PA dash PA interaction with green dashed lines indicating hydrogen bonds between polymer chains. The bottom zoom shows PA dash NMOR interaction, highlighting the spatial confinement of the NMOR molecules within the PA matrix.
Panel b: PA forward slash HNDPA forward slash NMOR system. On the left is the simulation cell. Two arrows point to zoomed-in views on the right. The top zoom shows PA dash HNDPA interaction with black dashed lines indicating pi dash pi stacking. The bottom zoom shows P A forward slash HNDPA dash NMOR interaction, illustrating the combined effects of hydrogen bonding and pi stacking on the solute.
Panel c: A scatter plot showing Diffusion Coefficient (times 10 super minus 7 centimeters-squared per second) on the y-axis ranging from minus 1.0 to minus 3.0. The x-axis lists four nitrosamine solutes: NDMA, NEMA, NPYR, and NMOR. Data points for PA are represented by dark gray squares and PA forward slash HNDPA by red circles. For all four solutes, the diffusion coefficient is higher (less negative on the log scale) for PA than for PA forward slash HNDPA. The values show a downward trend from left to right, with NDMA having the highest diffusion and NMOR having the lowest.
The combined DFT and MD results showed consistent and complementary trends. Interaction energies become more negative in the order NDMA < NMEA < NPYR < NMOR, indicating a stronger affinity of larger molecules, while diffusion coefficients follow the opposite trend, reflecting reduced mobility with increasing molecular size. The polyamide/HNDPA membranes combine stronger interaction energies with lower diffusion coefficients compared to pristine polyamide. This combination implies restricted transport and is consistent with the higher rejection performance observed experimentally. If the transport were simply driven by solution–diffusion, stronger solute–polymer interactions would raise the solute partitioning and thereby increase permeability rather than rejection. The present observations are, however, more naturally described in terms of hindered solute transport: a stronger solute–membrane binding increases friction. This, together with the tighter steric confinement indicated by the sieving analysis, increases the resistance experienced by the solute within the selective layer, favoring longer residence times and thereby lowering its effective mobility. In such a picture, lower solute permeabilities result in higher rejection, as observed for the HNDPA membrane. Although the computed differences in diffusion coefficients were modest, they were systematic across all nitrosamines. The simulations were therefore used to identify qualitative mechanistic trends consistent with, rather than to quantitatively account for, the experimentally observed rejection behavior. In addition, we note that the computed interaction energies, diffusion coefficients, and rejection values all varied monotonically with the molecular size. The simulations therefore corroborated the experimental trends and offered a consistent mechanistic picture.
4. Conclusions
The removal of small neutral contaminants remains a key challenge of reverse osmosis membranes, especially when applied for advanced water reuse schemes. In this work, we demonstrate that TFN membranes incorporating supramolecular HNDPA assemblies can improve the rejection of low-molecular-weight nitrosamines while maintaining competitive water permeance. Compared with state-of-the-art commercial membranes, the HNDPA membrane exhibited a sharper molecular cutoff and higher rejection of neutral solutes, including NDMA and NMEA, which are among the most challenging nitrosamines to remove. These performance advantages were retained under mixed-solute conditions and during operation up to 75% recovery, indicating that the observed selectivity arises from intrinsic membrane transport properties rather than from feed composition alone.
The combined experimental and molecular simulation results indicate that HNDPA incorporation modifies the selective layer by creating a tighter and more restrictive transport environment for neutral solutes. Neutral solute rejection and sieving analysis showed a smaller effective pore radius and a sharper size cutoff, while DFT and MD simulations indicated stronger solute-membrane interactions and lower nitrosamine diffusion coefficients in the polyamide/HNDPA matrix. These effects are consistent with a more restrictive transport environment for small neutral solutes, achieved while retaining a water permeance suitable for reverse osmosis operation rather than the much larger permeance penalty that a uniform narrowing of the selective-layer transport pathways would entail. This favorable balance is attributed to the incorporation of the supramolecular HNDPA assemblies, whose water-transport role was characterized in detail in our previous work.
Overall, these findings show that supramolecular engineering of polyamide selective layers is a promising strategy to enhance the removal of small neutral contaminants in reverse osmosis treatment. By improving nitrosamine rejection without introducing apparent defects or compromising salt selectivity, HNDPA-based membranes provide a relevant platform for the development of safer and more selective membrane processes for advanced water reuse.
Open peer review
To view the open peer review materials for this article, please visit http://doi.org/10.1017/S2978171X26000044.
Supplementary material
To view supplementary material for this article, please visit http://doi.org/10.1017/S2978171X26000044.
Author Contributions
M.D.V. conceived the project, fabricated the membranes, performed reverse osmosis filtration experiments, and conducted TOC, LC–MS/MS, IR, AFM, contact angle, and z-potential analyses. H.V. performed molecular dynamics simulations. L.C. conducted high-recovery filtration experiments. M.R. developed and performed the LC–MS/MS analytical method. A.A. conducted cryo-SEM microscopy characterization. X.L. performed some of the filtration tests. G.S. co-supervised the molecular dynamics simulation. A.T. co-designed and supervised the reverse osmosis experiments and contributed to the manuscript. S.P.N. supervised the entire research project and manuscript revision. All authors discussed the results and approved the manuscript.
Acknowledgments
Figure 1a was created by Ana Bigio, a scientific illustrator at KAUST. This work used computational resources at the Supercomputing Laboratory at KAUST.
Financial Support
This work was sponsored by King Abdullah University of Science and Technology (KAUST), Baseline BAS/1/1057-01-01.
Competing Interests
The authors declare that they have no competing interests.
Data Availability Statement
The authors confirm that the data supporting the findings of this study are available within the article and its supplementary materials. Raw data can be made available from the authors upon request.
Ethical Standards
M.D.V. and S.N. are inventors on a provisional patent application. The patent applicant: King Abdullah University of Science and Technology (KAUST). Application number: PCT/IB2025/055014. Publication number: WO 2025/238551. Current status: PCT application pending. The specific aspect covered relates to a composite membrane in which the polyamide layer comprises a polyamide matrix and plural 2-Hydroxy-N-(diphenyl) acetamide (HNDPA) assemblies distributed within the polymeric network.


 Open access


Comments
Dr. Seth Darling
Editor-in-Chief
Cambridge Materials Water
Dear Seth,
Thank you again for the invitation to contribute to Cambridge Materials Water. This is an exciting new journal, and I am sure it will have a real impact in the community. I am submitting for consideration the manuscript “High-performance nitrosamine removal for wastewater reuse with supramolecular membranes”, co-authored by Maria Di Vincenzo, Hakkim Vovusha, Lorenzo Craveri, Misjudeen Raji, Ashraf Al-Amoudi, Xing Lu, Gyorgy Szekely, Alberto Tiraferri*, and Suzana Nunes* (*corresponding authors).
The manuscript addresses the removal of low-molecular-weight nitrosamines from wastewater. These carcinogenic micropollutants are increasingly detected in wastewater effluents and potable reuse systems. As you know, while conventional reverse osmosis membranes are highly effective for salt rejection, their limited performance in removing small neutral molecules constitute one of the big challenges of the current water treatment technologies.
We apply a thin-film nanocomposite membrane developed in our lab, which incorporates supramolecular assemblies with high water affinity but high rejection for salt and small neutral molecules.
The membranes demonstrate substantially improved performance compared to commercial reverse osmosis benchmarks. We critically analyze the performance in cross-flow experiments using methods highly sensitive for low concentrations of nitrosamines, representing real conditions and we propose explanation for the good results supported by density functional theory and molecular dynamics simulations. We use liquid chromatography mass spectroscopy as sensitive analysis method and cryo scanning electron microscopy to investigate the morphology closer to real operation conditions.
By benefiting from a scalable supramolecular design strategy, we believe this work advances the development of membranes for safe and energy-efficient potable water reuse, aligning with the focus of the journal.
We look forward to receiving your feedback.
Sincerely,
Suzana
Prof. Suzana P. Nunes
Professor of Chemical and Environmental Science and Engineering
King Abdullah University of Science and Technology (KAUST)
Email: suzana.nunes@kaust.edu.sa