1. Introduction
The dynamics of helical vortices is of fundamental interest to fluid dynamics and has direct relevance to a range of applications. Helical vortex systems are the primary characteristic of open rotor wakes, such as those generated by helicopters rotors, marine propellers and wind turbines. In all of these applications, their presence is an undesirable feature, contributing to decreased efficiency of individual turbines and wind farms, increased fatigue loading of structures, noise generation and dangerous flight aerodynamics. The relationship of these vortical structures to the rotor loading remains an open question (Sørensen Reference Sørensen2011), and a deeper understanding of the dynamics of these structures as a function of the governing variables is necessary to improve rotor wake models. In the case of wind turbines, an understanding of the evolution of these structures is essential to optimise turbine arrangement and will inevitably lead to improved modelling of wind turbine blade designs and wind farm planning.
The theoretical framework for stability of helical vortices is well established, starting with Levy & Forsdyke’s (Reference Levy and Forsdyke1928) analysis of the inviscid linear stability of a helical vortex filament, and notably furthered by Widnall (Reference Widnall1972), who considered vortices with a finite core size. Widnall’s analysis showed that an isolated helical vortex filament is susceptible to three general modes of instability: a short-wave and a long-wave mode, and a third mode resulting from the interaction of neighbouring turns of the vortex filament, known as the mutual inductance mode. The stability criteria of these modes are dependent on the helical pitch,
 $h$
, the vortex core size,
 ${\it\sigma}$
, and the vortex strength,
 ${\it\Gamma}$
, where helical pitch is defined as the axial distance separating the filament in one azimuthal revolution (see figure 1 for schematic). The subsequent inviscid linear stability analyses by Gupta & Loewy (Reference Gupta and Loewy1974) and Okulov & Sørensen (Reference Okulov and Sørensen2007) showed that multiple helical vortex systems are absolutely unstable given any source of perturbation to the system, with long and mutual inductance modes growing the fastest. Walther et al. (Reference Walther, Guénot, Machefaux, Rasmussen, Chatelain, Okulov, Sørensen, Bergdorf and Koumoutsakos2007) found similar spatial modes for finite vortex Reynolds numbers,
 $\mathit{Re}={\it\Gamma}/{\it\nu}<5000$
(
 ${\it\nu}$
is the kinematic viscosity of the fluid), using vortex panel method simulations.
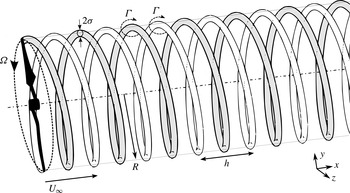
Schematic of an idealised two-helix system behind a two-bladed rotor. The free-stream flow,
 $U_{\infty }$
, is from left to right aligned with the rotor axis. The rotor has a swept area radius of
 $R$
and is rotating at a rate of
 ${\it\Omega}$
. These parameters determine the tip speed ratio,
 ${\it\lambda}={\it\Omega}R/U_{\infty }$
, and hence the tip vortex helical pitch,
 $h/R$
, and vortex core size,
 ${\it\sigma}/R$
.

Experimental observations of helical vortices in rotor wakes with (Felli, Camussi & Di Felice Reference Felli, Camussi and Di Felice2011) and without (Alfredsson & Dahlberg Reference Alfredsson and Dahlberg1979) a hub vortex, as well as numerical simulations of rotor wakes (Ivanell et al. Reference Ivanell, Mikkelsen, Sørensen and Henningson2010), have all reported that the helical vortices persist for multiple diameters downstream in the wake. Okulov & Sørensen (Reference Okulov and Sørensen2007) argued that these experimental observations of stable tip vortex configurations indicate that a stability condition for the helical vortices is satisfied by the presence of the rotor wake. They formulated an analytical model to better replicate the wake behind a rotor by embedding the tip vortices in an assigned wake flow field (modelled as an extended hub vortex). The subsequent analysis showed that stable configurations of the tip vortices were possible, and therefore that the wake swirl and interaction with the hub vortex can have a stabilising effect.
Once destabilisation of the vortex system occurs, the breakdown evolution of a turbine wake has been shown by both flow visualisations (Alfredsson & Dahlberg Reference Alfredsson and Dahlberg1979) and numerical simulations (Ivanell et al. Reference Ivanell, Mikkelsen, Sørensen and Henningson2010) to result in a pairing of the tip vortices. This is followed by entanglement of the filaments, including reorganisation and merging of the vortices.
Recent experimental focus on the instabilities in rotor wakes has provided further insight into this pairing phenomenon. Felli et al. (Reference Felli, Camussi and Di Felice2011) provided the first clear experimental evidence of the unstable modes predicted by Widnall (Reference Widnall1972) by visualising the cavitation traces in the vortex cores behind a marine propeller. They located the streamwise position where the system symmetry breaks down using a radial envelope gradient criterion of the temporal average of the cavitation traces. The symmetry breakdown was used to characterise the transition point to wake instability, and measured for varying numbers of helices and helical pitches of the vortex system. The growth rate of the system instability correlated with a reduction in wake pitch and increased core size. The authors proposed that, while multiple wavelengths were present, the wake breakdown was primarily driven by the mutual inductance of the vortices.
Similarly, experimental measurements of a three-bladed model turbine rotor by Sherry et al. (Reference Sherry, Nemes, Lo Jacono, Blackburn and Sheridan2013) investigated the pairing of both tip and root vortices and observed the same multi-step grouping process for three helices as first reported by Felli et al. (Reference Felli, Camussi and Di Felice2011). The process begins with two filaments initiating pairing that results in one pair and one single filament, after which all three filaments entangle. The study also reported on the destabilisation point of the system, with the streamwise phase-averaged deviation of the tip vortices from the location predicted by the idealised helical pitch as the criterion for destabilisation. This occurred at an axial distance of
 $0.6h$
for all helical pitch values initiating a subsequent linear streamwise divergence of the vortices. The results also showed that the phase-locked tip vortex reorganisation occurred at near the same
 $h$
distance downstream for all tip speed ratios, suggesting that the mutual inductance process has a spatial divergence rate linearly related to the helical pitch of the filaments.
More recently, Leweke et al. (Reference Leweke, Quaranta, Bolnot, Blanco-Rodríguez and Le Dizès2014) used controlled rotor phase modulation with a propeller to compare the stable helix configuration and its response to perturbations at the mutual inductance wavenumbers predicted by Widnall (Reference Widnall1972). Through flow visualisation, they related the absolute deviation (including streamwise and radial displacement) of the tip vortex from the stable configuration to the growth rate of the induced mode predicted by Widnall (Reference Widnall1972), with excellent agreement.
The recent experimental studies on helical structures (Felli et al.
Reference Felli, Camussi and Di Felice2011; Sherry et al.
Reference Sherry, Nemes, Lo Jacono, Blackburn and Sheridan2013; Leweke et al.
Reference Leweke, Quaranta, Bolnot, Blanco-Rodríguez and Le Dizès2014; Okulov et al.
Reference Okulov, Naumov, Mikkelsen, Kabardin and Sørensen2014; Viola et al.
Reference Viola, Iungo, Camarri, Porté-Agel and Gallaire2014) demonstrate that the gap between the theoretical frameworks and observations can be closed with targeted rotor experiments. To this end, the current work investigates the tip vortices in the wake of a two-bladed rotor in a water channel. The paper characterises the two-helix vortex system’s spatial evolution for varying tip speed ratios and helical spacing, and quantifies the temporal growth rate of the destabilised tip vortex trajectories. The temporal growth rates are compared to the literature on inviscid linear stability analyses for single- and double-helix configurations, showing that measurements for all
 $h/R$
are in agreement with the maximum predicted growth rates. The evolution of the tip vortices after destabilisation is demonstrated to be dominated by the mutual inductance of axially neighbouring vortex filaments.
2. Experimental configuration
The experiments were conducted in a free-surface recirculating water channel, which has a test section dimensioned at 4000 mm in length, 600 mm in width and 800 mm in depth. The free-stream velocity was maintained at
 $U_{\infty }=0.3~\text{m}~\text{s}^{-1}$
for all measurements, and the water temperature varied by less than
 $T=0.1\,^{\circ }\text{C}$
during acquisition.
The helical vortices were generated by a two-bladed rotor with a NACA4507 cross-section along the blades’ lifting surface. The rotor diameter is
 $R=115~\text{mm}$
, placing the rotor model blockage at 9 % based on swept area,
 $A_{r}=2{\rm\pi}R$
. The blade’s twist and chord were calculated using Glauert’s (Reference Glauert1935) optimum rotor theory (Sherry et al.
Reference Sherry, Nemes, Lo Jacono, Blackburn and Sheridan2013, for details, see) with the following parameters. The optimum angle is
 ${\it\alpha}_{opt}=4^{\circ }$
and the design tip speed ratio is
 ${\it\lambda}_{d}=5.5$
for a free-stream velocity of
 $U_{\infty }=0.3~\text{m}~\text{s}^{-1}$
. The rotor tip speed ratio is defined as
 ${\it\lambda}={\it\Omega}R/U_{\infty }$
, where
 ${\it\Omega}$
is the rotation rate. The design chord-based Reynolds number remains close to
 $\mathit{Re}_{c}=2.4\times 10^{4}$
along the span.
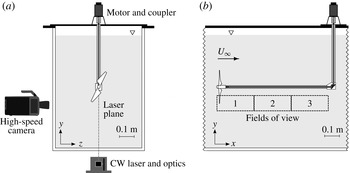
The rotor is mounted to the upstream end of a 700 mm long shaft aligned with the free-stream flow. This axial shaft enters a gearbox housing downstream that is held by a vertical support geometry through the free surface and fixed to a rigid holding plate above the channel. A controller-driven (OEM350650, Parker) micro-stepper motor (LV231-02-10-EC Drive, Parker Motion, USA) located on top of the plate provides torque via a beam coupler to an internal drive axle running on bearings in the vertical support. Mitre gears housed in the gearbox transfer the torque to the horizontal axis connected to the rotor. A schematic of the experimental set-up is shown in figure 2.
Schematic of the experimental set-up. (a) Upstream view of the rotor placement in the test section. The measurement plane is aligned with the rotor axis and illuminated by a continuous-wave (CW) laser. (b) Side view showing the horizontal support and the three measurement windows. The free-stream velocity is from left to right.

Measurements of the helical vortices were acquired using two-dimensional planar time-resolved particle image velocimetry (TR-PIV). The flow was seeded with polyamide particles (Vestosint 2157, Degussa AG, Germany) with a nominal diameter of
 $56~{\rm\mu}\text{m}$
and a specific weight of
 $1.016~\text{g}~\text{cm}^{-3}$
. A continuous-wave (CW) Nd:YAG laser (85-GHS-309, Melles Griot) producing a 2 mm thick laser sheet illuminated the particles in the measurement plane. A high-speed CMOS camera (Y4, IDT) with
 $1024~\text{pixel}\times 1024~\text{pixel}$
resolution and equipped with a 105 mm lens (AF105 Nikkor, Nikon Corporation) acquired cinematic images of the seeded flow. An in-house cross-correlation code (Fouras, Lo Jacono & Hourigan Reference Fouras, Lo Jacono and Hourigan2008) calculated the instantaneous velocity vector field (
 $\boldsymbol{u},\boldsymbol{v}$
) from the image pairs using an iterative adaptive scheme on
 $32~\text{pixel}\times 32~\text{pixel}$
interrogation windows with 75 % overlap for a spatial resolution of
 $1.5\times 10^{-2}\,R$
, also providing the out-of-plane vorticity component,
 ${\it\omega}$
(Fouras & Soria Reference Fouras and Soria1998). The TR-PIV measurements captured the wake shear layer at three streamwise locations at independent times, up to a distance of just over
 $x/R=5.5$
downstream of the rotor.
3. Evolution of two helical vortices
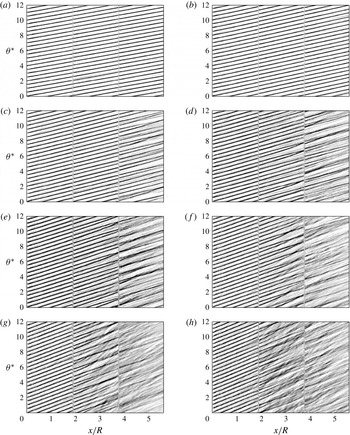
Figure 3 shows the streamwise evolution of the tip vortices for
 ${\it\lambda}=3{-}6.5$
in 0.5 increments. The panels are composed of three independent measurements, visible in the panels as vertical lines, and contour discontinuities located at
 $x/R=1.9$
and 3.8. The contours in each panel represent the intensity,
 $I_{{\it\omega}}(x,t)$
, of the instantaneous out-of-plane vorticity for distance behind the rotor,
 $x/R$
, and time,
 ${\it\theta}^{\ast }$
, non-dimensionalised by time for one rotation of the turbine. The scalar
 $I_{{\it\omega}}(x,t)$
is similar to the average intensity scalar described in Sherry et al. (Reference Sherry, Nemes, Lo Jacono, Blackburn and Sheridan2013) and is defined as the average out-of-plane vorticity in the rotor radial direction (
 $y$
direction in the measurement plane) at each axial location,
 $x$
, in the shear layer at an instant in time:
 $$\begin{eqnarray}I_{{\it\omega}}(x,t)=\int _{0}^{\infty }{\it\omega}(x,y,t)\,\text{d}y.\end{eqnarray}$$
The panels show increasing
 ${\it\lambda}$
across and down the page, with the first plot,
 ${\it\lambda}=3.0$
, maintaining a stable configuration of the two-helix system through the entire domain. This case is considered to be a reference ‘stable’ case in the sense that the vortices maintain helical spacing in the streamwise sense, represented by straight-line contours of constant slope throughout the measurement domain. An increase in tip speed ratio results in a steeper slope in the contour plots, as the axial pitch,
 $h$
, of the helical vortices reduces with rotation rate. For
 ${\it\lambda}=3.5$
, the contour lines still suggest a close to stable helix configuration, but the temporal spacing varies between contours at the end of the measurement domain,
 $x/R>5.5$
; a sign of destabilisation of the helical system.
Streamwise–temporal evolution of the instantaneous tip vortices for varying tip speed ratio,
 ${\it\lambda}$
: (a) 3.0, (b) 3.5, (c) 4.0, (d) 4.5, (e) 5.0, ( f) 5.5, (g) 6.0 and (h) 6.5. Dark contours represent normalised vorticity intensity,
 $I_{{\it\omega}}$
, for non-dimensionalised time,
 ${\it\theta}^{\ast }$
, and downstream location,
 $x/R$
. Intersecting contours denote location where the vortices are at the same streamwise location simultaneously.

The pairing of the helices first occurs at
 ${\it\lambda}=4.0$
, seen in the convergence and intersection of contour lines. The intersection points move upstream with decreasing helical pitch, as observed by Felli et al. (Reference Felli, Camussi and Di Felice2011) and Sherry et al. (Reference Sherry, Nemes, Lo Jacono, Blackburn and Sheridan2013), and denote the streamwise locations where two vortices are at equal axial distance in the wake through mutual inductance. This pairing phenomenon and the streamwise location of the contour intersections vary between vortices as well as in time, revealed by discontinuities in the contour lines between independent measurement frames for tip speed ratios above
 ${\it\lambda}=3.5$
. Hence, unlike the phase-averaged measurements presented in Sherry et al. (Reference Sherry, Nemes, Lo Jacono, Blackburn and Sheridan2013), the instantaneous locations of the reorganisation is not constant with rotor phase angle. The discontinuities and unsteady behaviour appear in phase-averaged measurements as a ‘wandering’ of the vortex (Sherry et al.
Reference Sherry, Nemes, Lo Jacono, Blackburn and Sheridan2013), which has previously been linked by Dobrev et al. (Reference Dobrev, Maalouf, Troldborg and Massouh2008) to the instability mechanisms in rotor wakes analysed by Okulov & Sørensen (Reference Okulov and Sørensen2007).
At higher tip speed ratios, the entanglement process of the two filaments exhibits two distinct behaviours. First seen in
 ${\it\lambda}=4.5$
, the contours intermittently intersect without merging as the tip vortices reorganise in the wake, similar to the ‘leap-frogging’ phenomenon of vortex rings, followed by filament entanglement occurring further downstream. Above
 ${\it\lambda}>4.5$
, the pairing leads to a broader vorticity signal downstream of the intersection points as the proximity of the filaments to one another leads to a breakdown of the coherent structures and diffusion of the vorticity (Felli et al.
Reference Felli, Camussi and Di Felice2011).
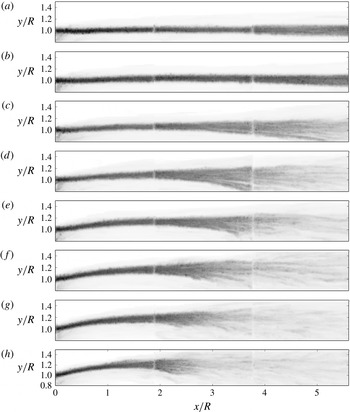
Distribution of maximum vorticity in the field for increasing tip speed ratios of the two-bladed rotor,
 ${\it\lambda}$
: (a) 3.0, (b) 3.5, (c) 4.0, (d) 4.5, (e) 5.0, ( f) 5.5, (g) 6.0 and (h) 6.5. The overlaps of the three camera positions are visible at streamwise locations,
 $x/R=1.9$
and 3.8. Breakdown of the wake moves upstream with
 ${\it\lambda}$
.

These interactions influence the coherence of the wake at the end of the measurement domain at a distance of
 $x/R=5.5$
. For low
 ${\it\lambda}$
the helical pitch is unaffected, leading to coherent vortices exiting the domain. In open rotor applications, the coherent structures observed would result in periodic forcing on objects downstream in the wake. For reduced helical pitch, the diffuse contours exiting the measurement area support the argument that earlier interaction of the structures accelerates the transition to the turbulent far wake.
Further insight into the pairing mechanism and the influence of
 ${\it\lambda}$
is revealed by examining the radial evolution of the helical vortices, extracted from the
 ${\it\omega}$
vorticity scalar field in figure 4. The plots show all fields of view (FOVs) of the shear layer where the helical tip vortices intersect the
 $x{-}y$
measurement plane, with the free-stream velocity oriented to the right. The dark contours in this figure represent the maximum vorticity scalar calculated in the dataset for each vector, defined as
 $$\begin{eqnarray}J_{{\it\omega}}(x,y)=\max ({\it\omega}(x,y,t_{1}),\dots ,{\it\omega}(x,y,t_{n}))\end{eqnarray}$$
where
 $n$
is the number of vector fields. The contours represent the temporal maxima envelope of vorticity.
As the vortices are embedded in the shear layer of the wake boundary, the vorticity maxima plots also reveal the influence of
 ${\it\lambda}$
on the wake shear layer development. For
 ${\it\lambda}=3.0$
, referenced as the stable configuration, the wake boundary retains a constant
 $y/R$
value, although the contour spreads radially near
 $x/R=5.5$
. The constant radial location of the stable case signifies a wake with no wake expansion representing a low rotor loading scenario, and no evidence of mutual inductance of the tip vortices. It does capture the broadening of the shear layer that may be attributable to turbulent mixing and viscous diffusion. As
 ${\it\lambda}$
increases, the tip vortices move radially outwards from the rotor tip, signifying an increase in rotor loading. The higher tip speed ratios therefore have a larger energy transfer from the fluid to the rotor, increasing the velocity deficit and the base pressure in the wake. Consequently, at higher
 ${\it\lambda}$
, the vortices are shifted radially outwards by the expanding wake. A notable result is that the effect of this wake expansion is not evident on the advection speed of the vortices (e.g.
 ${\it\lambda}=6$
in figure 3).
The radial envelope of the vortex signatures broadens with
 ${\it\lambda}$
and with a divergence rate resembling an exponential profile as the adjacent filaments induce radial velocities on each other via the Biot–Savart law. The decrease in the maximum vorticity intensity signifies the diffusion of the coherent structures in the wake resulting from filament entanglement. The envelopes capture the expansion of the shear layer, which, along with the tip vortex breakup and dissipation, accelerates the transition to the far-wake profile through an energy cascade from the tip vortices to smaller scales. The radial envelope, and hence this transition region, moves upstream as the helical pitch is reduced.
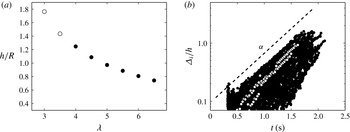
For the current two-helix configuration, the helical pitch of a single filament is equal to twice the axial distance between vortices. As the advection speed is a function of rotor loading and influenced by the interaction of the vortices, this value varies with vortex age. A representative helical pitch to characterise the results is therefore defined as the dominant value obtained from spectral analysis of the spatiotemporal plots in figure 3. The helical pitch for varying tip speed ratio is shown in figure 5(a), extracted from the first camera location using a spatial dynamic mode decomposition (DMD), acting as a discrete Fourier transform in space (Chen, Tu & Rowley Reference Chen, Tu and Rowley2012).
(a) The non-dimensionalised axial pitch,
 $h/R$
, of the helices for varying tip speed ratio,
 ${\it\lambda}$
. Open circles represent cases with low divergence rate. (b) An example of the temporal growth rates of the helical configuration’s symmetry breakdown for
 ${\it\lambda}=4.5$
. Closed circles represent all measurements; open circles represent two independent measurements overlaid. The dashed line has an exponential slope of
 ${\it\alpha}=1.95$
used as the initial guess to fit the independent measurements.

The above characterisation of the wake, along with recent experimental results of Felli et al. (Reference Felli, Camussi and Di Felice2011) and Sherry et al. (Reference Sherry, Nemes, Lo Jacono, Blackburn and Sheridan2013), support the argument that the mutual inductance mode is the dominant phenomenon driving the breakdown of the helices in the rotor wake. Characterisation of the transition to instability has been done using symmetry-breaking radial (Felli et al. Reference Felli, Camussi and Di Felice2011) and streamwise (Sherry et al. Reference Sherry, Nemes, Lo Jacono, Blackburn and Sheridan2013) criteria, while recent experiments (Leweke et al. Reference Leweke, Quaranta, Bolnot, Blanco-Rodríguez and Le Dizès2014) have shown that consideration of both provides an accurate measure of the temporal growth rate for induced instability modes. Characterising the helical vortices’ divergence for varying rotor load (and hence helical pitch) can then be expected to provide an estimate of the growth rate of the dominant mode (or a combination of modes) in the rotor wake.
To characterise the vortex growth rates, the vortex positions were identified by fitting
 $\boldsymbol{u},\boldsymbol{v}$
velocity fields of a Lamb–Oseen vortex to the TR-PIV data. This was done in a least-squares sense, with the fitting parameters selected as the vortex core location,
 $x_{c},y_{c}$
, the circulation strength,
 ${\it\Gamma}$
, and vortex core size,
 ${\it\sigma}$
, of the tip vortices at all vortex ages in the FOV. As the vortices are naturally perturbed from a stable configuration, the absolute deviation,
 $d_{i}$
, of a vortex element in the plane (vortex
 $i$
) from its predicted stable configuration was selected as the measure of divergence due to destabilisation, and hence the growth rate of the instabilities. This measure of growth rate was shown by Leweke et al. (Reference Leweke, Quaranta, Bolnot, Blanco-Rodríguez and Le Dizès2014) to be similar to the difference in absolute separation distance of a vortex from its downstream and upstream neighbours within the measurement plane,
 $d_{i}\approx |d_{i,i-1}-d_{i,i+1}|$
, where
 $d_{i}$
refers to the distance of vortex
 $i$
from its stable configuration,
 $d_{i,i-1}$
denotes the distance to its axially upstream adjacent neighbour, and
 $d_{i,i+1}$
that to its downstream neighbour. This related measure is readily available from the measurements, while a measure of the deviation from the stable configuration requires modelling assumptions. An example of the spread of the deviation (labelled from here on as
 ${\it\Delta}_{i}$
) is shown in figure 5(b).
The figure shows the
 ${\it\Delta}_{i}/h$
value over the first two seconds for a tip speed ratio of
 ${\it\lambda}=4.5$
. Tuning parameters toleranced the maximum allowable vortex fitting changes between sampled PIV fields. This minimised spurious growth rates due to temporal independence encountered between the independently acquired PIV frames and the effect of the breakdown of the coherent structures on the vortex identification. The plot shows the deviation of all vortices (closed circles) and two independent vortices as examples (open circles). The latter reveals the discontinuities due to the independent measurements that were within toleranced values.
The divergence of the vortices is captured as it evolves downstream in the open wake flow. However, it is the temporal evolution that is of interest and allows for comparison to temporal stability theory of helical vortices. A transform to temporal growth rate is made using acquisition time under the assumptions that (i) the response is dominated by the temporal evolution of the instability and (ii) the vortex element is advected in the streamwise direction at the mean axial induction velocity – referred to as the roller-bearing analogy (Okulov & Sørensen Reference Okulov and Sørensen2010). This conversion allows for a meaningful comparison of the experimental divergence rate to the temporal growth rates from theory.
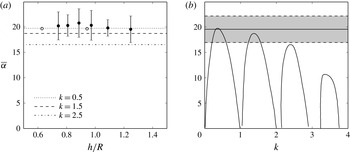
(a) The growth rate,
 $\overline{{\it\alpha}}$
, as a function of helical pitch,
 $h/R$
, for
 ${\it\lambda}\geqslant 4.0$
. Open circles represent maximum linear stability growth rates for two helices (Gupta & Loewy Reference Gupta and Loewy1974); lines represent maximum
 $\overline{{\it\alpha}}(k)$
shown in panel (b). (b) Comparison of the measured growth rate for two helices with tip vortex spacing of
 $h/2R=0.63$
,
 ${\it\sigma}/R=0.06$
for
 ${\it\lambda}=4.0$
(straight line, with grey shading marking standard deviation bounds) against theoretical growth rates of a single helix as a function of wavenumber,
 $k$
, for
 $h/R=0.63$
and
 ${\it\sigma}/R=0.1$
(Widnall Reference Widnall1972).

The response of the vortices varies considerably within the envelope, shown by the spread in figure 5(b) and the variation in the spatiotemporal diagrams in figure 3. This is expected for a natural system without a controlled perturbation, as the destabilisation of each vortex element grows from a perturbation field that varies in time and space. This field accounts for wake dynamics related to the rotor and hub axis, nonlinear interactions with neighbouring vortices and upstream flow conditions such as turbulence. Nevertheless, the growth rates in figure 5(b) exhibit a well-defined envelope of all the deviations measured (closed circles). This envelope defines the limiting earliest response in terms of growth rate resulting from the perturbation field – which is also the response least affected by downstream interactions. As such, it is considered a suitable limiting criterion to characterise the response of the system for each
 ${\it\lambda}$
.
To provide a robust description of the growth rate, the estimated slope of the envelope (dashed line) was used only as the initial guess for a least-squares fitting of all independent measurements (e.g. open circles) that exhibited an exponential growth. The average and standard deviation of the fits was measured to provide an estimate of the growth rate for each tip speed ratio. A tuned tolerance on growth rates (a maximum step size in consecutive measurements) was used to filter the larger discontinuities in the divergence from the independent measurement frames and to discount slopes related to downstream nonlinear interactions of already destabilised vortices in the average. Figure 6(a) shows the non-dimensionalised growth rates,
 $\overline{{\it\alpha}}=2{\rm\pi}h^{2}{\it\alpha}/{\it\Gamma}$
, provided by Gupta & Loewy (Reference Gupta and Loewy1974), for two interdigitated vortices (open circles) along with the measured growth rates from the experiment for
 ${\it\lambda}=4{-}6.5$
(filled circles). The uncertainty (5–12 %) of the measurements is due to the small statistical sample available for each tip speed ratio (20–30 vortex paths). The full spectrum of growth rates embedded in the system could not be accurately characterised from the limited set of independent vortices and sequential frames. Furthermore, the calculated growth rates were found to be consistently larger (4–11 %) than initial estimates of the envelope slope (dashed line). This is a result of the average growth rates increasing with distance from the rotor plane as seen in figure 5(b), and, as such, the envelope has a lower growth rate than the average.
Growth rates for
 ${\it\lambda}<4$
are not available, as no clear deviation could be measured. The open circles represent the maximum amplification calculated for all wavenumbers by Gupta & Loewy (Reference Gupta and Loewy1974) for a two-helix configuration. Though only two helical pitches were studied for the two-helix configuration with a comparable core size (theory,
 ${\it\sigma}/R=0.1$
; experiment,
 ${\it\sigma}/R<0.07$
), the analytical values are in agreement with the current experimental measurements. Moreover, the collapse between measurements supports the argument that the wake breakdown is driven by the mutual inductance of the axially spaced vortex elements. Although the error bounds are large to confirm the following observation, it is worth mentioning that the measured growth rates peak at the design
 ${\it\lambda}$
value. At the design
 ${\it\lambda}$
value, the optimum rotor operates at maximum efficiency and minimises the blade wake (Sherry et al.
Reference Sherry, Nemes, Lo Jacono, Blackburn and Sheridan2013), a result that could influence the instability mechanism of the core – Okulov & Sørensen (Reference Okulov and Sørensen2007) put forward the argument that the blade wakes may act as a destabilising mechanism of the core.
Figure 6(b) provides a comparison of the growth rate at
 ${\it\lambda}=4.0$
against Widnall’s growth rate for a single helix with pitch
 $h/R=0.63$
. The experimental result has two helices, with an axial helical spacing of
 $h/2R=0.63$
, so, while the stable configurations differ by a factor of two, the axial spacing between vortex structures is equivalent. The measured growth rate (straight line with grey region bounding the fit variability) is in reasonable agreement with inviscid linear stability’s growth rate for the fastest-growing unstable wavenumbers,
 $k=0.5$
and 1.5. As these wavenumbers represent the mutual inductance and long-wave modes for a single helix, the comparison between the single and double helix is appropriate, as the filament pitch doubling affects self-induction at higher wavenumbers, but the equivalent axial proximity of vortices would retain the same induction mode, albeit at a doubled wavenumber.
4. Concluding remarks
These experiments have characterised the tip vortex evolution and breakup of the coherent structures in the wake behind a two-bladed rotor over a range of tip speed ratios. An increase in
 ${\it\lambda}$
, which influences both helical pitch and wake expansion, amplifies the rate of destabilisation and the unsteady mutual inductance of the helical vortices.
Quantification of the tip vortex divergence shows that the non-dimensional temporal growth rate,
 $\overline{{\it\alpha}}$
, is in agreement with the theoretical growth rates for an inviscid two-helix configuration, and captures the evolution of the vortex pairing. The results also show that the measured maximum growth rate of a two-helix configuration match those of a single helix with equivalent axial spacing. The lack of transition for low tip speed ratio cases
 ${\it\lambda}=3$
and 3.5 suggests that the long-wave mode does not drive the helix transition: theory predicts that long wavelength is unconditionally unstable for a helical filament at all helical pitches. However, in the experimental setting, no noticeable growth rate is detected in the measurement domain and the helices resembling stable configurations similar to two-bladed propeller measurements by Felli et al. (Reference Felli, Camussi and Di Felice2011). This further supports the hypotheses that the mutual inductance mode drives the breakdown of the wake. It would be of interest to decouple the modes through controlled experiments to assess the receptivity of the system to both long-wave and mutual inductance perturbation modes.
Not investigated here is the nature of the perturbation of the helices. In Sherry et al. (Reference Sherry, Nemes, Lo Jacono, Blackburn and Sheridan2013), the experimental support geometry imposed the largest perturbation on the helices at a fixed spatial location. The perturbation sources and characteristics in the current experiments are not as clear. Ivanell et al. (Reference Ivanell, Mikkelsen, Sørensen and Henningson2010) hypothesised that the inflow turbulence intensity (
 $u^{\prime }/U_{\infty }\approx 1\,\%$
in these experiments) can be related to the perturbation amplitude and phase, proposing an exponential relationship between the onset of the instability and the turbulence intensity of the inflow. However, the results also show that the wake expansion introduces an asymmetry in the initial helix configuration that amplifies the perturbation, suggesting that rotor loading could play a significant role in the destabilisation of the system.
While this study has focused on growth rates driving transition to a far wake, the short-wave instabilities noted by Felli et al. (Reference Felli, Camussi and Di Felice2011) are expected to play a role in the evolution of the vortices and, hence, transition. This is especially relevant for configurations with sufficiently low temporal growth rates of the mutual inductance modes, where the development of the wake is not dominated by vortex interaction. Future experiments will investigate further the vortex dynamics prior to long-wave interactions and the evolution of the vortex core.
Acknowledgements
The authors would like to acknowledge the financial support of the Australian Research Council (ARC) through Discovery Project DP1096444 and the Centre National de la Recherche Scientifique (CNRS) through grant no. PICS161793 under the Projet International de Coopération Scientifique.