Introduction
Inbreeding occurs when mating of individuals that are more closely related than random individuals from a population (Falconer and Mackay, Reference Falconer and MacKay1996). Inbreeding causes a reduction in genetic variability which in return is the basis of inbreeding depression which affects fitness-related traits such as fertility when recessive alleles are deleterious (Falconer and Mackay, Reference Falconer and MacKay1996; Croquet et al., Reference Croquet, Mayeres, Gillon, Hammami, Soyeurt, Vanderick and Gengler2007; Panetto et al., Reference Panetto, Gutiérrez, Ferraz, Cunha and Golden2010). In addition, genetic variation will ensure a capacity for long-term response to selection pressures, either through artificial or natural selection (Frankham, Ballou and Briscoe, Reference Frankham, Ballou and Briscoe2002). Additionally, Vahlsten, Mäntysaari and Strandén (Reference Vahlsten, Mäntysaari and Strandén2004) emphasized the importance of monitoring the level and rate of inbreeding within a population across time. The reduction of genetic variability in beef cattle has been researched extensively (e.g. Cleveland et al., Reference Cleveland, Blackburn, Enns and Garrick2005; Santana et al., Reference Santana, Oliveira, Pedrosa, Eler, Groeneveld and Ferraz2010; Piccoli et al., Reference Piccoli, Braccini Neto, Brito, Campos, Bértoli, Campos, Cobuci, McManus, Barcellos and Gama2014). Further, there have been numerous genetic analyses based on pedigree information in livestock species including dairy cattle (Maiwashe et al., Reference Maiwashe, Nephawe, van der Westhuizen, Mostert and Theron2006; Mc Parland et al., Reference Mc Parland, Kearney, Rath and Berry2007), beef cattle (Gutiérrez et al., Reference Gutiérrez, Altarriba, Díaz, Quintanilla, Cañón and Piedrafita2003; Bouquet et al., Reference Bouquet, Venot, Laloë, Forabosco, Fogh, Pabiou, Moore, Eriksson, Renand and Phocas2011; Steyn et al., Reference Steyn, Neser, Hunlun and Lubout2012a, Reference Steyn, Neser, Hunlun and Lubout2012b), horses (Moureaux et al., Reference Moureaux, Verrier, Ricard and Mériaux1996; Vicente, Carolino and Gama, Reference Vicente, Carolino and Gama2012) and sheep (Huby et al., Reference Huby, Griffon, Moureaux, De Rochambeau, Danchin-Burge and Verrier2003; Maiwashe and Blackburn, Reference Maiwashe and Blackburn2004).
Relatively little work has been conducted to assess the degree of inbreeding in indigenous (Sanga) cattle of Southern Africa. These are breeds with unique characteristics and differ from the Bos taurus breeds. Meyer (Reference Meyer1984) concluded that Sanga type cattle, with specific reference to the Afrikaner, have distinct genetic markers inherited from both Bos indicus and B. taurus cattle. The species name, B. taurus africanus, was proposed to show that Southern African Sanga cattle such as the Afrikaner and Nguni are distinct from other African taurine cattle (Meyer, Reference Meyer1984; Frisch et al., Reference Frisch, Drinkwater, Harrison and Johnson1997). Furthermore, Sanga cattle is known for its hardiness, adaptability to extreme environmental conditions, heat tolerance, disease- and external parasite resistance (Scholtz, Reference Scholtz2010). The number of the Afrikaner cattle breed has decreased drastically over the past three decades from more than 27 000 seed stock females in 1980 (Bosman, Reference Bosman1994) to 6 000 in 2010 (Bergh and Havenga, Reference Bergh and Havenga2011), mainly due to the increased popularity of composite breeds. Similarly, the number of registered herds has decreased from 355 to 66.
One method to ensure the future existence of the Afrikaner breed is through the maintenance of genetic variability. Therefore, it was imperative that a pedigree analysis be conducted on the Afrikaner to ensure the sustainable conservation (through avoiding inbreeding between close relatives and sourcing of genetic material from commercial herds) of this indigenous South African breed. Genetic variation is important for the adaptive potential of a population and can be utilized when faced with extreme environmental changes such as global warming.
Quantitative genetics based on pedigree analysis is an alternative measurement to the use of molecular genetic markers to determine the level of genetic variability and inbreeding within a livestock breed. Thus, the aim of the current study was to use pedigree data from the Afrikaner cattle breed to examine the pedigree structure of the breed, to determine the levels of inbreeding, effective population size (N e), average relatedness (AR) and generation intervals. Parameters derived from the probability of gene origin, i.e. effective number of founders (f e) and effective number of ancestors (f a) were also investigated.
Materials and methods
Pedigree analysis was conducted using ENDOG v4.8 software (Gutiérrez and Goyache, Reference Gutiérrez and Goyache2005). A total of 244 718 individuals were used in this analysis, which included records from 1940 until 2011. Several analyses were carried out to determine the probability of gene origin, average coefficient of inbreeding, effective population size, AR coefficient and generation interval (Gutiérrez, Cervantes and Goyache, Reference Gutiérrez, Cervantes and Goyache2010).
Rates of inbreeding (F) were calculated using the regression of applicable values on the year of birth (Meuwissen and Lou, Reference Meuwissen and Lou1992). The individual increase in inbreeding (ΔF i ) was estimated using the individual inbreeding coefficient (F i ) as described by Gonzalez-Recio et al. (Reference González-Recio, López de Maturana and Gutiérrez2007) and modified by Gutiérrez, Cervantes and Goyache (Reference Gutiérrez, Cervantes and Goyache2009). Effective population size (N e) can be defined as the number of animals used for breeding which would lead to an increase in inbreeding if the contribution of all breeding animals were equal. The “realized effective size” was calculated according to Cervantes et al. (Reference Cervantes, Goyache, Molina, Valera and Gutiérrez2008). AR is the probability that an allele belongs to a specific animal when it was randomly selected from the total population within the pedigree. The interpretation of AR consequently is the depiction of animal in the whole of pedigree, irrespective of the information provided for its individual pedigree (Gutiérrez, Cervantes and Goyache, Reference Gutiérrez, Cervantes and Goyache2010). The generation interval was calculated as the average age of the parents at the birth of their offspring that replaced them (Falconer and MacKay, Reference Falconer and MacKay1996). The parameter f e can be defined as the number of contributing founders that would be expected to produce the same level of genetic diversity as the population under investigation. For a given number of founders, the more equal the genetic contribution of each founder, the greater the number of effective founders that will be identified. Boichard, Maignel and Verrier (Reference Boichard, Maignel and Verrier1997) defined f a as the minimum number of ancestors (including both founders and non-founders) which demonstrates the complete diversity of the population being studied. The information provided by f e is complemented by f a given that these parameters account for the losses of the genetic variation that was produced by the uneven number of reproductive animals which produced bottlenecks (Gutiérrez and Goyache, Reference Gutiérrez and Goyache2005). This parameter, pedigree completeness, indicates the degree of depth of the pedigree. It was measured in complete generation equivalents (CGE). CGE can be defined as the degree of pedigree information of an animal. Three traced generations are computed by ENDOG for each animal in the pedigree: (i) fully traced generations – defined as the individuals separating the progeny of the furthest generation, which is where the second generation of ancestors of the specific individual are identified. Generation 0 are the founders of the population, which are the ancestors whose parents are both unknown; (ii) maximum amount of generations traced – defined as the amount of generations which separate the individual from its outermost ancestor; (iii) equivalent complete generations – estimates the pedigree of each individual as the sum over all known ancestors of the terms (1/2) n . The amount of generations which separates the individual from each identified ancestor is represented by n (Maignel, Boichard and Verrier, Reference Maignel, Boichard and Verrier1996; Boichard et al., Reference Boichard, Maignel and Verrier1997).
Results
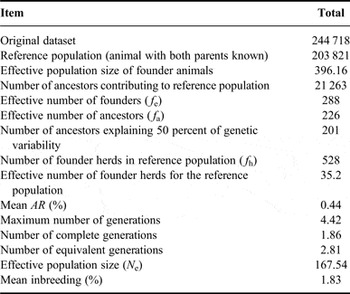
Parameters characterizing the genetic variability of the Afrikaner breed are presented in Table 1. The original dataset contained 244 718 animals. The reference population, where both parents are known for an animal, contained 203 821 animals. The effective population size of the founder animals was 396.16 animals.
Parameters characterizing the probability of gene origin in the Afrikaner cattle breed.

The effective numbers of founders (f e) and ancestors (f a) were 288 and 226, respectively. The fact that a gap that exists between f e (288) and f a (226) implies the existence of a bottleneck. Furthermore, when the ratio between f e and f a (f e/f a) is 1.27. The ideal ratio should be one. The larger the ratio, the more severe the effect of the bottleneck is (Boichard et al., Reference Boichard, Maignel and Verrier1997; Mokhtari et al., Reference Mokhtari, Moradi Shahrbabak, Esmailizadeh, Abdollahi-Arpanahi and Gutierrez2013). The results from the current study thus do indicate a bottleneck, but the bottleneck was not large enough to have a big effect on the Afrikaner population. The fact that the value of N e for the current study is still 167.54, also indicates that the effect of the bottleneck was not severe. The effective population size (N e) was also calculated via two other methods using the ENDOG software, namely complete generations and equivalent generations and values of 61.67 and 87.48 were obtained. Although the latter two N e's are smaller, they are still within the acceptable limits as indicated in the discussion below.
A total of 21 263 ancestors were recorded which contributed to the reference population. A total of 201 ancestors explained 50 percent of the genetic variability of the reference group. The mean inbreeding value was calculated as 1.83 percent with an AR of 0.44.
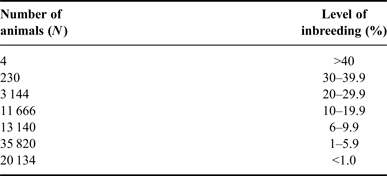
The number of animals at each level of inbreeding was calculated (Table 2). There are only four animals which are more than 40 percent inbred. A total of 84 138 animals were inbred to some degree, implying that 160 576 animals showed no levels of inbreeding. Matings between the close relatives were also observed in the study where a total of 67 matings between full sibs (brother and sister) were recorded, which presents 0.03 percent of the population under study. Furthermore, mating between half sibs (half-brother and sister or brother and half-sister) was recorded in a total of 8 607 cases, which amounts to 3.52 percent. Finally, mating between parent and offspring (mother and son or father and daughter) was recorded in 1.17 percent of the records within the dataset, accounting for 2 856 animals.
Levels of inbreeding in the Afrikaner breed.

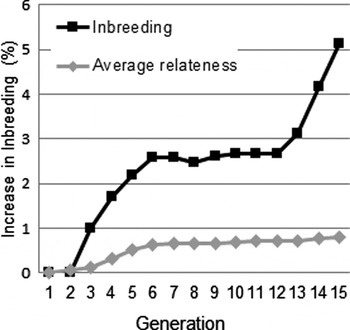
The increase in inbreeding and the AR per generation are illustrated in Figure 1. A maximum of 14 generations was detected. Generations 0–2 showed no levels of inbreeding. From generations 2 to 6, there was a steady increase in inbreeding of ±1 percentage unit per generation. Until generation 12, inbreeding levels were constant with minimal to no increase of inbreeding for the six generations. From generations 12 to 14, a sharp increase in inbreeding was observed. One explanation for this may be the drastic decrease in the number animals and herds. AR per generation followed a similar trend compared with the levels of inbreeding. Generations 0–3 displayed a minimum to no increase in relatedness. From generations 3 to 6, a gradual increase was observed. From there on, a constant relatedness level was observed with a slight increase from generations 13 to 14.
Increase in inbreeding and AR for each generation.

The most recent ancestral generation, calculated from all the animals in the dataset, were 87 percent complete. The second ancestral generations for dam and sire lines were on average 69.9 and 73.9 percent complete, respectively. For the third generation, the pedigree completeness decreased to the lowest percentage, at 48.4 percent.
The average generation interval for the whole population was calculated as 6.6 ± 3.9 years. Furthermore, the generation interval estimated for the four different gametic pathways was as follows: dam to son: 6.712 ± 3.653 years; dam to daughter: 6.615 ± 3.514 years; sire to son: 6.507 ± 4.704 years and sire to daughter: 6.489 ± 4.146 years.
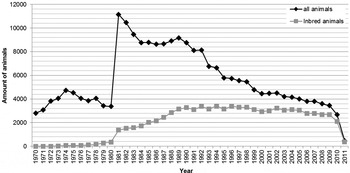
The numbers of animals used to calculate the level of inbreeding per year for the whole pedigree data and inbred animals are presented in Figure 2. In 1981, there was a sharp increase in the number of animals used in the analysis for both inbred animals and all pedigree data used. The reason for this sharp rise in the number of animals was driven by the society to register more animals.
Number of animals used to calculate the level of inbreeding per year for the whole pedigree data and inbred animals.

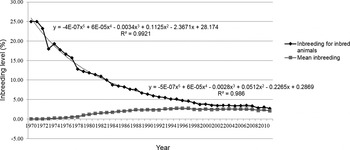
The mean inbreeding level per year for the whole pedigree data and the mean inbreeding level per year for inbred animals are presented in Figure 3. The proportion of animals that were inbred in 1970 was very low; therefore their average inbreeding level was high. The opposite happened in 2011, where a larger proportion of animals were inbred, translating into a lower level of inbreeding. From 1970 to 1979, the inbreeding level for all animals showed an increase of 0.94 percent; onwards from 1980 until 2011 all inbreeding levels were above 1 percent. A stable increase in inbreeding levels was visible from 1978 to 1988 and from there on constant levels followed. The year with the highest inbreeding level was 1996, with an average of 2.79 percent. Along with the number of inbred animals increasing, the number of generations of inbred animals also increased; therefore, the level of inbreeding effectively decreased over time. Consequently, the level of inbreeding for the inbred animals showed a constant decrease as the number of generations used in analysis increased.
Mean inbreeding level per year for whole pedigree data and mean inbreeding level per year for inbred animals

Discussion
When the entire dataset was considered, a total of 34.4 percent of animals were, to some degree, inbred. The average inbreeding coefficient for the whole population was 1.83 percent. The value of N e for the current study is 167.54. The observed high N e of the Afrikaner may be the result of a project involving introgression of Bonsmara genes into the Afrikaner breed by a number of breeders to improve its performance. Following the introgression, line breeding was implemented to a certain degree. This project allowed the AR to also stay constant over generations since line breeding was used to breed pure Afrikaner animals, but however caused an increase in inbreeding since a smaller number of pure Afrikaner animals were available. This estimate N e of the Afrikaner is similar to that of the Nguni cattle that was estimated to be 168 (Matjuda, Reference Matjuda2012). The N e reported here is greater than the minimum of 50–100 recommended by the FAO (1998) and within the 25–255 range of effective population size that was suggested as being critical for maintaining fitness by Meuwissen and Woolliams (Reference Meuwissen and Woolliams1994). The N e estimate of the Afrikaner was large when compared with some international breeds. Mc Parland et al. (Reference Mc Parland, Kearney, Rath and Berry2007) estimated N e sizes of 64, 127 and 75 for Irish Herefords-, Simmental- and Holstein–Friesian breeds, respectively, whereas that of Italian beef cattle breeds were in the range from 122 to 138 (Bozzi et al., Reference Bozzi, Franci, Forabosco, Pugliese, Crovetti and Filippini2006). Estimates of N e for Danish dairy cattle populations ranged from 49 to 157 (Sørensen, Sørensen and Berg, Reference Sørensen, Sørensen and Berg2004). Pedigree analysis on the Afrikaner cattle population yielded levels of inbreeding that appear to be at acceptable and manageable levels, especially when compared with international breeds such as the Holstein–Friesian.
The comparatively low levels of inbreeding observed in Afrikaner cattle could be due to random mating processes or outcrossing that were induced within the herds. The introgression project may have contributed to keep inbreeding in the Afrikaner population at low levels. As an additional consequence, the relatedness between the animals decreased. The Afrikaner cattle population in study has an acceptable level for the estimated effective population size. The low inbreeding levels confirm the relatively high effective population size. The implication of a high effective population size is that more animals are available for the selection, whereas inbreeding can be contained.
Conclusions
Pedigree analysis on the Afrikaner cattle population yielded levels of inbreeding that appear to be at acceptable and manageable levels. The inbreeding of the Afrikaner breed has been low even though the number of animals has decreased due to the popularity of exotic and composite breeds found in South Africa. The current study provided useful results than can be utilized by farmers and the Afrikaner Breeders’ Society. The results of this study indicate that there is sufficient variation within the Afrikaner breed of cattle that will allow it to expand into the diverse markets that exist both within and beyond the boundaries of South Africa, especially in the era of climate change. The results also indicate that the breed is in a favourable position to continue countering the undesirable effects of inbreeding.
Acknowledgements
The authors thank the Staff at University of the Free State and Afrikaner Cattle Breeders’ Society of South Africa for providing support and necessary documentation. The financial support of the Department of Agriculture Forestry and Fisheries (DAFF) and National Research Foundation (NRF) is acknowledged.