I. INTRODUCTION
Dislocation nucleation is essential to the understanding of ductility and plastic deformation of crystalline materials with submicrometer dimensionsReference Li, Wei, Lu, Lu and Gao1–Reference Zhu, Li, Ogata and Yip3 or under nanoindentation.Reference Li, Van Vliet, Zhu, Yip and Suresh4–Reference Schall, Cohen, Weitz and Spaepen6 It is and also essential to the synthesis of high quality thin films for microelectronic, optical, and magnetic applications.Reference Nix, Greer, Feng and Lilleodden7, Reference Izumi, Ohta, Takahashi, Suzuki and Saka8 The fundamental quantity of interest is the dislocation nucleation rate I as a function of stress σ and temperature T. ContinuumReference Xu, Argon and Ortiz9–Reference Aubry, Kang, Ryu and Cai11 and atomistic modelsReference Tschopp, Spearot and McDowell12–Reference Zhu, Li, Samanta, Leach and Gall14 have been used to predict the dislocation nucleation rate, and they both have limitations. The applicability of continuum models may be questionable because the size of the critical dislocation nucleus can be as small as a few lattice spacings. In addition, the continuum models are often based on linear elasticity theory, whereas dislocation nucleation typically occurs at high strain conditions in which the stress–strain relation becomes nonlinear. These difficulties do not arise in molecular dynamics (MD) simulations, which can reveal important mechanistic details of dislocation nucleation. Unfortunately, the time step of MD simulations is on the order of a femtosecond, so that the time scale of MD simulations is typically on the order of a nanosecond, given existing computational resources. Therefore, the study of dislocation nucleation via direct MD simulation has been limited to extremely high strain rate (∼108 s−1) conditions.Reference Tschopp, Spearot and McDowell12, Reference Bringa, Rosolankova, Rudd, Remington, Wark, Duchaineau, Kalantar, Hawreliak and Belak13 This is about 10 orders of magnitudes higher than the strain rate in most experimental work and engineering applications.Reference Schuh, Mason and Lund5, Reference Schall, Cohen, Weitz and Spaepen6 Predicting the dislocation nucleation rate I(σ, T) under the experimentally relevant conditions is still a major challenge.
An alternative approach is to combine reaction rate theoriesReference Hanggi, Talkner and Borkovec15–Reference Eyring17 with atomistic models. Atomistic simulations can be used to compute the activation barrier, which is used as an input for the reaction rate theory to predict the dislocation nucleation rate. There are several reaction rate theories, such as the transition state theory (TST) Reference Hanggi, Talkner and Borkovec15, Reference Vineyard18 and the Becker–Döring (BD) theory,Reference Becker and Döring16 which lead to similar expressions for the nucleation rate,

where N s is the number of equivalent nucleation sites, v 0 is a frequency prefactor, Gc is the activation Gibbs free energy for dislocation nucleation, and k B is the Boltzmann constant. The difference between the theories lies in the expression of the frequency prefactor v 0. In practice, v 0 is often approximated by the Debye frequency v D of the crystal, which is typically on the order of 1013s−1. One could also express the dislocation nucleation rate as a function of strain γ and temperature T. Then,

where Fc is the activation Helmholtz free energy for dislocation nucleation.
The TSTReference Hanggi, Talkner and Borkovec15, Reference Vineyard18 has often been combined with the nudged elastic band (NEB) methodReference Jónsson, Mills, Jacobsen, Berne, Ciccotti and Coker19 to predict the rate of rare events in solids.Reference Zhu, Li, Samanta, Leach and Gall14, Reference Voter20, Reference Jin, Ren and Xiang21 However, several limitations exist for this approach. TST is known to overestimate the rate because it does not consider that a single reaction trajectory may cross the saddle region multiple times. This deficiency can be corrected by introducing a recrossing factor that can be computed by running many MD simulations starting from the saddle region.Reference Chandler22 A more serious problem is that the NEB method, and the closely related string method,Reference Ren and Vanden-Eijnden23 only determine the activation barrier at zero temperature, that is, Gc(σ,T = 0) or Fc(γ,T = 0). In principle, the activation barrier at finite temperature can be obtained from the finite temperature string method,Reference Ren and Vanden-Eijnden24 which has not yet been applied to dislocation nucleation. Both Gc and Fc are expected to decrease with T, as characterized by the activation entropy Sc. The effect of the activation entropy is to introduce an overall multiplicative factor of exp(Sc/k B) to the nucleation rate [see Eq. (13)], which can be very large if Sc exceeds 10k B. Until recently, the magnitude of Sc has not been determined reliably and, within the harmonic approximation of TST, Sc is estimated to be small (i.e., ∼3k B). For example, the activation entropy of kink migration on a 30° partial dislocation in Si has recently been estimated to be less than 3k B.Reference Jin, Ren and Xiang21
We recently developed an approachReference Ryu, Kang and Cai25 to accurately predict the rate I(σ, T) of homogeneous and heterogeneous dislocation nucleation over a wide range of σ and T, based on the BD theoryReference Becker and Döring16 and the umbrella sampling method.Reference Frenkel and Smit26 The BD theory correctly accounts for the recrossing effect, and the umbrella sampling method directly computes the activation Helmholtz free energy Fc at finite temperature. The activation Gibbs free energy Gc(σ,T) is set to the value of Fc(γ,T) at the strain γ that corresponds to the stress σ at temperature T. The activation entropy Sc is obtained from the reduction of Gc and Fc with temperature and is found to be very large (e.g., exceeding 9k B for γ < 9%)). Furthermore, two different activation entropies are found, depending on whether the stress or the strain is held constant when the temperature is raised. Hence, the activation entropy depends on the choice of the (constant stress or constant strain) ensemble, contrary to entropy itself, which is independent of the choice of ensemble. These effects are explained in terms of thermal expansion and thermal softening; both are anharmonic effects in the crystal.
In this paper, we provide a more thorough discussion on the thermodynamics of dislocation nucleation and algorithms underlying our approach. The thermodynamic properties of activation, such as the activation free energy, activation entropy, and activation volume have been extensively discussed in the context of dislocation overcoming obstacles, using continuum theory within the constant stress ensemble.Reference Kocks, Argon and Ashby27 There has recently been interest in computing these quantities using atomistic simulations, in which it is more convenient to use the constant strain ensemble. One of the main objectives of this paper is to discuss the difference between the thermodynamic properties of activation defined in the constant stress and the constant strain ensembles in the context of dislocation nucleation. First, we prove that the activation Gibbs free energy Gc(σ,T) equals the activation Helmholtz free energy Fc(γ,T) for dislocation nucleation when the volume of the crystal is much larger than the activation volume of dislocation nucleation. This leads to the intuitive conclusion that the dislocation nucleation rate is independent of whether the crystal is subjected to a constant stress or a constant strain loading condition. The equality of Fc(γ,T) and Gc(σ,T) quickly leads to the difference of the two activation entropies, but we provide an alternative derivation of it, which makes the physical origin of this difference more transparent. Our goal is to clarify why the activation entropy depends on the choice of ensemble whereas entropy itself does not. Second, we describe the computational methods in sufficient detail so that they can be repeated by interested readers and be adopted in their research. We repeat our calculations using an improved order parameter to characterize dislocation nucleation and find that our previous resultsReference Ryu, Kang and Cai25 are independent of the choice of order parameters, as required for self-consistency. Third, we compare our numerical results with several previous estimates of the activation entropy, such as those based on the “thermodynamic compensation law,” which states that the activation entropy is proportional to the activation enthalpy. We discuss the conditions at which this empirical law appears to hold (or fail) for dislocation nucleation.
The paper is organized as follows. Section II is devoted to the thermodynamics of dislocation nucleation. Simulation setup and computational methods are described in Section III. Section IV presents the numerical data on the activation free energy and the frequency prefactor over a wide range of stress (strain) and temperature conditions. Section V compares these results with previous estimates of the activation entropy and discusses the consequence of the activation entropy on experimentally measurable quantities, such as yield stress. This is followed by a short summary in Section VI.
II. THERMODYNAMICS OF NUCLEATION
A. Activation free energies
Consider a crystal of volume V subjected to stress σ at temperature T. To be specific, we can consider σ as one of the stress components, for example, σxy , while all other stress components are zero. Let G(n,σ,T) be the Gibbs free energy of the crystal when it contains a dislocation loop that encloses n atoms. If n is very small, the dislocation loop is more likely to shrink than to expand. In contrast, if n is very large, the dislocation loop is more likely to expand than to shrink. There exists a critical loop size n c, at which the likelihood for the loop to expand equals the likelihood to shrink. It is also the loop size that maximizes the function G(n,σ,T) for fixed σ and T. The activation Gibbs free energy is defined as

where G(0,σ,T) is the Gibbs free energy of the perfect crystal (containing no dislocations) at stress σ and temperature T. Given Gc(σ,T), the dislocation nucleation rate can be predicted using Eq. (1).
Experimental data are usually expressed in terms of σ and T, but it is often more convenient to control strain than stress in atomistic simulations. Let γ be the strain component that corresponds to the nonzero stress component, for example, γxy. Although there is only one nonzero stress component, this usually corresponds to multiple nonzero strain components. Nonetheless, the other strain components do not appear in our discussion because their corresponding work term is zero. ThermodynamicsReference Nye28 allows us to discuss the nucleation process within the constant γ constant T ensemble by introducing the Helmholtz free energy F(n, γ, T) through the Legendre transform.


To be more precise, σ is the Cauchy stress and γV is the conjugate variable to σ. We choose V to be the volume of a reference state, i.e., the state at σ = 0. Then γ is the logarithmic (or Hencky) strain relative to the reference state.Reference Xiao, Bruhns and Meyers29 Here, we are interested in the regime of 0 ≤ γ ≤ 20%, and the difference between the Hencky strain and the simple engineering strain is negligible. Hence, in the numerical test case, we are going to let γ be the engineering strain. A convenient property of the Legendre transform is that it is reversible, that is,


Again, let n c be the dislocation loop size that maximizesF(n, γ, T) for given γ and T. In Appendix A, we prove that the same n c maximizes G(n,σ,T) and F(n,γ,T), so that the critical dislocation loop size does not depend on the choice of the (constant stress or constant strain) ensemble. The activation Helmholtz free energy is defined as

Given Fc(γ,T), the dislocation nucleation rate can be predicted using Eq. (2).
B. Activation entropies
The activation Gibbs free energy Gc(σ,T) decreases with increasing temperature T at fixed σ and decreases with increasing σ at fixed T. The activation entropy, defined asReference Kocks, Argon and Ashby27

measures the reduction rate of Gc(σ, T) with increasing T. Similarly, the activation volume, defined as

measures the reduction rate of Gc(σ, T) with increasing σ.
The activation enthalpy Hc is defined as

The activation entropy Sc is usually insensitive to temperature, especially in the range of zero to room temperature, which will be confirmed by our numerical results. This means that Hc is also insensitive to temperature and that the Gibbs free energy can be approximated by

Consequently, the dislocation nucleation rate in Eq. (1) can be rewritten as

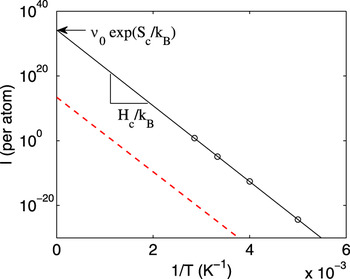
Therefore, when the dislocation nucleation rate per site I/N s at a constant stress σ are shown in the Arrhenius plot (e.g., Fig. 1), the data are expected to follow a straight line. The negative slope of the line can be identified as the activation enthalpy Hc(σ) over k B, and the intersection of the line with the vertical axis is v 0 exp(Sc(σ)/k B). Hence, the activation entropy Sc contributes an overall multiplicative factor exp(Sc(σ)/k B) to the nucleation rate. If Sc = 3k B, this factor is about 20 and may be considered insignificant. However, if Sc > 10k B, this factor exceeds 104 and cannot be ignored.
Homogeneous dislocation nucleation rate per lattice site in Cu under pure shear stress σ = 2.0 GPa on the (111) plane along the  direction as a function of T −1, predicted by Becker–Döring theory using the free energy barrier computed from umbrella sampling (see Section III). The solid line is a fit to the predicted data (circles). The slope of the line is Hc/k B, and the intersection point of the extrapolated line with the vertical axis is v 0exp(Sc/k B) The dashed line presents the nucleation rate predicted by v 0exp(−Hc/k BT), in which the activation entropy is completely ignored, leading to an underestimate of the nucleation rate by ∼20 orders of magnitude. (color online)

If we choose the constant strain γ ensemble, then the focus is on the activation Helmholtz free energy Fc(γ,T), which decreases with increasing temperature T at fixed γ. An alternative definition of the activation entropy can be given as

which measures the reduction rate of Fc(γ, T) with increasing T. We can then define the activation energy Ec(γ, T) as

Again, since the activation entropy Sc is usually insensitive to temperature, we can use the following approximation for the activation Helmholtz free energy:

Consequently, the dislocation nucleation rate in Eq. (2) can be rewritten as

Therefore, Fc(γ) and Sc(γ) can also be identified from the slope and y intersection in an Arrhenius plot of the dislocation nucleation rate at a constant strain γ.
Apparently, the above discussions in the constant σ ensemble and those in the constant γ ensemble closely resemble each other. It may seem quite natural to expect the two definitions of the activation entropies, Sc(σ) and Sc(γ), to be the same, as long as σ and γ lie on the stress–strain curve of the crystal at temperature T. After all, the entropy of a crystal is a thermodynamic state variable, which is independent of whether the constant stress or constant strain ensemble is used to describe it, and we may expect the activation entropy to enjoy the same property too. It is surprising that Sc(σ) and Sc(γ) are not equivalent. For dislocation nucleation in a crystal, we can show that Sc (σ) is almost always larger than Sc(γ), and the difference between the two can be very large, for example, 30 k B for σ < 2 GPa. The large difference between the two activation entropies has not been noticed before. We will present both theoretical proofs and numerical data on this difference in subsequent sections.
For both theories and experiments, the focus has been made mainly on the activation enthalpy while the prefactor also contains rich physics and is important for the prediction of nucleation rate. It is the same for the atomistic simulations, so that calculation of the activation enthalpy is well established. The activation enthalpy Hc (or the activation energy Ec) can be obtained by the conventional zero-temperature chain-of-states methods such as NEBReference Jónsson, Mills, Jacobsen, Berne, Ciccotti and Coker19 and string methodsReference Ryu and Cai58 with a relatively small computational cost. However, to predict the nucleation rate from Eqs. (LABEL:eq:cnt) and (LABEL:eq:cnt2), we still need to determine the activation entropy Sc(σ) (or Sc(γ)), which is beyond the reach of zero-temperature methods. Because of the difficulties in computing the activation free energy directly at finite temperature, the contribution of Sc has been either ignored in rate estimates in solids, or approximated in an empirical form, as follows.
C. Difference between the two activation entropies
The Gibbs free energy G(n,σ,T) and the Helmholtz free energy F(n,γ,T) are Legendre transforms of each other, but the activation Gibbs free energy Gc(σ,T) and the activation Helmholtz free energy Fc(γ,T) are not Legendre transforms of each other. It is proven in Appendix B that Gc(σ,T) and Fc(γ,T) are equal, in the limit of V ≫ Ωc, as long as σ and γ lie on the stress–strain curve of the perfect crystal at temperature T, that is, σ = (1/V)∂F(0, γ, T)/∂γ. This has the important consequence that the dislocation nucleation rates predicted by Eq. (1) and that by Eq. (2) are equal. This result is intuitive because the dislocation nucleation rate should not depend on whether the crystal is subjected to a constant stress or to a constant strain that corresponds to the same stress. The thermodynamic properties of a macroscopic crystal can be equivalently specified either by its stress and temperature or by its strain and temperature, and we expect the same to hold for kinetic properties (e.g., dislocation nucleation rate) of the crystal.
It then follows that the activation entropies Sc(σ,T)defined in Eq. (9) and Sc(γ,T) defined in Eq. (14) cannot equal each other. In the following, we will let σ and γ follow the stress–strain curve, σ(γ, T), of the perfect crystal at temperature T. Using the equality Gc(σ, T) = Fc(γ,T), we have


Similarly, starting from the definition of Sc(γ, T), we can show that

Equations (19) and (20) are consistent with each other because of the Maxwell relation,

and the chain rule of differentiation,

Therefore, the difference between the two activation entropies is

Recalling the definition of activation volume Ωc in Eq. (10), we have

Note that Ωc is always positive and that, because of thermal softening, (∂σ/∂T)|γ is usually negativeReference Zhu, Li, Ogata and Yip3. Here we are excluding the effect of thermal expansion by always defining the strain relative to the zero stress state at temperature T. Even though most crystals exhibit thermal softening, exceptions do exist. For example C 66 of α-quartz decreases with temperature.Reference Bechmann, Ballato and Lukaszek30 Therefore, ΔSc is positive for dislocation nucleation in a crystal under most conditions.
The differences between the two activation entropies have not been widely discussed, but pointed out by Whalley in the context of chemical reactions.Reference Whalley and Gold31, Reference Tonnet and Whalley32 However, ΔSc has been estimated to be rather small in chemical reactions. The main reason is that the activation volume for most chemical reactions is bounded. As a rough estimate, let us assume that Ωc < 100 Å3. Under low stress conditions, we expect (∂σ/∂T)|γ to be linear with stress, that is,

where μ is the shear modulus. Although for chemical reactions it is more appropriate to use the bulk modulus instead of μ, this approximation is acceptable for a rough estimate. Let us assume that μ reduces by 10% as T increases from 0 to 300 K,Reference Overton and Gaffney33 then (−1/μ)(∂μ/∂T)|γ is approximately 3.3 × 10⁻⁴ K−1. If we further assume that σ < 100 MPa, then ΔSc < 0.25 k B, which is negligible.
The situation is quite different for dislocation nucleation, where the activation volume Ωc diverges as σ goes to zero. The activation volume is proportional to the size n c of the critical dislocation loop (see Appendix F). Based on a simple line tension model, it is estimated to be Ωc ∝ σ −2 in the limit of σ → 0. We can use the line tension model to give a rough estimate of the formation energy of a circular dislocation loop of radius r, i.e., E loop = 2πrτ − b πr 2σ, where τ is the dislocation line energy per unit length and b is the magnitude of Burgers vector. Maximizing E loop with respect to r gives the energy barrier Ec = (πτ 2/bσ) at the critical radius rc = (τ/bσ). The activation volume is  , which diverges in the limit of σ → 0. Combining this with Eq. (25), we have

which diverges as σ goes to zero. In the relevant stress range, for example, from 0 to 2 GPa, ΔSc is found to be very large, easily exceeding 9 k B for both homogeneous and heterogeneous dislocation nucleation, as shown in subsequent sections. The divergence of the activation volume and activation entropy in the zero stress limit is a unique property of dislocation nucleation, which distinguishes itself from other thermally activated processes such as dislocation overcoming an obstacle.Reference Cahn and Nabarro34, Reference Cottrell35
The expression for the difference between the two activation entropies [Eq. (24)] follows mathematically from the equality of Gc and Fc and the chain rule of differentiation, but one may still wonder whether an alternative (perhaps more physical) explanation exists. After all, the entropy of the crystal is a property of the thermodynamic state and is independent of the choice of ensembles. The activation entropy can be expressed as the difference of the entropies between the “activated” state and the “initial” (i.e., metastable) state. It may seem puzzling that the activation entropy does not share some of the fundamental properties of entropy itself. This question is discussed in detail in Appendix C. The answer is that, in the definitions of Sc(σ) and Sc(γ), we are not taking the entropy difference between the same two states. If we choose the same initial state, then two different activated states are chosen, depending on whether the stress or strain is kept constant during dislocation nucleation. This is because the act of forming a critical dislocation loop introduces plastic strain into the crystal. Following this analysis, we are led to exactly the same expression for ΔSc ≡ Sc(σ) − Sc(γ) as Eq. (24).
A similar expression has been obtained for the difference between the point defect formation entropies under constant pressure (S p) and under constant volume (S v).Reference Mishin, Sorensen and Voter36 This difference is proportional to the relaxation volume of the defect and is negative for a vacancy and positive for an interstitial. More discussion is provided in Appendix C.
D. Previous estimates of activation entropy
Several theoretical approaches exist that could be used to estimate the activation entropy of dislocation nucleation. We note that none of these approaches address that there are actually two different activation entropies and, as such, they can be equally applied to Sc(σ) and to Sc(γ) and lead to similar estimates. In this sense, all of these approaches will lead to inconsistencies when applied to dislocation nucleation.
An approach that is widely used in the solid state is the harmonic approximation of the TST,Reference Hanggi, Talkner and Borkovec15 in which the activation entropy is attributed to the vibrational degrees of freedom. In TST, the frequency prefactor is v 0 = k BT/h, where h is the Planck constant. At T = 300 K, v 0 = 6.25 × 10¹² s−1. Expanding the energy landscape around the initial state (i.e., perfect crystal, or the metastable state) and the activated state (i.e., the crystal containing the critical dislocation nucleus) up to second order, we get

where v i m and v i a are the positive normal frequencies in the metastable state and the activated state, respectively,Reference Hanggi, Talkner and Borkovec15, Reference Vineyard18, Reference Gupta37 and N is the number of normal modes in the metastable state. Note that the activated state contains one fewer normal frequency than the metastable state. A further (rather crude) approximation is often invoked, in which it is assumed that the normal frequencies in the activated state are not significantly changed from those in the metastable state and approximate the entire expression in Eq. (27) by the Debye frequency v D of the perfect crystal. The Debye frequencyReference Kittel38 is typically the highest vibrational frequency in a crystal and is on the order of 1013 s−1. Recall that v 0 itself is also on the order of 1013 s−1 at room temperature. This leads to the conclusion that exp(S c/k B) would not deviate from 1 by more than one order of magnitude. This is perhaps one of the reasons for the entropic effects to be largely ignored so far for dislocation nucleation processes. In subsequent sections we will show that the activation entropies are large for dislocation nucleation and they originate from anharmonic effects. This is consistent with the above estimate that the vibrational entropy, captured by the harmonic approximation, makes a negligible contribution to the activation entropy for dislocation nucleation in metals.
Alternatively, one can estimate the activation entropy by postulating that the activation Gibbs free energy scales with the shear modulus μ of the crystal. Because μ decreases with temperature because of the thermal softening effect, so does Gc(σ,T), leading to an activation entropy.Reference Kocks, Argon and Ashby27, Reference Argon, Andrews, Godrick and Whitney39 This approximation can be expressed more explicitly as

where μ(T) and μ(0) are the shear moduli of the crystal at temperature T and zero temperature, respectively. Assuming that μ(T) is a linear function of T, we arrive at the following estimate for Sc(σ):

A similar expression has been derived for dislocations overcoming obstacles.Reference DiMelfi, Nix, Barnett, Holbrook and Pound40, Reference DiMelfi, Nix, Barnett and Pound41 Note that (1/μ(0))(∂μ/∂T) is a material constant that measures the severity of the thermal softening effect. For convenience, we can define a characteristic temperature T * such that

Then we arrive at the following estimate of Sc(σ):

Again, if we assume μ reduces by about 10% as T increases from 0 to 300 K, then T * ≈ 3000 K. This means Sc(σ) ≈ 7.5 k B when Hc(σ) = 2 eV.
Although the above analysis seems quite reasonable, the same argument can be applied to the activation Helmholtz free energy, leading to the following approximations:


with the same T * as defined in Eq. (30). Again, assuming T * ≈ 3000 K, we have Sc(γ) ≈ 7.5 k B when Ec(γ) = 2 eV. Given the large difference between Sc(σ) and Sc(γ), both of the above two estimates cannot be correct. In Section IV we will see that this estimate is closer to Sc(γ) than Sc(σ) for homogeneous dislocation nucleation in Cu.
Zhu et al.Reference Zhu, Li, Samanta, Leach and Gall14 recently introduced the following approximation to the activation Gibbs free energy for dislocation nucleation from the surface of a Cu nanorod:

where T m is the surface melting temperature of the nanorod and is chosen to be 700 K. This approximation was based on the so-called thermodynamic compensation law,Reference Kemeny and Rosenberg42 or the Meyer–Neldel rule,Reference Yelon, Movagha and Branz43 which is an empirical observation that in many thermally activated processes, Sc is proportional to Hc . It is interesting that such an approximation leads to an expression for the activation entropy Sc(σ) that is identical to Eq. (31) provided that T * = T m. This amounts to assuming that the shear modulus decreases at a constant rate with temperature and vanishes at melting temperature, as in Born’s theory of melting.Reference Born44
Again, while this approximation seems reasonable, the same argument can be applied to the activation Helmholtz free energy,

which has been used by Brochard et al.Reference Brochard, Hirel, Pizzagalli and Godet45 This would lead to an expression for the activation entropy Sc(γ) that is identical to Eq. (33) provided that T * = T m. Clearly, both of these two approximations [Eqs. (34)–(35)] cannot be correct, at least for the same T m.
III. COMPUTATIONAL METHODS
A. Simulation cell
We study both the homogeneous nucleation of dislocation in bulk Cu and the heterogeneous nucleation in a Cu nanorod. Although dislocations often nucleate heterogeneously at surfaces or internal interfaces, homogeneous nucleation is believed to occur in nanoindentationReference Li, Van Vliet, Zhu, Yip and Suresh4 and in a model of brittle–ductile transition.Reference Khantha, Pope and Vitek46 It also provides an upper bound to the shear strength of the crystal. For simplicity, we benchmark the computational method against brute force MD simulation and spend most of the discussions on homogeneous nucleation. Heterogeneous nucleation will be discussed following the homogeneous nucleation analysis.
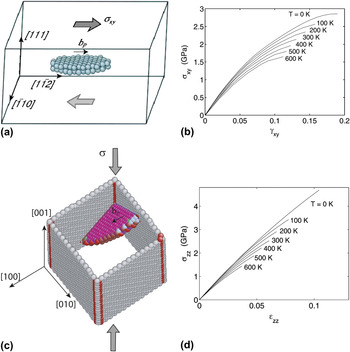
Our model system is a Cu single crystal described by the embedded atom method potential.Reference Mishin, Mehl, Papaconstantopoulos, Voter and Kress47 As shown in Fig. 2(a), the simulation cell to study homogeneous dislocation is subjected to a pure shear stress along  . The dislocation to be nucleated lies on the (111) plane and has the Burgers vector of a Shockley partial,Reference Hirth and Lothe48
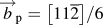 . The cell has dimensions of eight repeat distances along the
 direction, six repeat distances along the [111], and three repeat distances along the
 , and consists of 14,976 atoms. Periodic boundary conditions are applied to all three directions. To reduce artifacts from periodic image interactions, the applied stress is always large enough so that the diameter of the critical dislocation loop is smaller than half the width of the simulation cell.
Schematics of simulation cells designed for studying (a) homogeneous and (c) heterogeneous nucleation. (a) The spheres represent atoms enclosed by the critical nucleus of a Shockley partial dislocation loop. (c) Atoms on the surface are gray and atoms enclosed by the dislocation loop are magenta. Shear stress–strain curves of the Cu perfect crystal (before dislocation nucleation) at different temperatures for (b) homogeneous and (d) heterogeneous nucleation simulation cells. (color online)

Figure 2(b) shows the shear stress–strain relationship of the perfect crystal at different temperatures (before dislocation nucleation) that clearly shows the thermal softening effect. The shear strain γ is the xy component of the engineering strain. The following procedure is used to obtain the pure shear stress–strain curve, because the conventional Parrinello–Raman stress control algorithmReference Parrinello and Rahman49 does not work properly here because of the nonlinear stress–strain relationship at large strain. At each temperature T and shear strain γxy, a series of 2–ps MD simulations under the canonical, constant temperature–constant volume (NVT) ensemble are performed. After each simulation, all strain components except γxy are adjusted according to the average Virial stress until σxy is the only nonzero stress component. The shear strain is then increased by 0.01 and the process repeats until the crystal collapses spontaneously.
For heterogeneous dislocation nucleation, we studied a Cu nanorod that has the dimension of 15[100] × 15[010] × 20[001] with periodic boundary conditions along [001], which is shown in Fig. 2(c). When subjected to axial compression along [001], a dislocation with the Burgers vector  is expected to nucleate from the corner of the nanorod. The compressive stress–strain curve is shown in Fig. 2(d). An important step in obtaining the stress–strain curve is to achieve thermal equilibrium before taking the average of stress σzz and computing the nucleation rate at a given strain ɛzz. Due to the free side surfaces, a nanorod undergoes low frequency but long-lived oscillations in the x and y directions (i.e., “breathing” mode) at the initial stage of MD simulation. This leads to very large oscillation in σzz, at a frequency that is several orders of magnitudes smaller than the Debye frequency. We suppress this “breath” mode by running simulations using a stochastic thermostat,Reference Anderson50 which is more effective than the Nosé–Hoover thermostatReference Hoover51 for equilibrating systems with a wide range of eigenfrequencies.
B. Nucleation rate calculation
In this work, we predict the nucleation rate based on the BD theory, which expresses the nucleation rate as

where  is the molecular attachment rate, Γ is the Zeldovich factor, and Fc is computed with the shape and volume of the simulation cell fixed. We assume that the activation Helmholtz free energy Fc obtained from the finite simulation cell is very close to the value of Fc in the infinite volume limit, which equals the activation Gibbs free energy Gc (see Appendix B). The activation Gibbs free energy at zero temperature, i.e., Gc(σ, T = 0), can be obtained from the stress-controlled NEB method.Reference Zhu, Li, Van Vliet, Ogata, Yip and Suresh52 Due to the finite size of the simulation cell, Gc(σ, T = 0) is expected to be slightly different from Fc(γ, T = 0) obtained under the constant strain condition, but such difference is ignored in this paper. The BD theory and TST only differ in the frequency prefactor. Whereas TST neglects multiple recrossing over the saddle point Reference Hanggi, Talkner and Borkovec15, Reference Chandler22 by a single transition trajectory, the recrossing is accounted for in the BD theory through the Zeldovich factor.
The Helmholtz free energy barrier Fc is computed by umbrella sampling (Fig. 3).Reference Ryu, Kang and Cai25 The umbrella sampling is performed in Monte Carlo simulations using a bias potential that is a function of the order parameter n, which is chosen to be number of atoms inside the dislocation loop. The bias potential  is supeimposed on the embedded atom method potential, where
 K and
 is the center of the sampling window. We chose
 empirically so that the width of the sampling window on the n axis would be about 10. The umbrella sampling provides F(n) at a given γ and T. The maximum value of the free energy curve F(n) is the activation free energy Fc and the maximizer is the critical dislocation loop size n c. The Zeldovich factor Γ can be computed from the definition Γ ≡ (η/2πk BT)1/2, where
 .
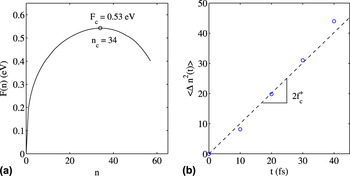
(a) The Helmholtz free energy of the dislocation loop as a function of its size n during homogeneous nucleation at T = 300 K and σxy = 2.16 GPa (γxy = 0.135) obtained from umbrella sampling. (b) Size fluctuation of critical nuclei from MD simulations.

In the previous study, we used a method suggested by Ngan et al.Reference Ngan, Zuo and Wo53 to identify the formation of the dislocation loop and compute the reaction coordinate n. We labeled an atom as “slipped” if its distance from any of its original nearest neighbors has changed by more than a critical distance d c. We chose d c = 0.33, 0.38, and 0.43 Å for T values of ≤400, 500, and 600 K, respectively, because thermal fluctuation increases with temperature. The slipped atoms are grouped into clusters; two atoms belong to the same cluster if their distance is less than a cutoff distance r c (3.4 Å). The reaction coordinate is defined as the number of atoms in the largest cluster divided by two.
A possible problem of this reaction coordinate is that it does not take the slip direction into account even though we are specifically interested in slip along the  direction, which is parallel to the Burgers vector of the Shockley partial. In this paper we use another order parameter to focus exclusively on the slip along the
 direction. As a self-consistency check, the activation free energy should be independent of this modification of the order parameter. To compute the new order parameter during umbrella sampling, we focus on atoms on one (111) plane, each of which has 12 neighbor atoms: 3 in the plane above, 6 in the same plane, and 3 in the plane below. When the relative displacement along the
 direction between an atom and the center of mass position of its 3 neighbor atoms in the plane below exceeds a critical distance d c = 0.35 Å, we label the atom as slipped. Here, we used a smaller cutoff radius of r c = 3.09 Å to group slipped atoms into a cluster. The size of the largest cluster of the slipped atoms is the reaction coordinate n.
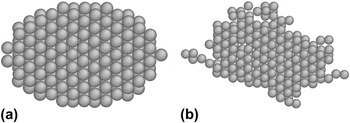
As expected, we found that the predictions of the free energy barrier and nucleation rate are independent of these two choices of the reaction coordinate. The data obtained from these two methods match within statistical errors. In the following analysis, we use the data from the new order parameter, because its definition appears to be more physical. Figure 4(a) and 4(b) show the critical cluster sampled by the simulation of homogeneous dislocation nucleation at T = 0 K (from the string method) and T = 300 K (from umbrella sampling). Although the dislocation loop at 0 K appears symmetric, the configuration at 300 K is distorted because of thermal fluctuation.
Atomistic configurations of dislocation loops at (a) 0 K and (b) 300 K.

The attachment rate  is computed by direct MD simulations. From umbrella sampling, we collected an ensemble of 500 atomic configurations for which n = n c and ran MD simulations using each configuration as an initial condition. The initial velocities are randomized according to the Maxwell–Boltzmann distribution. The mean square change of the loop size, 〈Δn 2(t)〉, as shown in Fig. 3(b), is fitted to a straight line,Reference Ryu and Cai54
 , in order to extract
 .
IV. RESULTS
A. Benchmark with MD simulations
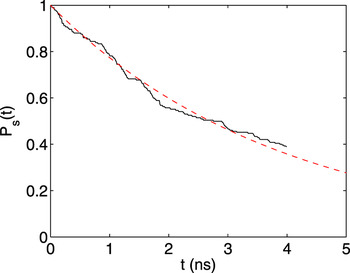
Before applying the BD theory to predict the nucleation rate at a wide range of applied load and temperature, we would like to establish the applicability of the theory to dislocation nucleation. We benchmark the prediction of BD theory against direct MD simulations at a relatively high stress σ = 2.16 GPa (γ = 0.135) at T = 300 K for homogeneous nucleation. To obtain the average nucleation time at the given condition, we performed 192 independent MD simulations using the NVT ensemble with random initial velocities. Each simulation ran for 4 ns. If dislocation nucleation occurred during this period, the nucleation time was recorded. This information is used to construct the function Ps(t), which is the fraction of MD simulation cells in which dislocation nucleation has not occurred at time t, as shown in Fig. 5. We found that Ps(t)can be well fitted to the form of exp(−I MDt), from which the nucleation rate I MD is predicted to be I MD = 2.5 × 10⁸ s−1.
The fraction of 192 MD simulations in which dislocation nucleation has not occurred at time t, Ps(t), at T = 300 K and σxy = 2.16 GPa (γxy = 0.135). The dotted curve represents the fitted curve exp(−I MDt) with I MD = 2.5 × 10⁸ s−1. (color online)

From umbrella sampling at the specified condition, we obtain the free energy function F(n). Figure 3(a) shows the maximum of F(n), which gives the activation free energy Fc = 0.53 ± 0.01 eV and the critical nucleus size n c = 34. The Zeldovich factor, Γ = 0.051, is obtained from Γ ≡ (η/2πk BT)1/2, where  . Using the configurations collected from umbrella sampling with n = n c as initial conditions, MD simulations give the attachment rate
 , as shown in Fig. 3(b). Because the entire crystal is subjected to uniform stress, the number of nucleation sites is the total number of atoms, N s = 14,976.
Combining these data, the classical nucleation theory predicts the homogeneous dislocation nucleation rate to be I BD = 4.8 × 10⁸ s−1, which is within a factor of two of the MD prediction. The difference between the two is comparable to our error bar. This agreement is noteworthy because no adjustable parameters such as the frequency prefactor are involved in this comparison. It shows that the classical nucleation theory and our numerical approach are suitable for the calculation of the dislocation nucleation rate.
B. Homogeneous dislocation nucleation in bulk Cu
Having established the applicability of nucleation theory, we now examine the homogeneous dislocation nucleation rate under a wide range of temperature and strain (stress) conditions relevant for experiments and beyond the limited timescale of brute force MD simulations. We find that the prefactor  is a slowly changing function of stress and temperature. It varies by less than a factor of two for all of the conditions tested here. The average value of ν0 is about 2.5 × 10¹³s−1, which is comparable to the Debye frequency of ∼1013 s−1.
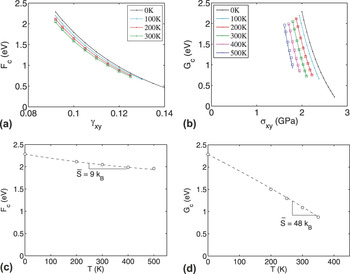
The nucleation rate varies dominantly by the change of the activation free energy Fc(γ, T), which is presented as a function of γ at different T in Fig. 6(a). The zero temperature data (i.e., activation energies) are obtained from minimum energy path (MEP) searches using a modified version of the string method, similar to that used in the literature.Reference Zhu, Li, Samanta, Leach and Gall14, Reference Zhu, Li, Samanta, Kim and Suresh55 The downward shift of Fc curves with increasing T is the signature of the activation entropy Sc(γ). Figure 6(c) plots Fc as a function of T at γ = 0.092. For T < 400 K, the data closely follow a straight line, whose average slope gives  in the range of 0–300 K. This activation entropy contributes a significant multiplicative factor, exp(Sc/k B) ≈ 104, to the absolute nucleation rate and cannot be ignored.
Activation Helmholtz free energy for homogeneous dislocation nucleation in Cu. (a) Fc as a function of shear strain γ at different T, and (b) Gc as a function of shear strain σ at different T. Squares represent umbrella sampling data and dots represent zero temperature MEP search results using simulation cells equilibrated at different temperatures. (c) Fc as a function of T at γ = 0.092, and (d) Gc as a function of T at σ = 2.0 GPa. Circles represent umbrella sampling data and dashed lines represent a polynomial fit. (color online)

In Section II. D., we mentioned that the activation entropy would be negligible if only the vibrational entropy were taken into account. It is likely that the origin of the large activation entropy is an anharmonic effect such as thermal expansion. To examine the effect of thermal expansion, we performed a zero temperature MEP search at γ = 0.092, but with other strain components fixed at the equilibrated values at T = 300 K. This approach is similar to the quasiharmonic approximationReference Foiles56, Reference de Koning, Miranda and Antonelli57 often used in free energy calculations in solids, except that, unlike quasiharmonic approximation, the vibrational entropy is completely excluded here. The resulting activation energy,  eV, is indistinguishable from the activation free energy Fc = 2.05 ± 0.01 eV at T = 300 K computed from umbrella sampling. For T < 400 K, we observe that the activation energy
 and Fc match well at each γ and T condition (see Table E.I in Appendix E).
Because atoms do not vibrate in the MEP search, this result shows that the dominant mechanism for the large Sc(γ) is thermal expansion, whereas the contribution from vibrational entropy is negligible. As the temperature increases, thermal expansion pushes neighboring atoms further apart and weakens their mutual interaction. This expansion makes crystallographic planes easier to shear and significantly reduces the free energy barrier for dislocation nucleation. Here, we confirm that Sc(γ) arises almost entirely from the anharmonic effect for dislocation nucleation. At T = 400 and 500 K, we observe significant differences between Fc computed from umbrella sampling and  computed from a zero temperature MEP search in an expanded cell. These differences must also be attributed to anharmonic effects. The activation energy
 from the expanded cell and the activation free energy Fc(γ,T) at T = 400 and 500 K are not plotted in Fig. 6(a) because they overlap with data points at lower temperatures. All data can be found in Table E.I in Appendix E.
Combining the activation Helmholtz free energy Fc(γ, T) and the stress–strain relations, we obtain the activation Gibbs free energy Gc(σ,T) shown in Fig. 6(b). We immediately notice that the curves at different temperatures are more wide apart in Gc(σ,T) than those in Fc(γ, T), indicating a much larger activation entropy in the constant stress ensemble. For example, Fig. 6(d) plots Gc as a function of T at σ = 2.0 GPa, from which we can obtain an averaged activation entropy of  in the temperature range of 0–300 K. This activation entropy contributes a multiplicative factor of
 to the absolute nucleation rate, as shown in Fig. 1.
The dramatic increases in the activation entropy when stress (instead of strain) is kept constant is consistent with the theoretical prediction in Section II. This is caused by changing the stress–strain relationship with the temperature. For example, when the shear stress is kept at σxy = 2.0 GPa, the corresponding shear strain at T = 0 K is γxy = 0.092. However, at T = 300 K, the same stress is able to cause a larger strain, γxy = 0.113. Hence, at constant stress the activation free energy decreases much faster with temperature than that at constant strain.
C. Heterogeneous dislocation nucleation in Cu nanorod
We studied dislocation nucleation from the corner of a [001]-oriented copper nanorod with {100} side surfaces under axial compression. While the size of dislocation loop n is the only order parameter used in the umbrella sampling, the umbrella sampling simulation automatically locates the dislocation nucleus at the corner of nanorod, as shown in Fig. 2(c). This is because the nucleation barrier is much smaller for the nucleation from the corner than the surface, as found by Zhu et al.Reference Zhu, Li, Samanta, Leach and Gall14 We also find that the prefactor v 0 varies slowly similar to homogeneous nucleation, changing less than one order of magnitude at all γ and T conditions tested. It is interesting that the average value of v 0 is about 0.5 × 10¹³ s−1, several times smaller than the average prefactor homogeneous nucleation. The measured growth rate  of a critical nucleus turns out to be significantly smaller (by about a factor of 3) due to the shorter dislocation line length relative to that of the complete dislocation loop in homogeneous nucleation.
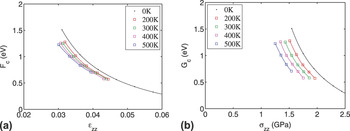
Figure 7 plots the activation free energy barrier as a function of axial compressive strain ɛzz and compressive stress σzz. Both Fig. 7(a) and (b) show the reduction of the activation free energy with temperature, and the reduction in (b) is more pronounced because of thermal softening. For example, at the compressive elastic strain of ɛ = 0.03, the compressive stress is σ = 1.56 GPa at T = 0 K. The activation entropy Sc(ɛ) at this elastic strain equals 9 k B, whereas the activation entropy Sc(σ) at this stress equals 17 k B. Unfortunately, we could not perform the MEP search at zero temperature using an expanded cell to mimic the thermal expansion effect because of the free surface of the nanorod.
Activation free energy for heterogeneous dislocation nucleation from the surface of a Cu nanorod. (a) Fc as a function of compressive strain ɛzz at different T. (b) Gc as a function of compressive stress σzz at different T. Squares represent umbrella sampling data and dots represent zero temperature MEP search results. (color online)

The activation entropy difference is smaller than the homogeneous nucleation because both the thermal softening and the activation volume are smaller. In order for the homogeneous nucleation to occur at room temperature, the perfect crystal must be sheared significantly, close to the ideal shear strength. In such a high nonlinear elastic regime, the thermal softening effect becomes very large, as depicted in Fig. 2. However, it is much easier for the heterogeneous nucleation to occur so that it can happen when the nanorod is subjected to a moderate loading in which the stress–strain relation is still relatively linear. Therefore, the thermal softening effect is not as large as the case of homogeneous nucleation. Because the applied compression stress is not parallel to the slip direction (Schmid factor = 0.471), the activation free energy is less sensitive to the applied stress, leading to a smaller activation volume compared with the case of homogeneous nucleation (see Appendix F for more discussions on the activation volume).
V. DISCUSSION
A. Testing the thermodynamic compensation law
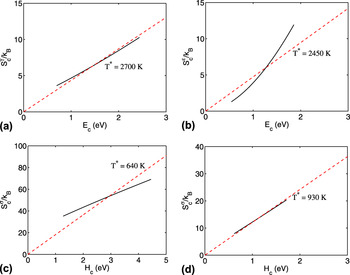
With the numerical results of Gc(σ,T), we can test the approximations Sc(σ) = Hc(σ)/T * and Sc(γ) = Ec(γ)/T *. Specifically, we are interested in whether Sc(σ) is proportional to Hc(σ), whether Sc(γ) is proportional to Ec(γ), and, if so, how the coefficient T * compares with the (bulk or surface) melting point of Cu. Equations (31) and (33) assume that the activation entropies do not depend on temperature, but our data show that they do vary with temperature for T ≥ 400 K. Hence, we tested the average activation entropy  in the range of zero to 300 K. For homogeneous nucleation, we found that Sc(γ) can be roughly approximated by Ec(γ)/T * with T * ≈ 2700 K as shown in Fig. 8(a), whereas Sc(σ) is not proportional to Hc(σ) as shown in Fig. 8(c). In contrast, for heterogeneous nucleation, we found that Sc(ɛ) can be approximately fitted to Ec(γ)/T * with T * = 2450 K as shown in Fig. 8(b), whereas Sc(σ) can be approximately fitted to Hc(σ)/T * with T * = 930 K as shown in Fig. 8(b). Both values of the fitted T * are different from the surface melting temperatureReference Zhu, Li, Samanta, Leach and Gall14 T m = 700 K. The value of T * = 2450 K also greatly exceeds the (bulk) melting point of Cu (1358 K, see Ref. 58). Hence, the empirical fitting parameter T * is most likely not connected to the melting phenomenon. Figure 8 shows a consistent trend that the activation entropy increases as the activation enthalpy (or the activation energy) increases. The compensation law appears to hold for Sc(σ) in heterogeneous nucleation and for Sc(γ) in homogeneous nucleation, but it does not hold for Sc(σ) in homogeneous dislocation nucleation.
The relation between Ec and Sc in the temperature range of 0 to 300 K for (a) homogeneous and (b) heterogeneous nucleation. The relation between Hc and Sc for (c) homogeneous and (d) heterogeneous nucleation. The solid lines represent simulation data and the dashed lines are empirical fits of the form Sc = Ec/T * or Sc = Hc/T *. (color online)

Because the activation entropies in dislocation nucleation mainly come from anharmonic effects such as thermal softening and thermal expansion, the exhibition of the compensation law in Fig. 8(a) and (d) cannot be attributed to the usual explanationReference Kemeny and Rosenberg42, Reference Yelon, Movaghar and Crandall59 that the activation energy is provided by multiple (small) excitations. The breakdown of the compensation law for Sc(σ) in homogeneous dislocation nucleation is probably caused by the elastic nonlinearity at the high stress needed for homogeneous nucleation.
We note that the empirically fitted value of T * = Ec(γ)/Sc(γ) is close to the estimated value of 3000 K, which is based on a 10% reduction of the shear modulus as the temperature increases from 0 to 300 K (see Section II. D.). Therefore, Eq. (32) can be considered as a reasonable approximation to the activation Helmholtz free energy as a function of strain, that is,

whereas Eq. (28) is not a good approximation for Gc(σ,T). In other words, Eq. (33) can be considered as a reasonable approximation to the activation entropy Sc(γ), that is ,

whereas Eq. (31) is not a good approximation for Sc(σ). See Appendix D for more discussions on the approximation of Sc(σ).
B. Entropic effect on nucleation rate and yield strength
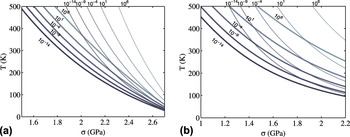
In this section, we discuss how the activation entropies affect experimental measurements. The simplest case to consider is to subject a perfect crystal to a constant stress (i.e., creep) loading condition and measure the rate of dislocation as a function of stress and temperature. (In practice, these kinds of experiments are very difficult to carry out,Reference Schuh, Mason and Lund5 especially to observe homogeneous nucleation.) The data can be plotted in the form of contour lines, similar to those shown in Fig. 9, which are our theoretical predictions. To make these predictions, we used the activation Gibbs free energy obtained from umbrella sampling. Because the frequency prefactor  varies slowly with σ and T, we used average values of 2.5 × 10¹³ s−1 for the homogeneous nucleation and 0.5 × 10¹³ s−1 for the heterogeneous nucleation. To show the physical effect of the large activation entropies, the thin lines plot the rate predictions if the effect of Sc(σ) was completely neglected. Significant deviations between the two sets of contour lines are observed. For homogeneous dislocation nucleation, at T = 400 K and σxy = 2.0 GPa (where a thick and a thin contour line cross), we see about a 20 orders of magnitude difference between the two contours. The difference between thick and thin curves becomes larger at smaller stress because the activation entropy becomes larger at smaller stress. For heterogeneous nucleation, at T = 300 K and σzz = 1.5 GPa, the neglect of activation entropy would cause an underestimate of the nucleation rate by 10 orders of magnitude. The smaller activation volume in heterogeneous dislocation is manifested by the larger gaps between the contour lines at different nucleation rates.
Contour lines of (a) homogeneous and (b) heterogeneous dislocation nucleation rates per site I as a function of T and σ. The predictions with and without accounting for the activation entropy Sc(σ) are plotted in thick and thin lines, respectively. The nucleation rate of I ∼ 106 s−1 per site is accessible in typical MD timescales whereas the nucleation rate of I ∼ 10−4−10−9 is accessible in typical experimental timescales, depending on the number of nucleation sites.

Experimentally, it is often convenient to impose a constant strain rate to the crystal and measure the stress–strain curve and the yield strength under the given strain rate. If the crystal contains no preexisting defects, then the yield strength is the stress at which the first dislocation nucleates. The following implicit equation for the yield strength σY has been derived by considering a nanorod is loaded at a constant strain rate  :

This equation is derivedReference Zhu, Li, Samanta, Leach and Gall14, Reference Ngan, Zuo and Wo53 based on the assumption that the nanorod remains linear elastic with Young’s modulus E prior to yielding and that v 0 is insensitive to σ and T. One may apply this equation to homogeneous nucleation if we replace E by the shear modulus μ and the uniaxial strain rate  by
 . However, because we observe that the crystal becomes nonlinear elastic prior to dislocation nucleation (see Fig. 2), we predict the yield strength numerically without assuming linear elasticity. The stress–strain relations shown in Fig. 2(b) and (d) are used to extract the stress rate given the imposed strain rate and current strain. We replace E in Eq. (39) by
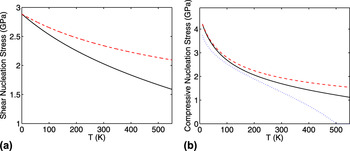
 . The athermal nucleation stress causing dislocation nucleation at T = 0 K is σxy = 2.8 GPa for homogeneous nucleation and σzz = 4.7 GPa for heterogeneous nucleation, which can also be obtained from Fig. 2(b) and (d). At 300 K and a strain rate of 10−3 s−1, however, the yield strength (i.e., nucleation stress) becomes
 GPa for homogeneous nucleation, about 71% of the athermal nucleation stress, and
 GPa for heterogeneous nucleation, about 36% of the athermal stress.
Figure 10 plots our predictions of the yield strength as a function of temperature at a strain rate of 10−3 s−1. As the temperature rises, the nucleation stress decreases. This decrease is faster in the heterogeneous nucleation [Fig. 10(b)] than in the homogeneous nucleation [Fig. 10(a)]. This observation can be explained by the larger activation volumes in the homogeneous nucleation than those in the heterogeneous nucleation. We note that the predicted nucleation stress depends on both the number of atoms in the sample and the applied strain rate. Increasing the number of atoms has the same effect as decreasing the strain rate.
(a) Nucleation stress of our bulk sample (containing 14,976 atoms) under a constant shear strain loading rate γ = 10−3 and (b) nucleation stress of the nanorod under a constant compressive strain loading rate  = 10−3. The strain rate 10−3 is the experimentally accessible loading rate. The solid lines are the prediction based on the activation free energy computed by umbrella sampling. The dashed lines are the nucleation stress prediction when the activation entropy is neglected. The dotted line is the prediction based on the approximation by Zhu et al.Reference Zhu, Li, Samanta, Leach and Gall14 (color online)

For comparison, Fig. 10(b) also plots the prediction by Zhu et al.,Reference Zhu, Li, Samanta, Leach and Gall14 which is based on the assumption of Sc(σ) = Hc(σ)/T m with Tm = 700 K. (The yield strength is only plotted up to T = 300 K in the original paper.Reference Zhu, Li, Samanta, Leach and Gall14) The two predictions (solid and dotted lines) are close to each other for T < 200 K, but their difference becomes large for T ≥ 300 K. The dotted line suggests that the yield strength vanishes at T = 500 K, but our prediction (solid line) shows that the nanorod still retains 71% of its room temperature strength at 500 K. We believe this difference is caused by the overestimate of the activation entropy when assuming Tm = 700 K in Sc(σ) = Hc(σ)/T m.
VI. SUMMARY
In this paper, we have shown that the dislocation nucleation rate is independent of whether a constant stress or a constant strain is applied, because Fc(γ, T) = Gc(σ,T) when σ and γ lie on the stress–strain curve at temperature T. This naturally results in different activation entropies, depending on whether a constant stress or constant strain ensemble is used. The difference between the two activation entropies equals the activation volume times a term that characterizes the thermal softening effect. We have shown that the BD theory combined with the activation free energy determined by umbrella sampling can accurately predict the rate of dislocation nucleation. In both homogeneous and heterogeneous dislocation nucleation, a large activation entropy at constant elastic strain is observed, and it is attributed to the weakening of atomic bonds due to thermal expansion. The activation entropy at constant stress is even larger because of the thermal softening. Both effects are an harmonic in nature, and they emphasize the need to go beyond harmonic approximation in the application of rate theories in solids. The compensation law turns out not to hold for homogeneous dislocation nucleation, probably because of the nonlinear effects at high stress conditions. The compensation law appears to work better for heterogeneous nucleation, which is probably related to the linearity of the stress–strain relation. We predicted that the yield stress decreases faster with temperature for the heterogeneous nucleation than for the homogeneous nucleation. We believe that our methods and the general conclusions are applicable to a wide range of nucleation processes in solids that are driven by shear stress, including cross slip, twinning, and martensitic phase transformation.
APPENDIX A: EQUALITY OF CRITICAL SIZES  AND
 AND

Suppose that the Gibbs free energy G(n,σ,T) is maximized at  , then

Note that T is held constant throughout this section. Through the Legendre transform, Eq. (5), we have the following property for the Helmholtz free energy F(n,γ,T):

By definition, F(n,γ,T) reaches maximum at  at constant γ and T,

Therefore, we establish that  , that is, the maximizer
 of G(n,σ,T) is also the maximizer
 of F(n,γ,T).
APPENDIX B: EQUALITY OF ACTIVATION GIBBS AND HELMHOLTZ FREE ENERGIES
The activation Gibbs free energy is the free energy difference between state 0, a perfect crystal, and state 1, a crystal containing a critical dislocation loop under a same shear stress σ. Because of the plastic shear deformation caused by the dislocation loop, state 1 has a higher strain (γ) than state 0 (γ0). It has been shown that the maximizer  of G(n,σ,T) equals the maximizer of
 of F(n,γ,T) when σ equals σ(n c,γ,T), as defined in Eq. (6). Note that we keep σ to be the stress at n c,γ, and T. Then at the same σ, but for n = 0, the strain becomes γ0. Hence, the activation Gibbs free energy barrier can be written as

Note that F(n c,γ,T) and F(0,γ 0,T) do not correspond to the same strain state, so that their difference is not the activation Helmholtz free energy. To construct the activation Helmholtz free energy, we subtract and add the F(0,γ,T) term in the right hand side,

Note that γV = −∂G(n c,σ,T)/∂σ and γ0V = −∂G(0,σ,T)/∂σ. Then (γV − γ 0V) is equivalent to −(∂/∂σ)(G(n c,σ,T) − G(0,σ,T)) = −(∂Gc/∂σ) ≡ Ωc, that is, the activation volume. By plugging (γ − γ 0) = Ωc/V into the equation, we have

In the thermodynamics limit (V→∞), we have Gc = Fc. Hence, the nucleation rate does not depend on whether the crystal is subjected to constant stress or constant strain loading. The equality allows us to compute the activation Gibbs free energy Gc(σ,T) by combining the activation Helmholtz free energy Fc(γ,T) and the stress–strain relations of the perfect crystal shown in Fig. 2(b) and (d).
APPENDIX C: PHYSICAL INTERPRETATION OF ACTIVATION ENTROPY DIFFERENCE ΔSc
It is well known that entropy is a thermodynamic state variable that is independent of the ensemble of choice, that is,  and
 equal to each other as long as
 . At the same time, the activation entropy is just the entropy difference between the activated state and the metastable state, that is, Sc(γ,T) = S(n c,γ,T) − S(0,γ,T) and Sc(σ,T) = S(n c,σ,T) − S(0,σ,T). If the entropies in two ensembles can equal each other, it may seem puzzling how the activation entropies can be different.
The resolution of this apparent paradox is that under the constant applied stress, the nucleation of a dislocation loop causes a strain increase. Let γ be the strain at the state defined by n = nc, σ, and T, and γ0 be the strain at the state defined by n = 0, σ, and T, then γ > γ 0. Hence, we have S(n c,σ,T) = S(n c,γ,T) and S(0,σ,T) = S(0,γ 0,T), but S(0,γ,T) ≠ S(0,γ 0,T).

This shows that the activation entropy difference ΔSc ≡ Sc(σ) − Sc(γ) equals to S(0,γ,T) − S(0,γ 0,T), which is the entropy difference of the perfect crystal at two slightly different strains.
In the limit of V → ∞, because we expect (γ − γ 0) → 0, we might reach a false conclusion that ΔSc = (S(0,γ,T) − S(0,γ 0,T)) → 0. Instead, the correct behavior in the thermodynamic limit can be obtained by expanding ΔSc in a Taylor series,

where the Maxwell relationship  is used. The term (γV − γ 0V) equals the activation volume Ωc and can be interpreted as plastic strain γpl due to the formation of a dislocation loop times the volume of the crystal, that is,

where b is the magnitude of the Burgers vector and A c is the area of the critical dislocation loop. Using the relation (γ−γ 0) = Ωc/V, we have

which is exactly the same as Eq. (24).
A similar expression has been obtained for the difference between point defect formation entropies under constant pressure (S p) and under constant volume (S v),Reference Argon, Andrews, Godrick and Whitney39 with

where  is the thermal expansion factor at zero hydrostatic pressure p, B is the isothermal bulk modulus, and V rel is the relaxation volume of the defect. In Cu, the value of S p − S v is estimated to be −1.7 k B for a vacancy and 13.7 k B for an interstitial.Reference Mishin, Sorensen and Voter36 Comparing Eq. (C5) with Eq. (C4), we note that relaxation volume V rel for point defects corresponds to the activation volume Ω for dislocation nucleation and that βB corresponds to the −(∂σ/∂T) term. The similarity between these two equations is because they both express the entropy difference between two states, and the choice of the two states depends on whether the stress or the strain is kept constant when the defect is introduced. In contrast, there are also some differences between the physics expressed by these two equations. First, thermal expansion plays a prominent role in Eq. (C5) because it focuses on hydrostatic stress and strain effects. In comparison, thermal expansion does not play a role in Eq. (C4) because it focuses on shear stress and strain effects. Second, the formation entropy of a point defect is the entropy difference between two metastable states and governs equilibrium properties, for example, the density of vacancies at thermal equilibrium. In comparison, the activation entropy is the entropy difference between a saddle (i.e., unstable) state and a metastable state and governs kinetics, such as the dislocation nucleation rate. In addition, the saddle state (i.e., the size of the critical nucleus) depends on stress and temperature, whereas such complexity does not arise in the formation entropy of point defects.
APPENDIX D: APPROXIMATION OF Sc(σ)
We now introduce a series of simplifying approximations to estimate the magnitude of Sc(σ) in the low temperature, low stress limit. In the temperature range of 0–300 K, the activation entropy is found to be insensitive to temperature. Starting from Eqs. (24) and (38), we have

If we assume the crystal is linear elastic, that is, σ = μγ, then

Similar expressions can be obtained for normal (compressive) loading by replacing γ with є and replacing μ by the Young’s modulus.
To gain more intuition, we note that in the limit of σ→0, the line tension model estimates that Hc(σ) ∝ σ −1. In addition, in the limit of T→0, Ωc(σ) ≈ ∂Hc/∂σ. Under these conditions, Ωc(σ) × σ ≈ Hc(σ), so that

Comparing Eq. (D3) with Eq. (38), we have

This trend is qualitatively observed in heterogeneous nucleation, when comparing Fig. 8(b) and (d), and is less clear in homogeneous nucleation, when comparing Fig. 8(a) and (c). This is probably because the stress–strain relationship is more nonlinear in the case of homogeneous nucleation.
APPENDIX E: ACTIVATION FREE ENERGY DATA
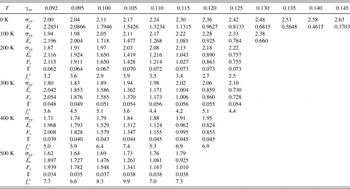
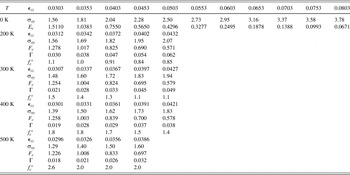
Table E.I and Table E.II provide the activation free energy data at all temperature and strain conditions in this study so that interested readers can use them as a benchmark. For homogeneous nucleation, the strain γxy is defined as  , where Δx is the displacement of the repeat vector initially in the y direction along the x axis at each pure shear stress condition and
 is the height of the cell along the y axis at zero temperature without external loading. Shear stress σxy is determined from the x–y component of the average Virial stress. For heterogeneous nucleation, we take only the elastic strain into account. The elastic strain ɛzz at T is defined as
 where Lz(σ,T) is the length of the repeat vector along the z axis; Lz(σ = 0,T) is the equilibrium length at temperature T under zero stress; and
 is the reference length (before relaxation), where a 0 is the lattice constant of copper. The compressional stress σzz is defined by σzz = <F>/d2, where <F> is the axial force computed from the z–z component of the average Virial stress and d = 15a 0 = 54.225 Å is the reference side length of the nanorod.
Data for homogeneous nucleation: σxy (Gpa); Ec ,  , and F c (eV); and
 (1014 s−1).

Note: γxy and Γ are dimensionless. The error in  is about 0.003 eV, which is due to the small errors in equilibrating the simulation cell to achieve the pure shear stress state. The error in Fc is about 0.5 k BT, that is, approximately 0.01 eV, which is due to the statistical error in umbrella sampling. The error in Zeldovich factor Γ is within ±0.01. The attachment rate
 has relative error of ±50%.
Data for heterogeneous nucleation: σzz (Gpa), Ec and Fc (eV), and  (1014 s−1).

Note: γxy and Γ are dimensionless. The error in Fc is about 0.5 k BT, that is, approximately 0.01 eV, which is due to the statistical error in umbrella sampling. The error in Zeldovich factor Γ is within ±0.01. The attachment rate  has a relative error of ±50%. Note that, because of the existence of thermal strain, the elastic strain values are slightly different at different temperatures.
APPENDIX F: ACTIVATION VOLUME AND CRITICAL LOOP SIZE
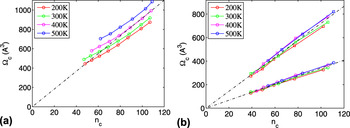
The activation volume Ωc is defined as the derivative of activation free energy with stress, that is,  , and measures the sensitivity of the nucleation rate to the stress. Physically, it is interpreted as plastic strain associated with the dislocation loop times the volume of the crystal, that is, Ωc = bA c, where A c is the area of the critical dislocation loop (see Appendix C). Here, we use our numerical data to test the validity of the latter interpretation.
Because the activation volume measures the sensitivity of Gc(σ,T) to applied stress [see Eq. (10)], it must be proportional to the Schmid factor S in uniaxial loading. Hence, the hypothesis we wish to test is

where b is the magnitude of the Burgers vector and A a is the average area each atom occupies on the {111} slip plane. Given that the lattice constant of Cu is a 0 = 3.615 Å, we have b = a 0/√6 = 1.48 Å and  , so that bA a = 8.35 Å3. For the pure shear loading in our homogeneous nucleation case, the Schmid factor S = 1. For the uniaxial loading in our heterogeneous nucleation case, S = 0.471.
Figure E1 plots n c versus Ωc for both homogeneous and heterogeneous dislocation nucleations. In both cases, Ω c appears to be roughly linear with n c, as expected from Eq. (F1). For homogeneous nucleations under pure shear [Fig. E.I(a)], the slope of the curves is roughly Ω c /n c ≈ 10 Å3, close to the expected value of 8.35 Å3. For heterogeneous nucleation under compression, [Fig. E1(a)], the slopes of the curves after correction for the Schmid factor is roughly Ω c /(n c S) ≈ 8 Å3, which is similar to the case of homogeneous nucleation. Therefore, our data confirm that the activation volume is proportional to the size of the critical dislocation loop. That Ω c /(n c S) is somewhat smaller than bA a supports the notion that the Burgers vector of a critical dislocation nucleus is smaller than that of a fully formed dislocation.Reference Xu, Argon and Ortiz 9 , Reference Aubry, Kang, Ryu and Cai 11
The relation between critical dislocation size n c and the activation volume Ω ≡ −(∂Gc /∂σ). (a) Homogeneous nucleation and (b) heterogeneous nucleation. Circles represent the activation volume obtained from the derivative of Gc with respect to σ. Squares represent the activation volume data multiplied by 1/S, where S is the Schmid factor. Dashed lines are linear fits to the data.