I. INTRODUCTION
In times of increasing energy costs and more focus on environmental problems, the replacement of conventional incandescent lamps by light emitting diodes (LEDs) is a hot topic. White light from LEDs has to be generated by either the suitable phosphor for light conversion,Reference Schlotter, Schmidt and Schneider1,Reference Raukas, Kelso, Zheng, Bergenek, Eisert, Linkov and Jermann2 or by synthesis using red, blue, and green emitting LEDs. While growth of efficient blue LEDs based on the group III nitrides was achieved and rewarded with the Nobel Prize 2014, the green InGaN LEDs still suffer from efficiency problems.Reference Nakamura, Senoh, Iwasa and Nagahama3 This phenomenon is labeled as green gap. Another unsolved issue is the reduced efficiency for higher LED currents. The physical origin of this so-called droop is still under discussion.Reference Kim, Schubert, Dai, Kim, Schubert, Piprek and Park4–Reference Bertazzi, Goano, Zhou, Calciati, Ghione, Matsubara and Bellotti10 The use of semipolar materials may be a promising approach.
However, the growth of the group III nitrides is usually performed on foreign substrates, resulting in dislocations, stacking faults (SFs), and strain due to the lattice mismatch to the substrate. SFs and dislocations are reported to reduce the device efficiency by providing alternative current paths for diodes,Reference Kozodoy, Ibbetson, Marchand, Fini, Keller, Speck, DenBaars and Mishra11–Reference Hsu, Manfra, Chu, Chen, Pfeiffer and Molnar13 transistors,Reference Miller, Dang and Yu14–Reference Ganguly, Verma, Hu, Xing and Jena16 LEDs,Reference Hafiz, Zhang, Monavarian, Okur, Avrutin, Morkoç and Özgür17 and for n-doped GaN layers as well.Reference Yokoyama, Kamimura, Edagawa and Yonenaga18
In this work, we focus on the electronic and corresponding optical properties of basal plane stacking faults (BSFs) in semipolar GaN and AlGaN structures. For these BSFs, a possible model for their electronic band structure in the group III nitrides is discussed. These calculations are compared with recent spectroscopic results. A detailed analysis of the energy shift for specific defect types allows to distinguish between shifts in emission energy caused by composition fluctuations for an AlGaN layer and the stacking fault related emission bands. This distinction yields information about local changes in Al content introduced by the BSFs themselves.
II. QUANTUM WELL (QW) MODEL FOR THE BSFS
The stacking sequence along the wurtzite GaN (0001) direction is given by …ABAB…,Reference Drum19,Reference Zakharov, Liliental-Weber, Wagner, Reitmeier, Preble and Davis20 where A and B denote hexagonal closed-packed GaN bilayers. The distance between two A or B planes is the c lattice constant. If this sequence is distorted resulting in the sequence  $\ldots ABAB\underline {ABC} BCBC \ldots$ the I1 type BSF is formed. The underlined part marks the defect itself. The I2 type BSF is indicated by the stacking sequence
 $\ldots ABAB\underline {ABCA} CACA \ldots$. The typical arrow shape of the BSF of I3 type looked at in the a plane is created by the sequence
 $\ldots ABAB\underline {ABCBA} BABA \ldots$. Finally, the extrinsic (E type) BSF
 $\ldots AB\underline {ABCAB} AB \ldots$ is formed by introducing an additional misplaced plane without any further change in stacking order.
In the sequence I1, I2, and E type BSF each of the defects shows a part of the stacking order  $\ldots ABCABCABC \ldots$, which can be considered as an inclusion of zinkblende material along the cubic (111) direction. The thickness of these defects changes by one half of the c lattice constant from one to the other except for the I3 BSF, which does not follow this rule, but might be regarded as a zinkblende layer.
The zinkblende lattice order leads to a common approach to model the electronic structure. The fundamental low temperature band gap of cubic GaN (3.302 eV from Ramírez-Flores et al.Reference Ramírez-Flores, Navarro-Contreras, Lastras-Martínez, Powell and Greene21) is smaller than the wurtzite one (3.504 eV from MonemarReference Monemar22). Several groups (i.e., Rebane et al.,Reference Rebane, Shreter and Albrecht23 Albrecht et al.,Reference Albrecht, Christiansen, Salviati, Zanotti-Fregonara, Rebane, Shreter, Mayer, Pelzmann, Kamp, Ebeling, Bremser, Davis and Strunk24 Bandić et al.Reference Bandić, McGill and Ikonić25) proposed a type I QW model using the wurtzite material as a matrix to embed the cubic insertion. The transition from the QW ground state of the conduction band to the valence band results in a transition energy of 3.41 eV. This simple model works fine for the I1 type defect, but fails for the other defects, since the increase in thickness necessary to explain the shift of the related emission bands, is too high.Reference Tischer, Feneberg, Schirra, Yacoub, Sauer, Thonke, Wunderer, Scholz, Dieterle, Müller and Gerthsen26
The basic model was supplemented by Sun et al.,Reference Sun, Brandt, Jahn, Liu, Trampert, Cronenberg, Dhar and Ploog27 Skromme et al.,Reference Skromme, Chen, Mikhov, Yamane, Aoki and DiSalvo28 and Liu et al. Reference Liu, Bell, Ponce, Chen, Yang and Khan29 These authors take into account the spontaneous polarization across the wurtzite/zinkblende GaN interface. The resulting electrical field tilts the band structure in the QW lowering the transition energy. Applying this model, the transition energy at the I1 and the I2 BSF could be calculated in rather good agreement. Still, a type I band alignment was assumed.
Lähnemann et al.Reference Lähnemann, Brandt, Jahn, Pfüller, Roder, Dogan, Grosse, Belabbes, Bechstedt, Trampert and Geelhaar30,Reference Lähnemann, Jahn, Brandt, Flissikowski, Dogan and Grahn31 report about their different approach to model the electronic structure. They alternatively used a type I or a type II band alignment for calculations, which both yield transition energies compatible with the experimental results on GaN nanorods with high BSF densities, which did not allow for clear separation of I1 and other types of BSFs. From the energy shift between the different defect types, the authors are able to calculate the spontaneous polarization of the GaN material applying a simple capacitor model.Reference Lähnemann, Jahn, Brandt, Flissikowski, Dogan and Grahn31 Additionally, a possible coupling of the closely neighboring BSFs is reported to further decrease the emission energies in areas with high basal plane defect densities.Reference Lähnemann, Jahn, Brandt, Flissikowski, Dogan and Grahn31
Our model is a similar approach. The discontinuity in polarization at the interface between wurtzite and cubic material results in charges on the interface plane. Our model assumes an exponential decrease of the locally induced changes of the band energies in the QW barriers with the characteristic length being the (doping dependent) Debye length. For the calculations, an unintentional background doping level of 1017/cm−3 was assumed,Reference Jacopin, Rigutti, Largeau, Fortuna, Furtmayr, Julien, Eickhoff and Tchernycheva32 resulting in a Debye length of 2.1 nm. The band offset is distributed in such a way, that 70% occur in the conduction band (upper red curve in Fig. 1), and 30% in the valence band (lower red curve), as suggested by Piprek and Nakamura.Reference Piprek and Nakamura33 The calculations were performed employing the matrix method of Van der Maelen Urìa et al.Reference Van der Maelen Uría, García-Granda and Menéndez-Velázquez34 assuming fully relaxed material. The model was calibrated using the transition energy of 3.41 eV for the I1 BSFReference Liu, Bell, Ponce, Chen, Yang and Khan29 which results in an effective thickness of the defect of 1.1 c lattice constants of wurtzite GaN.
Conduction band (upper red curve) and valence band (lower red curve) structure of I1 BSF: ground state wave functions (solid blue) and energy (dashed blue).

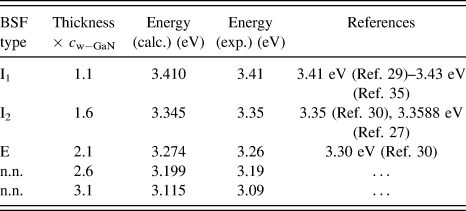
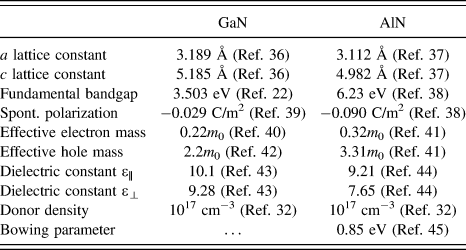
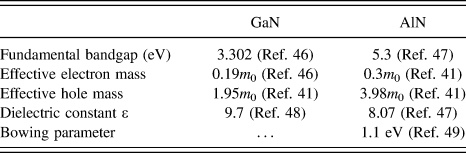
The simulation results together with the experimental emission energies and references are summarized in Table I. The parameters used for the simulation are listed in Table II for the wurtzite, and in Table III for the cubic material, respectively.
Calculated emission energies and corresponding references. The experimental values are explained in the next sections. The yet unknown defect related bands (n.n.), presumably BSFs, were found experimentally (see below) and therefore added to the table.
Material parameters for wurtzite GaN and AlN. Electron mass is referenced as m 0.
Material constants for cubic GaN and AlN. Electron mass is referenced as m 0.
III. EXPERIMENTAL
A. Sample structure
All experimental results presented here were obtained from a similar type of samples, grown by metal organic vapor phase epitaxy. On a sapphire substrate first a c oriented GaN template was grown and a SiO2 layer was evaporated subsequently. This cover was structured lithographically resulting in open stripes aligned along the GaN  $\left[ {11\bar 20} \right]$ direction with an opening of 3 μm and a period of 20 μm. On this masked substrate, selective area growth of GaN was performed using the lateral overgrowth mechanism to achieve semipolar side facets. This approach results in a reduced density of dislocations by bending them into horizontal direction.Reference Wunderer, Hertkorn, Lipski, Brückner, Feneberg, Schirra, Thonke, Knoke, Meissner, Chuvilin, Kaiser and Scholz50 The sample consists of stripes with naturally stable semipolar
 $\left\{ {10\bar 11} \right\}$ side facets and a triangular cross section as sketched in Fig. 2. Details of the growth process can be found elsewhere.Reference Wunderer, Hertkorn, Lipski, Brückner, Feneberg, Schirra, Thonke, Knoke, Meissner, Chuvilin, Kaiser and Scholz50
Sketch of sample structure. Between the stripes, the SiO2 mask is visible. The crystal directions are indicated by the arrows. The (green) side facets are  $\left\{ {10\bar 11} \right\}$ planes, the cross sections (red) are
 $\left\{ {11\bar 20} \right\}$ planes.
Three different samples were investigated. Sample No. 1 does not have any additional layers and no intentional doping. On sample No. 2, a thin layer of AlGaN with a nominal Al content of 5 and a thickness of approximately 200 nm was deposited. Sample No. 3 is a full LED structure, for which the GaN stripe buffer is n-doped. A 3-fold InGaN/GaN QW, an AlGaN electron blocking layer (EBL), and a final p-doped GaN layer were grown on the side facets. On both the p- and the n-side ohmic contacts were created and wire bonded.
For optical investigation, the samples were cleaved mechanically to get access to the stripes' cross sections.
B. Experimental setups
All cathodoluminescence (CL) investigations were performed in a LEO DSM 982 scanning electron microscope (SEM; Carl Zeiss AG, Oberkochen, Germany) equipped with a 100 μm thin diameter ultraviolet enhanced glass fiber for light collection. The fiber tip is placed on the sample surface close to the region of interest without negatively influencing the SEM picture quality. The collected light can be led to several detection systems. For recording highly resolved spectra, a liquid nitrogen cooled charge coupled device camera connected to a 90 cm focal length monochromator is used. Alternatively, the luminescence intensity can be detected with a photomultiplier tube and recorded simultaneously with the SEM micrographs for a direct correlation between the excitation spot and the CL intensity. These maps can be recorded either panchromatic or spectrally resolved using a 25 cm focal length monochromator. The sample is mounted on the cold finger of a helium cooled cryostat. This allows to cover the temperature range between 4 and 475 K.
The same SEM setup can be equipped with a detection system for electron beam induced current (EBIC). The current amplifier is installed inside the SEM chamber to avoid signal distortion from the environment. The signal cables can be kept short resulting in very low parasitic capacitance of the device. Together with surface mounted devices and a small form factor printed circuit board a reliable signal to noise ratio is achieved. The amplified EBIC signal is again recorded simultaneously with the SEM detector signal, which allows to spatially correlate the EBIC signal. Low temperature combined spatially correlated EBIC and CL measurements are discussed elsewhere.Reference Knab, Hocker, Felser, Tischer, Wang, Scholz and Thonke51
The transmission electron microscopy (TEM) investigations were performed using two different TEM types. A Philips CM 20 TEM (Koninklijke Philips N.V., Eindhoven, The Netherlands) was used to investigate the LED sample. The other two samples were characterized with aberration corrected FEI TitanReference Nakamura, Senoh, Iwasa and Nagahama3 TEMs in scanning mode [scanning transmission electron microscopy (STEM)] (FEI, Eindhoven, The Netherlands). All TEM lamella preparations were done by focused ion beam (FIB), with a protective platinum layer evaporated on the sample top surface to prevent the area of interest to be etched. These FIB cuts were performed at those sample areas, where CL investigations were completed before. This allows a direct correlation of spectral (from CL), electrical (partly from EBIC), and structural (from TEM) properties.
For high resolution X-ray diffraction (XRD) measurement, a Bruker D8 system (Bruker Corporation, Billerica, Massachusetts) was used. Reciprocal space maps of asymmetric  $\left( {11\bar 24} \right)$ and
 $\left( {1\bar 106} \right)$ reflexes were recorded. Thus, changes in lattice parameters can be investigated separately for directions parallel and perpendicular to the stripes.
C. BSF in semipolar GaN
Figure 3(b) shows the spectrum recorded on the triangular cross section of sample No. 1 (see SEM micrograph). The blue markers denote the spectral ranges, over which the maps were recorded. The spatial distributions (Figure 3(a)) of the selected wave length ranges differ strongly. Therefore, none of the peaks are just phonon replica of others.
(a) CL intensity maps as overlay on the corresponding SEM micrograph. Donor bound exciton of relaxed GaN at 3.47 eV, BSF I1 at 3.41 eV,Reference Liu, Bell, Ponce, Chen, Yang and Khan29 BSF I2 at 3.32 eV,Reference Tischer, Feneberg, Schirra, Yacoub, Sauer, Thonke, Wunderer, Scholz, Dieterle, Müller and Gerthsen26,Reference Tischer, Feneberg, Schirra, Yacoub, Sauer, Thonke, Wunderer, Scholz, Dieterle, Müller and Gerthsen52 and two other strongly localized defect related bands at 3.20 and 3.16 eV. SEM electron energy 2 keV, temperature 10 K. (b) In the integral spectrum, the spectral range of each map is marked in blue color (2 keV primary electron energy, temperature 10 K).
The band at 3.41 eV is assigned to the BSF, I1,Reference Liu, Bell, Ponce, Chen, Yang and Khan29 since it is aligned perpendicular to the (0001) direction. All other defect related contributions are localized close to the side facet surface, and no contributions from inner parts of the stripe can be detected. This allows to perform a measurement on a side facet to increase the spatial resolution and to clarify the extension of the defects. Figure 4(a) shows the exemplary CL intensity map of the emission around 3.33 eV. The band which shows a dot like pattern on the cross section continues on the side facet as a series of horizontal lines. The same behavior can be observed for all other contributions (not shown here, details see elsewhereReference Tischer, Feneberg, Schirra, Yacoub, Sauer, Thonke, Wunderer, Scholz, Dieterle, Müller and Gerthsen52).
(a) CL intensity map of the side facet at 3.33 eV. (b) Exemplary high resolution STEM micrograph of one of the two isolated defects at the position marked by the black double arrow. (c) Comparison of CL intensity profile taken from the positions marked by the white rectangle (red, lower curve) with the artificially broadened BSF positions (black crosses) created from the TEM micrographs (blue, upper curve) (2 keV primary electron energy, temperature 10 K).
The exact defect type was determined by TEM. A thin lamella was cut out of the stripe region where the side facet investigations were performed at. The cut was made perpendicularly to the stripe allowing high resolution STEM on the very same area. The positions of all BSFs in this region were recorded [black crosses in Fig. 4(c)]. For comparison with the CL data, we used a Gaussian shape line with a full width at half maximum (FWHM) of 175 nm at each BSF position to model the diameter of the electron beam excitation volume, and to account for the exciton diffusion. Summing up these Gaussians as a function of the distance of the defects from the bottom corner of the structure, a TEM based BSF profile [blue upper curve in Fig. 4(c)] can be plotted and compared to CL profiles of the different defect bands. The profile for the 3.32 eV band is plotted in red (bottom curve). This CL profile can be obtained from the maps [see white rectangle in Fig. 4(a)]. Slightly below a distance of 4 μm from the bottom edge (see mark by double arrow), two isolated BFSs with an emission band at 3.33 eV can be observed. The slight shift as compared to the position found in the cross section is caused by a modified strain situation after mechanical sample cleaving. The high resolution STEM micrograph in Figure 4(b) shows one of these BSFs exemplarily. Both defects exhibit the stacking sequence characteristic for the I2 type BSF as marked by colored dots. By virtue of this direct correlation, the emission band at 3.33 eV can be assigned unambiguously to the I2 BSF.Reference Tischer, Feneberg, Schirra, Yacoub, Sauer, Thonke, Wunderer, Scholz, Dieterle, Müller and Gerthsen26
As mentioned above, several papers report this defect to cause the emission around 3.35 eV, which contradicts our findings. Within the QW model for the BSF, energy shifts due to strain have to be taken into account. We developed a model of the strain situation of the GaN stripe applying a 2D plane stress finite element (FE) simulation assuming linear elastic anisotropic material. Biaxial compressive strain in the substrate below was found in earlier CL investigations (not shown here). In our FE model, this strain was applied to the base of the stripe inside the mask opening. The result is plotted in Fig. 5. A thin layer with normal tensile strain in both the  $\left( {1\bar 100} \right)$ and the (0001) direction is found on the sample surface in the bottom third of the side facet.
Simulated normal strain on the cross section and surface of the GaN stripe grown by selective epitaxy over a mask opening. For the substrate, a biaxial compressive strain is known from earlier investigations (not shown here). This planar strain is applied through the mask opening to the stripe (strain contrasts at the bottom). A thin layer with tensile strain can be observed in the bottom third of the side facet.
CL spectra from this area show an emission from donor bound excitons (D0X) shifted from the relaxed value of 3.47 eV down by 30 meV to 3.44 eV. If we add this shift to the 3.32 eV emission energy we found for the I2 BSF, we end up at an energy of 3.35 eV. This value is in accordance with our model calculation, and is also in good agreement with the values reported in literature.Reference Sun, Brandt, Jahn, Liu, Trampert, Cronenberg, Dhar and Ploog27,Reference Lähnemann, Brandt, Jahn, Pfüller, Roder, Dogan, Grosse, Belabbes, Bechstedt, Trampert and Geelhaar30,Reference Lähnemann, Jahn, Brandt, Flissikowski, Dogan and Grahn31 Experimental values given in Table I were all corrected (added 30 meV) according to the strain situation determined from the spectral position of the shifted donor bound exciton band at the same sample position.
D. BSF in semipolar AlGaN with low Al content
The results presented above are now applied to an AlGaN layer deposited on the GaN stripes' side facets (sample No. 2).Reference Tischer, Frey, Hocker, Jerg, Madel, Neuschl, Thonke, Leute, Scholz, Groiss, Müller and Gerthsen53 Here, the CL data analysis is more difficult, since a lower energy emission can be caused by defects, by strain, by lower aluminum content, or by any combination of these. Therefore, the absolute spectral position of the possible defect related emission does not provide sufficient information. Instead, the energy shift relative to the emission band from donor bound excitons yields the required details, since the D0X emission energy is governed by the strain as well as by the aluminum content. The anisotropic strain behavior visible in the FE simulations (see Fig. 5) was confirmed experimentally by XRD investigations for both the GaN buffer and the AlGaN layer as shown in Fig. 6. Although the XRD signal was recorded averaging over a big number of stripes, the reflexes represent the different lattice constants of the biaxial compressively strained substrate material, the GaN stripes, and the AlGaN layer, respectively. The local variation inside each layer results in a broadening of the corresponding XRD peak. The lattice constant of the AlGaN layer should be smaller than the GaN layer constant due to the Al incorporation. Thus, different regions and layers can be assigned to their corresponding signals in the XRD graphs despite the averaging over several stripes. These graphs show that the lattice constant perpendicular to the  $\left( {11\bar 20} \right)$ stripe direction [i.e., along the m direction, see Fig. 6(a)] differs from the respective values for the substrate increasingly from the buffer to the topmost AlGaN layer, whereas the lattice constant parallel to the stripe [i.e., a direction, see Fig. 6(b)] remains unchanged. These findings are in full agreement with the averaged values found in the FE strain calculations. The XRD setup used does not resolve local changes along the vertical direction. Thus, the absolute values on the axes in Fig. 6 cannot be used as strain input in the model calculations for the BSF QW model.
XRD reciprocal space maps of the  $\left\{ {1\bar 106} \right\}$ (a) and the
 $\left\{ {11\bar 24} \right\}$ (b) reflexes. The vertical axis is the reciprocal (0001) direction. The horizontal axes represent the reciprocal lattice constants perpendicular (a) and parallel (b) to the
 $\left( {11\bar 20} \right)$ direction along the stripes. Along the stripes, the a lattice constant is matched for the different layers, which is not the case perpendicular to the stripe direction, where the m lattice constant changes.
For identification of SFs in the AlGaN layer, a similar approach as described above was chosen. The SEM-CL investigations on the AlGaN were performed at the very same stripe both in cross section and side facet view. Instead of addressing just the positions of the prominent peaks in the spectra, series of monochromatic CL maps within the spectral region of interest were recorded. The SEM micrographs were stored simultaneously allowing to spatially correlate the recorded CL maps accordingly to correct any shifts in SEM operation. This is necessary because of broad emission band containing the superimposed defect related CL contributions in the low energy tail. Thus, most of the defects do not provide a prominent peak position to record a CL map at. The corresponding TEM lamella again was prepared from the back side of the cross section to allow a perfect correlation of spatial distribution of the luminescence bands with their structural counterpart.
Figure 7(c) shows the integral spectrum recorded from the cross section of a single stripe of sample No. 2 as shown in the SEM micrograph. Several relatively broad contributions above the GaN fundamental band gap of 3.504 eV at low temperature are visible.Reference Monemar22Figure 7(b) shows the color coded emission energy distribution. All luminescence comes from the top AlGaN layer only, while the GaN buffer below does not contribute. As known from energy dispersive X-ray (EDX) measurements (not shown here), the AlGaN layer thickness corresponds exactly to the region where the CL signal emerges.
SEM micrograph (a) and color coded emission energy map (b) of a cross section. The luminescence is created in the AlGaN layer only, while the GaN buffer does not contribute. The emission shows a blue shift from bottom to top. In the bottom half, localized defects with lower emission energies as compared to the AlGaN matrix are clearly resolved (white arrows). (c) CL spectrum from the integral cross section area of sample No. 2 shown in SEM micrograph (5 keV primary electron energy, temperature 10 K).
The luminescence shows a clear blue shift from bottom to top as indicated by the thick arrow in the map in Fig. 7(b). This is caused by the three-dimensional growth mode, where the precursors are offered from top. Aluminum has a smaller surface diffusion length and arrives with higher concentration from the gas phase at the ridge, while the more mobile gallium evaporates at the edges. This results in a higher incorporation rate of Al close to the tip.Reference Narita, Honda, Yamaguchi and Sawaki54
In the lower half, some strongly pronounced spots with a lower emission-energy as the surrounding AlGaN matrix are visible (white arrows). This dot-like pattern is the first indication for defects. Since luminescence is emitted by the AlGaN layer only while the GaN buffer remains dark, the AlGaN layer emission can be investigated by exciting it directly without being perturbed by luminescence from the buffer.
Figure 8(a) shows the SEM micrograph of the bottom part of the side facet, and Figure 8(b) is the corresponding energy color coded luminescence distribution map. Again, a stripe pattern similar to the one described above for the pure GaN material can be observed. Obviously, this pattern is caused by SFs in AlGaN.
SEM micrograph (a) and color coded emission energy map (b) of lower half of the side facet. The cross section on Fig. 7 can be seen on the right corner of the SEM micrograph. The emission distribution shows a line pattern with clearly red shifted horizontally aligned stripes surrounded by a more homogeneous matrix. (c) Comparison of the intensity profiles of the donor bound exciton band at 3.50 eV (black), the defect bands at 3.42 eV (red) and 3.33 eV (green) with the TEM BSF profile (blue). These profiles were created by averaging horizontally (5 keV primary electron energy, temperature 10 K).
The main problem for a clear assignment of the CL bands to a specific defect type is the inhomogeneous Al content. The energy shift between the defect itself and the emission from donor bound excitons in the surrounding defect-free material alone does not allow a clear assignment. We applied here the same approach as for pure GaN: from the backside of the cross section a lamella for TEM investigation was prepared by FIB. Again, the distribution of BSF was determined in the TEM micrograph, and a Gaussian (FWHM 175 nm) was applied to the histogram of BSF positions. The resulting TEM BSF profile in Fig. 8(c) (blue curve) allows to compare the CL and the defect distributions as a function of their distance from the bottom.
The black curve (3.50 eV) shows the emission from the donor bound excitons of high quality AlGaN with an Al content of approximately 2%. At the defect at around 1.5 μm distance from the bottom, there is a clear anticorrelation of the donor-related signal to the defect position marked by the two black arrows. At the same sample area, the emission band at 3.42 eV (red curve) shows clear positive correlation with the defect (red arrow), so that the latter band can be clearly assigned to this isolated BSF. The type of this BSF was determined again by high resolution STEM. Figure 9 shows the STEM micrograph, from which we determine the stacking sequence characteristic for the I1 type BSF. Its emission is in this case red shifted by 80 meV relatively to the donor bound exciton emission energy of the surrounding AlGaN material.
High resolution STEM micrograph of the defect at 1.5 μm. The colored letters indicate the stacking sequence, the red arrow the I1 type BSF itself.
A similar analysis can be done in principle for the band at 3.33 eV. But due to the high density of defects, no clear correlation to TEM results could be established in this case. However, the emission has to be BSF related, since no other defects besides dislocations and BSFs were found in TEM. Assuming the same Al content of the high quality AlGaN in the direct vicinity as used for the I1 type BSF before, an energy shift of 170 meV from the AlGaN donor bound exciton emission energy can be calculated for the 3.33 eV band.
These two defect bands again can be compared to simulation results, calculated with the QW model described above for the BSFs. Vegard's lawReference Vegard55 was used to interpolate the lattice parameters etc. for AlGaN from the constants for pure GaN and pure AlN. For the fundamental band gap, the bowing parameter b = 0.85 eVReference Neuschl, Helbing, Knab, Lauer, Madel, Thonke, Meisch, Forghani, Scholz and Feneberg45 was used. This approximation is valid since the Г9 valence band is the topmost valence band for these low aluminum concentrations.Reference Neuschl, Helbing, Knab, Lauer, Madel, Thonke, Meisch, Forghani, Scholz and Feneberg45 The QW model was calibrated with the defect at 3.42 eV for the given Al content, assuming fully relaxed material without any strain. This results in a nominal active thickness of the I1 type BSF of 1.2 lattice constants of wurtzite AlGaN. Table IV summarizes the calculated and the experimental results.
Calculated emission energies and corresponding experimental values. c AlGaN is the calculated c lattice constant of AlGaN for the given Al content of 2%.

The calculated and the measured values for the presumable I2 type BSF differ by 20 meV. A possible explanation for this behavior could be a reduced Al content inside the cubic BSF insertion. This results in a deeper well and therefore in a larger red shift. Unfortunately, this could not be confirmed by TEM-EDX due to the very low Al content close to or below the detection limit. However, if this explanation is taken into consideration, a big impact of BSF on the homogeneity of the Al content in semipolar AlGaN layers is expected. Some more details about this investigation can be found elsewhere.Reference Tischer, Frey, Hocker, Jerg, Madel, Neuschl, Thonke, Leute, Scholz, Groiss, Müller and Gerthsen53
E. Defects in a semipolar AlGaN EBL
The EBL of an LED structure is used to confine the charge carriers inside the active region, where the QWs are localized. For a detailed investigation of the optical and structural properties of defects inside a semipolar LED structure, sample No. 3, taken from a very early stage of optimization, was selected. This sample shows a relatively high leakage current in I(V) measurements (not shown here), and it exhibits a low electroluminescence efficiency.
On the same sample region, both spatially resolved panchromatic SEM-CL and SEM-EBIC measurements were performed. The results are presented in Fig. 10. The CL and EBIC maps are strongly inhomogeneous. But there are only few spots (red and green circles in Fig. 10) with direct (anti) correlation of CL and EBIC distributions.
Topview SEM, panchromatic SEM-CL, and SEM-EBIC micrographs of the LED sample No. 3. The red circles mark points of interest, where inhomogeneities are visible in both CL and EBIC distributions. The green circle indicates an anticorrelation of EBIC and CL signal at the stripe top (9 keV primary electron energy at room temperature).
The CL emission is dominated by the QWs. If the CL signal at some spot is weaker than at the surrounding material, the QWs might be defective. If the EBIC signal is less intense as well, it can be concluded that defects in this area affect both the wells and the pn junction. In this case, a defect penetrating through the whole structure is expected.
If the CL signal is weaker, but the EBIC signal remains the same, then just the QWs suffer from defects and vice versa.
The most interesting observation is that there are localized spots, where the EBIC signal is stronger than in the surrounding material. It makes no sense to assume an even better pn junction, but instead it seems to be easier for the current to reach the contacts. Since the CL signal at these spots does not show any specific changes, changes of the QW properties can be ruled out as reason. Thus, the EBL is the only remaining part which can cause this phenomenon.
To check this idea, TEM investigations of the EBL were carried out on a lamella prepared by FIB. Figure 11(a) shows a TEM micrograph of the EBL and the topmost QW (light green arrow). The light gray contrast shows the presence of AlGaN. At the position denoted by the red arrow, the EBL is interrupted, and a much lower Al content is found. In TEM, many of these defect structures were found. Figure 11(b) is one of those structures in higher magnification. The red dashed lines indicate the position of the AlGaN EBL. There are two distinct structures, denoted by the blue and the yellow rectangle. The stacking sequence inside the blue one is clearly hexagonal, while inside the yellow one, the aligned diagonal structures merely look cubic. For clarification, the local fast Fourier transform pattern (FFT) of these two areas was recorded and compared with simulations for zincblende and wurtzite material. The results are shown in Fig. 12. The upper row contains the calculated patterns, the lower row shows the experimental ones. The left column is the cubic material; the hexagonal one is on the right. It can be seen clearly, that the calculation and measurement coincide well. The main differences between cubic and hexagonal pattern are marked by the red circles. Moreover, that the reflex found inside the circles for the hexagonal material vanishes for the cubic confirming the existence of a cubic insertion inside the wurtzite matrix.
(a) TEM micrograph of the interrupted EBL (red arrow) and the topmost InGaN QW (light green arrow). (b) High resolution TEM picture of a cubic insertion (yellow rectangle) in a wurtzite matrix, causing the EBL to be interrupted by a modified Al content. The red dashed lines show the EBL position.
Simulated (top row) and measured (bottom row) local FFT pattern of cubic (left column) and hexagonal (right column) AlGaN calculated from the high resolution TEM micrograph [Fig. 11(b)] from the regions highlighted by colored rectangles. The  $\left\{ {1\bar 100} \right\}$ reflex is absent in the cubic case.
In the direct vicinity of this cubic insertion, the Al content is altered strongly, resulting in the interrupted EBL mentioned already. Thus, the higher leakage currents can be explained by a defective, interrupted semipolar EBL. The bad electroluminescence performance of this LED structure is caused by a combination of the reduced charge carrier confinement due to the interrupted EBL and of defective parts of the QW structure, where the QW material quality is worse.
IV. SUMMARY AND CONCLUSIONS
In this paper, we present a modified standard model describing the optical properties of BSF as cubic QWs embedded in a wurtzite matrix. In principle, this model can be extended to include the influence of strain. But although we found evidence for an anisotropic strain behavior of the GaN structure created by selective area growth, we cannot provide absolute values for the actual strain from the spectroscopic data. With this model it is possible to calculate the emission energies from different types of BSFs and to confirm these values with a combination of highly spatially and spectrally resolved SEM-CL investigations together with high resolution TEM images, recorded at the same sample region. This combination allows to unambiguously assign the band red shifted by 120 meV from its corresponding donor bound exciton to a I2 type BSF. Some other emission bands can be tentatively assigned to BSFs with thicker cubic layers.
Applying the same model to a semipolar AlGaN layer with low Al content, we could assign an emission band red shifted by 80 meV from the surrounding emission of donor bound excitons to I1 type BSF. This was proven experimentally using the same technique as described above. For the tentatively assigned I2 type BSF we found an emission energy less red shifted than expected. This finding can be explained by a lower Al content in the cubic material resulting in a deeper QW. We ascribe the modification of the Al content to the presence of the BSFs.
Evidence for this assumption was also found in combined SEM-CL, SEM-EBIC, and TEM investigations of a semipolar LED structure with an EBL close to the InGaN/GaN QWs. Interruptions of the EBL with extremely low Al content were found close to cubic insertions. From this result, a possible negative influence of the BSFs and any other cubic insertion on the homogeneity of the Al content in semipolar wurtzite AlGaN layers can be concluded. This result has a strong impact on any structures, where AlGaN layers are used to confine charge carriers.
ACKNOWLEDGMENTS
The author thanks A. Eifert, G. Neusser, and C. Kranz from FIB Center at University of Ulm for their supporting SEM-EDX/FIB investigations. Parts of this work have been financially supported by the Deutsche Forschungsgemeinschaft within the transregional research group “PolarCoN”. Further financial support by the German Federal Ministry of Education and Research (BMBF) within the framework of the “Deep UV-LED” project is gratefully acknowledged. Parts of this work received funding from the European Union's Seventh Framework Program within the research project “ALIGHT”. H.G. acknowledges funding by the Austrian Science Fund (FWF): J3317-N27.