





As a trait predictive of many important educational, occupational, economic, health, and social outcomes (Gottfredson, Reference Gottfredson1997; Neisser et al., Reference Neisser, Boodoo, Bouchard, Boykin, Brody, Ceci, Halpern, Loehlin, Perloff, Sternberg and Urbina1996), it is not surprising that intelligence remains one of psychology’s most researched — and debated — constructs (Schlinger, Reference Schlinger2003). Intelligence measures, such as IQ scores, are predictive of school grades (Cronbach & Snow, Reference Cronbach and Snow1977), academic attainment (Herrnstein & Murray, Reference Herrnstein and Murray1997) job performance (Hunter, Reference Hunter, Landy, Zedeck and Cleveland2017), and social status (Bates et al., Reference Bates, Hansell, Martin and Wright2016; Jencks, Reference Jencks1979). Individuals with higher IQ scores are more inclined towards a professional occupation, make healthier lifestyle and dietary choices, live longer (Deary, Reference Deary2013), exhibit higher self-regulation (Duckworth et al., Reference Duckworth, Peterson, Matthews and Kelly2007; Duckworth & Seligman, Reference Duckworth and Seligman2005), and are facially more attractive (Zebrowitz et al., Reference Zebrowitz, Hall, Murphy and Rhodes2002). In contrast, IQ scores are negatively associated with juvenile crime (Schwartz et al., Reference Schwartz, Savolainen, Aaltonen, Merikukka, Paananen and Gissler2015), malnutrition (Pollitt et al., Reference Pollitt, Gorman, Engle, Martorell and Rivera1993), and stress (McEwen, Reference McEwen2000).
With age, intelligence changes, but in different ways depending on the dimension of intelligence in question. Fluid-intelligence (the capacity to solve novel problems) declines with age (McArdle et al., Reference McArdle, Ferrer-Caja, Hamagami and Woodcock2002) while crystallized-intelligence (the ability to use skills, knowledge and experience) increases with age. On changes to the heritability of intelligence with age, it increases from 20% to 80% from infancy to adulthood, where it asymptotes at age 20 (Bouchard, Reference Bouchard2013; Haworth et al., Reference Haworth, Wright, Luciano, Martin, De Geus, Van Beijsterveldt, Bartels, Posthuma, Boomsma, Davis, Kovas, Corley, DeFries, Hewitt, Olson, Rhea, Wadsworth, Iacono, McGue and Plomin2010). However, then declines again in older age, i.e. after age 60, for verbal and spatial ability, but not for working memory or executive function (Reynolds & Finkel, Reference Reynolds and Finkel2015).
Given the significance of IQ on life outcomes, and the documented differences in IQ both within and across groups, it is not surprising the topic has fueled debate within the academic community and society at large (Schlinger, Reference Schlinger2003). Primarily, these debates have revolved around defining and measuring theoretical views of intelligence, and explaining the observed differences in intelligence in terms of nature (genetics) and nurture (environment).
Defining and Measuring Intelligence
Attempts at quantifying the human trait of intelligence can be traced back to Sir Francis Galton (Galton, Reference Galton2005). During the 20th century a range of theories and definitions of intelligence emerged (Schlinger, Reference Schlinger2003). A collection of 35 psychological definitions of intelligence by Legg and Hunter (Reference Legg and Hutter2007) testify this. Examples include: Piaget’s (Piaget, Reference Piaget1971) developmentally based intelligence, Cattell’s (Reference Cattell1971) crystalized and fluid intelligences, and Gardner (Reference Gardner1999) and Sternberg’s (Sternberg, Reference Sternberg1999) multiple intelligences. The most widely accepted definition of intelligence, however, supported by most of the intelligence literature (Schneider & Flanagan, Reference Schneider, Flanagan, Goldstein, Princiotta and Naglieri2015), and providing the foundation of research partitioning intelligence differences between nature and nurture (Plomin & Deary, Reference Plomin and Deary2015; Plomin & Petrill, Reference Plomin and Petrill1997) is the psychometric view. This view, espoused by Boring (Reference Boring, Jenkins and Paterson1961), states ‘intelligence is what intelligence tests test’.
In psychometric terms, intelligence is a general cognitive ability that can be tested and measured with the most reliable and valid psychological assessment available — the intelligence quotient (IQ) score (Gottfredson, Reference Gottfredson1997). This view of intelligence originated when Spearman (Reference Spearman1904) discovered that test scores on diverse cognitive abilities correlated around a common underlying factor, g. More recently, Panizzon et al. (Reference Panizzon, Vuoksimaa, Spoon, Jacobson, Lyons, Franz, Xian, Vasilopoulos and Kremen2014) employed a multivariate, genetically informed, twin design to test for g. Their results provided stronger support than prior studies that a model with an overarching latent g phenotype, as well as specific cognitive domains, outperformed competing models of intelligence. In addition, they estimated that this latent g was highly heritable (86%).
Explaining Observed Differences in Intelligence in Populations: Genetics and the Environment
Arguments over whether intelligence is innate or dependent upon experience originated with Plato and Aristotle, continued with John Locke and Galton (Leahey, Reference Leahey2015), and were reignited with the publication of The Bell Curve (Herrnstein & Murray, Reference Herrnstein and Murray1997) and its controversial claims that racial differences in intelligence are attributable to genetics. Research efforts aimed at accurately partitioning IQ variability in populations between environmental and genetic sources will not only help solve this ongoing debate. This will be important in fields such education that have been slow in accepting the importance of genes in explaining differences in educational attainment and IQ (Plomin & Walker, Reference Plomin and Walker2003).
In the early 1920s researchers employed twin and adoption studies to assess whether the variability in IQ was genetic or environmental (Merriman, Reference Merriman1924; State Charities Association, 1924). These studies lent support to both influences. Then Erlenmeyer-Kimling and Jarvik (Reference Erlenmeyer-Kimling and Jarvik1963) examined the correlations in IQ between 30,000 pairings of various familial relationships. They found the median of the empirical correlations in IQ closely approached the theoretical values predicted by additive genes alone. A later study by Bouchard and McGue (Reference Bouchard and McGue1981) combined most of the Erlenmeyer-Kimling and Jarvik (Reference Erlenmeyer-Kimling and Jarvik1963) data with an additional 59 studies to arrive at almost identical findings. Neither of these classic papers are recent, and this is precisely the point: more recent studies have done nothing to change the estimated contributions of genes and environment influence on the variability of IQ (Deary et al., Reference Deary, Johnson and Houlihan2009; Neisser et al., Reference Neisser, Boodoo, Bouchard, Boykin, Brody, Ceci, Halpern, Loehlin, Perloff, Sternberg and Urbina1996; Plomin & Deary, Reference Plomin and Deary2015; Polderman et al., Reference Polderman, Benyamin, De Leeuw, Sullivan, Van Bochoven, Visscher and Posthuma2015).
Behavioral Genetics
Behavioral genetics (BG) examines the nature of variation in measurable traits, such as IQ, among individuals in a population (Plomin et al., Reference Plomin, DeFries, Knopik and Neiderhiser2016). By utilizing twin, adoption, and family studies, the total variability of a trait (such as IQ) in a population (VP) is proportioned between the variability attributable to genetics (VG), common or shared environmental factors (VC), and nonshared environmental factors (VE) (Plomin, et al., Reference Plomin, DeFries, Knopik and Neiderhiser2016).
 ${\rm{V_P = V_G + V_C + V_E}}$
Like other descriptive statistics (such as mean, standard deviation, and correlation), the heritability statistic describes ‘what is’ in a population at a point in time, and may be limited by the samples, measures, and methods employed (Neale, 1992). Heritability does not refer to a single individual, but to variance in a population (Plomin & Petrill, Reference Plomin and Petrill1997).
The Classical Twin Design and IQ
As noted by Keller and Coventry (Reference Keller and Coventry2005), the most commonly used technique to infer genetic and environmental influences when explaining trait (IQ) variance is the classical twin design (CTD). Polderman et al. (Reference Polderman, Benyamin, De Leeuw, Sullivan, Van Bochoven, Visscher and Posthuma2015) used the CTD to assess heritability in IQ in a meta- analysis of fifty years of twin data across numerous traits. In their associated web site,
MaTCH (http://match.ctglab.nl) report that on average VG accounts for 51%, and VC accounts for 24% of the variance in IQ. This is in stark contrast with birth order, for instance, which accounts for less than 1% of IQ variance (Plomin & Petrill, Reference Plomin and Petrill1997).
Parameter Bias in the Classical Twin Design
Despite its extensive use, the CTD can produce biased estimates (Coventry & Keller, Reference Coventry and Keller2005; Keller & Coventry, Reference Keller and Coventry2005; Keller et al., Reference Keller, Medland and Duncan2010; Keller et al., Reference Keller, Medland, Duncan, Hatemi, Neale, Maes and Eaves2009; Plomin et al., Reference Plomin, DeFries, Knopik and Neiderhiser2016). These biases are the result of the simplifying, albeit unrealistic, assumptions: necessary because only correlations from monozygotic (MZ) (r MZ) and dizygotic (DZ) (r MZ) twin-pairs are employed in the CTD. Due to an algebraic constraint (see Keller & Coventry, Reference Keller and Coventry2005), the CTD is unable to simultaneously estimate nonadditive genetic effects (V NA) and V C, and must resort to estimating one or the other. The lack of spousal trait correlations (r PP) results in a disregard of assortative mating (individuals tending to reproduce with people like themselves) in the CTD. Further, due to the lack of parent-child trait correlations (r PC), the CTD is unable to disentangle V C from (a) the common-environmental effects that are shared between siblings and twins but not parents (V S), and (b) those that are transmitted from parents to offspring (V F). The latter is referred to as cultural or vertical transmission.
Keller and Coventry (Reference Keller and Coventry2005) quantified these biases and discussed several solutions, including using an extended twin-family design (ETFD). In a companion report, Coventry and Keller (Reference Coventry and Keller2005) empirically assessed the extent of the biases by contrasting parameter estimates obtained from seven ETFD studies against CTD parameter estimates obtained from the same datasets. Their study included 17 different phenotypes (but not IQ) and included nearly all ETFD papers published at that point in time. Their empirical results supported Keller and Coventry’s (Reference Keller and Coventry2005) predictions, that the CTD estimates were biased relative to those of the NTFD. On average CTD estimates of additive-genetic (V A) were 63% higher than the ETFD estimates (Coventry & Keller, Reference Coventry and Keller2005).
When researchers ignore assortative mating, it contributes significantly to CTD bias (van Leeuwen et al., Reference van Leeuwen, van Den Berg and Boomsma2008; Vinkhuyzen et al., Reference Vinkhuyzen, Van Der Sluis, Maes and Posthuma2012). Furthermore, correlations between spouses are greater for IQ (r = .35) than for any other behavioral trait (Keller et al., Reference Keller, Garver-Apgar, Wright, Martin, Corley, Stallings, Hewitt and Zietsch2013), injecting additive genetic variance in populations at every generation. The effects of this assortative mating is confounded with the effects of V C: Assortative mating tends to increase the genetic relationship between DZ twins above the expected .50 level, thereby mimicking the effects of V C (Keller & Coventry, Reference Keller and Coventry2005). Loehlin et al. (Reference Loehlin, Harden and Turkheimer2009), in a sensitivity analysis, concluded that failing to estimate assortative mating resulted in underestimating the effects of V A, and overestimating the effects V C on the US National Merit Qualifying Test Scores.
Other limiting assumptions of the CTD, and consequential biases, are addressed elsewhere in the literature. Several have been explored in depth and have been shown to not pose problems for interpreting findings (Keller & Coventry, Reference Keller and Coventry2005). For the issues documented above, however, the research has established a need to employ more accurate models. This study does this to overcome the nontrivial biases of the CTD.
Alternatives to the Classical Twin Design Employed in the Research of IQ
In an endeavor to address the limiting constraints and biases of the CTD, ETFDs such as the Nuclear Twin Family Design (NTFD), the Stealth Model, and the Cascade Model have been employed in BG research (Keller et al., Reference Keller, Medland, Duncan, Hatemi, Neale, Maes and Eaves2009). These alternate models incorporate more related pairs than just the MZ and DZ pairs of the CTD.
For instance, with the NTFD — used herein — including just two additional correlations, between parent pairs (r PP) and parent-child pairs (r PC), it is possible to simultaneous estimate V E and three of the following four parameters: VA, VNA, VS , and VF . It thus accommodates both assortative mating (VPP ) and vertical transmission.
A review of the literature revealed only a few BG studies employing these more complex models in examining IQ. Exactly two decades ago, Devlin et al. (Reference Devlin, Daniels and Roeder1997) ran a meta-analysis on combined data from 212 twin, sibling, and parent-child IQ correlations. Their research, except for four datasets, was comprised entirely of data used in a study published 36 years ago by Bouchard and McGue (Reference Bouchard and McGue1981). Devlin et al.’s important finding, which was remarkable because it was in direct contrast with the generally accepted paradigm of the time, was that the prenatal environment contributes significantly to similarity in IQ in twins (Bouchard & McGue, Reference Bouchard and McGue2003). Their results suggest far smaller heritability estimates than those obtained using the CTD. At the time of publication, the Devlin et al. meta-analysis highlighted the need for more sophisticated models in the analysis of the heritability of IQ. Two decades later, this study is the first meta-analysis to answer that call.
By expanding their dataset to include IQ data from relatives from multiple generations, the Netherlands Twins Register has provided an opportunity to examine the impact of assortative mating on heritability estimates. By using data from MZ and DZ twins, one of their siblings, and both parents, van Leeuwen et al. (Reference van Leeuwen, van Den Berg and Boomsma2008) estimated that VA accounted for 67% of variability in IQ in children, with an additional 9% of variability attributable to gene-environment interaction. Unfortunately, due to the limited sample size, their study lacked sufficient statistical power to detect any evidence of vertical transmission between generations (V F) or nonadditive genetic effects (V NA). Recognizing this fact, van Leeuwen et al. summoned future research to implement ETFDs with more data. A larger sample, such as this meta-analysis, has such potential.
In an extension of the initial dataset mentioned above, Vinkhuyzen et al. (Reference Vinkhuyzen, Van Der Sluis, Maes and Posthuma2012) overturned an earlier result from the Netherlands Twins Register. With a sample of 314 families from that register, variance of IQ was attributed to VA (44%), VNA (27%), VE (18%), and assortative mating (11%). Not only does this confirm the importance of assortative mating and nonadditive genetics to IQ, but it again highlights the significance of using larger samples and more sophisticated models when disentangling the sources of IQ variance.
In employing these more sophisticated models, these three studies (Devlin et al., Reference Devlin, Daniels and Roeder1997; van Leeuwen et al., Reference van Leeuwen, van Den Berg and Boomsma2008; Vinkhuyzen et al., Reference Vinkhuyzen, Van Der Sluis, Maes and Posthuma2012) provide clear evidence that the CTD fails to accurately estimate all causes of variation in IQ. In employing alternative ETFDs, the studies have captured significant maternal, assortative mating, and nonadditive genetic effects, while correcting estimates for additive-genetic and shared-environmental effects. This provides direct support for predictions, based on a simulation exercise, in Medland and Keller (Reference Medland and Keller2009).
Of all the possible ETFDs, the NTFD offers the most optimal trade-off between accuracy and simplicity (Keller et al., Reference Keller, Medland, Duncan, Hatemi, Neale, Maes and Eaves2009). To date, no publications have directly applied the NTFD to heritability estimates of IQ. There have been no ETFD meta-analyses since Devlin et al., (Reference Devlin, Daniels and Roeder1997), and ETFD studies in the most recent decade have been under-powered.
Present Study
The current study aimed to address several gaps in the literature. First, datasets containing relative pairs, as are required in the NTFD, are extremely rare in contrast to a plethora of CTD studies. The three studies above were the only published works found. This study employed an innovative approach, a meta-analysis, to combine data from various works to address this data constraint. The larger dataset also addressed the lack of power in the Netherland Twin Registry studies above. Further, based on previous evidence (Coventry & Keller, Reference Coventry and Keller2005; Keller & Coventry, Reference Keller and Coventry2005) employing the NTFD to examine IQ will result in less biased estimates than the CTD. In their meta-analysis, Polderman et al. (Reference Polderman, Benyamin, De Leeuw, Sullivan, Van Bochoven, Visscher and Posthuma2015) combine 170 such CTD studies to arrive at biased estimates. This study will correct that bias. Finally, this study is the first meta-analysis on the heritability of IQ to employ the NTFD in the 20 years since Devlin et al. (Reference Devlin, Daniels and Roeder1997).
There will be three research hypotheses. First, that the parameter estimate for VA under the NTFD will be smaller than in the CTD. Second, that the parameter estimate for VNA obtained under the NTFD will be greater than that under the CTD. Third, that using the NTFD to include variables for assortative mating, vertical transmission between parents and offspring (V F), and the covariation between genetic and shared environmental effects, will correct for the inflated estimate of the effects of shared environmental effects (V C) in the CTD.
Method
Literature Search
The electronic databases PsychINFO, ProQuest, and Google Scholar were searched for peer reviewed publications that reported coefficients of correlation in intelligence between MZ twins, DZ twins, parents and children, or spouses. To extend on previous review findings (Bouchard & McGue, Reference Bouchard and McGue1981), the search was limited to the years 1981−2017. The search was undertaken chronologically by publication date to avoid collecting the same data twice from different studies. The following search terms were employed: heritability and intelligence, assortative mating intelligence, familial resemblances in intelligence, extended twin family design and intelligence, nuclear twin family design and intelligence, parent-child and intelligence, and assortative mating and intelligence. IQ was interchanged with intelligence in each search. The abstracts, methods, and results sections of publications were reviewed. Details from publications meeting search requirements were collated in Excel.
Data
To reduce bias, correlation coefficients, rather than individual heritability estimates, were extracted from the publications. The Bouchard and McGue (Reference Bouchard and McGue1981) correlations, the primary data source in Devlin et al. (Reference Devlin, Daniels and Roeder1997), provided the foundation data set for this study. A recent meta-analysis (Polderman et al., Reference Polderman, Benyamin, De Leeuw, Sullivan, Van Bochoven, Visscher and Posthuma2015) and its associated web tool MaTCH, provided all the MZ and DZ correlations through to 2015. It incorporated 170 studies across 13 countries covering 50 years. An extensive search for parent-child correlations unveiled a large dataset in the Norwegian military records (Black et al., Reference Black, Devereux and Salvanes2009). Spousal correlations proved the most elusive to find in the published literature.
Correlations were not collected separately according to sex (i.e., DZ-female, DZ male, DZ-mixed, and so forth) as prior research indicated an absence of both maternal and sex effectsFootnote 1 in IQ correlations (Bouchard & McGue, Reference Bouchard and McGue1981, Reference Bouchard and McGue2003), and not all studies partitioned data on sex.
Data were only collected for correlations between relatives sharing a common living environment (i.e., did not include twins raised apart). As documented by Devlin et al. (Reference Devlin, Daniels and Roeder1997), studies that evaluate relatives raised apart produce notably larger IQ heritability estimates. Data was only extracted from studies when sample sizes were published.
Data File
The following information was collected from each study: year of publication, source of participants (essential to avoid duplication of data across studies), measure/s of intelligence, average age of participants, correlations and associated number of pairs, and a reference. Age of study participant has the potential to confound estimates as heritability of IQ has been shown to increase with age (Haworth et al., Reference Haworth, Wright, Luciano, Martin, De Geus, Van Beijsterveldt, Bartels, Posthuma, Boomsma, Davis, Kovas, Corley, DeFries, Hewitt, Olson, Rhea, Wadsworth, Iacono, McGue and Plomin2010).
Meta-Analytic Procedures
Our meta-analysis herein solved the issue of limited availability of NTFD data. Correlations from different studies for different relative pairs (i.e., MZ, DZ, parent-child, and spouse) were combined. Weighted averages were calculated by weighting each extracted correlation by the number of pairs from which it was calculated relative to the total number of all pairs for that category accumulated in this study. Correlations are equivalent to standardized covariances and are used in estimating the various parameters of interest. As per Keller et al. (Reference Keller, Medland, Duncan, Hatemi, Neale, Maes and Eaves2009), IQ variance in both the CTD and the NTFD were assumed to be the same for all relative classes.
Modeling the NTFD
The NTFD model used in this study was that developed by Keller et al. (Reference Keller, Medland, Duncan, Hatemi, Neale, Maes and Eaves2009). The NTFD estimates were derived using (a) Mx (Neale, Boker, Xie & Maes, Reference Neale, Boker, Xie and Maes1999) and (b) the script published by Keller et al. (Reference Keller, Medland and Duncan2010). The observed weighted average correlations (IQ correlations between MZ, DZ, parent-child and spouses) were the input data for the structural equation modelling program. Mx then used a maximum likelihood process to arrive at the estimated parameters, which we detail further down. This was achieved via an iterative process that progressively adjusts the estimated parameters to find the best fit between the correlations implied by the model and the actual correlations provided by the data. The parameter estimates are effect sizes that represent the proportional contributions of each effect to overall IQ variability.
The Estimated Parameters of the NTFD
The NTFD is able to simultaneously estimate V E and three of the following four parameters: VA, VNA, V S , and V F. In addition, it estimates assortative mating and the covariance between VA and V F, termed COVAF here forth. Assortative mating is fully determined by the covariation between parents, while COVAF will be discussed further down. The design can only estimate three of the four aforementioned parameters as there are only three informative covariances (MZs, DZs, and parent-child or PC). So, the NTFD is forced to assume one of these four sources of variance is zero. As occurred for the CTD, fixing one of these four parameters at zero results in biased estimates. However, first, the extent of this is far less than that of the CTD (Keller et al., Reference Keller, Medland and Duncan2010). Second, we only fix, at zero, the parameter from among the four that has the smallest value, to minimise the bias. By considering, in turn, the greatest extent of possible bias of each parameter, we can make a more educated guess on the likely range of values of each parameter. We do this by mapping the parameter space of possible values, as detailed — at least for the CTD — by Keller and Coventry (Reference Keller and Coventry2005), but the principle is the same. In short, we initially fit a model with V F = 0 but free the other parameters (i.e., VA, VNA and V S). While obviously, V F it at its minimum here, VA, VNA and V S are neither at their minimum or maximum (Keller et al., Reference Keller, Medland and Duncan2010). Second, we equate V S = 0 instead, and this estimates VNA at its maximum. Third, we equate VNA = 0, which estimates VA at its maximum. Finally, we equate VA = 0, which estimates V S and V F at their maximum. Collectively, the four models estimate each parameter at their minimum and maximum, giving a range of possible values for each. However, not all four models are equally plausible. For instance, the model with VA = 0 is highly improbable given phenotypes generally are explained by additive genes. But this model is useful for estimating both S and F at their maximum. If the variance explained by one or both of these parameters is slight, even in this implausible model, it suggests that their values would be equally slight in a more plausible model where we would be otherwise unable to know how much larger their parameter value should be. In short, by mapping the parameter space as outlined here, we minimize the bias in the estimated parameters.
In contrasting the NTFD and CTD, we regarded the former as the saturated modeling that included all parameters of interest, to the extent this was possible as detailed above. By contrast, we treated the CTD as a nested model within the NTFD by setting particular parameters to zero: specifically, those that could be estimated in the NTFD but not the CTD. In terms of the parameters we estimated in the CTD, the CTD can only estimate two of the three parameters: V A, VNA , V C, while V E is fully determined as occurred with the NTFD. We opted to estimate V A and V C in the CTD, for two reasons. We based this first on the convention of the 2.r MZ > r MZ, which suggested V C, > VNA , so VNA is the parameter best fixed at zero. Second, when we attempted to fit a model estimating V A, VNA , and V E, VNA came out negative, as anticipated, so we just report on the V A, V C, V E model instead. This nested CTD is estimated from the MZ and DZ correlations, while the NTFD uses these correlations and the parent-parent and parent-child correlations. Given the nature of the data used, this nested model is thus based on a different subset of data to that of the saturated model. We discuss the implications of this in the limitations.
Results
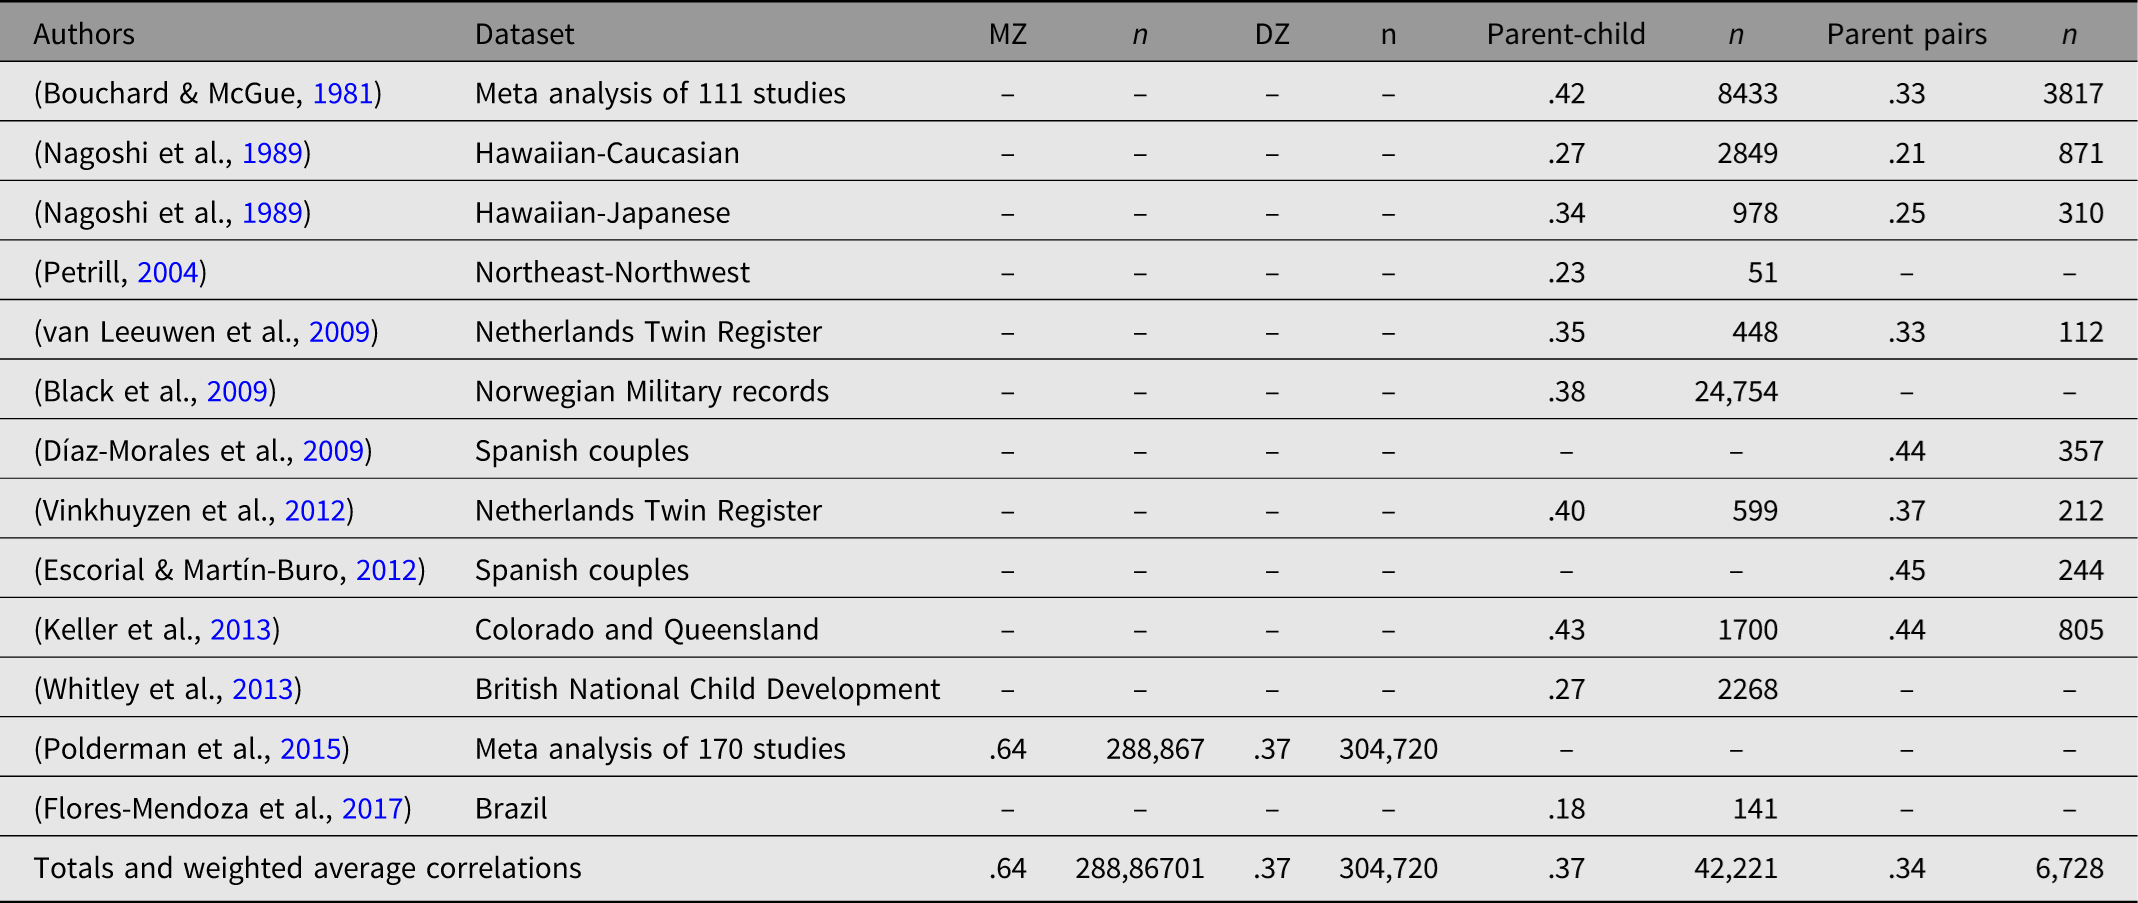
The literature search resulted in 13 studies that were eligible to be included in the meta- analysis. Table 1 provides a descriptive summary. Weighted average correlations were calculated for each relative pair used in the NTFD and CTD. The bottom row of Table 1 lists, for each pair category, these correlations alongside the number of pairs they were derived from, while the ranges are visible from the columns above that.
List of studies and correlations included in meta-analysis

Table 1. Long description
The table presents a summary of 13 studies included in a meta-analysis, detailing correlations for different relative pairs. It has 14 rows and 8 columns. The columns are labeled as Authors, Dataset, MZ, n, DZ, n, Parent-child, n, and Parent pairs, n. Each row lists the authors, dataset, and correlation values for different relative pairs. The bottom row provides weighted average correlations and the number of pairs for each category. The studies include various datasets such as Meta analysis of 111 studies, Hawaiian-Caucasian, Hawaiian-Japanese, Northeast-Northwest, Netherlands Twin Register, Norwegian Military records, Spanish couples, Colorado and Queensland, British National Child Development, Meta analysis of 170 studies, and Brazil. The table captures the correlations and the number of pairs analyzed in each study.
Note: MZ, monozygotic; DZ, dizygotic.
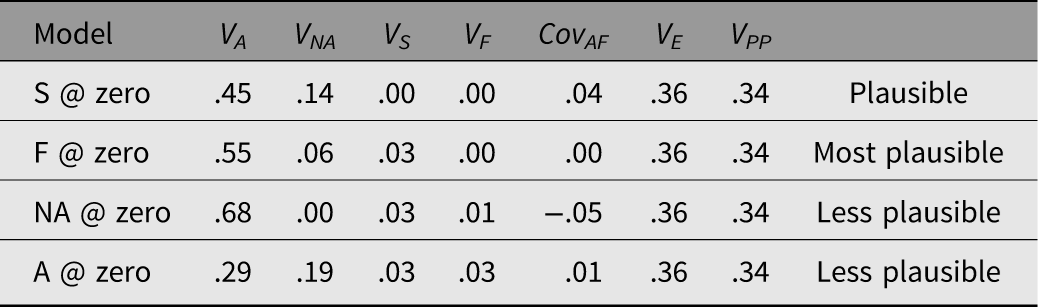
We first present the NTFD findings, and then later contrast them against the equivalent estimates of the CTD. We ran four NTFD models to understand the highest and lowest possible values of each parameter, with the results reported in Table 2. The sources of variance reported in Table 2 treat assortative mating as a source of covariance rather than as a source of variance. This means assortative mating is not included in the portions of variance that sum to 100% in Table 2. The remaining sources of variance (V A, VNA , V S, V F, CovAF , and V E) do sum to 100.
The four nuclear twin family design models run to estimate the portions of variance in IQ at their minimum and maximum values

Table 2. Long description
A table with four rows and eight columns comparing the portions of variance in IQ across four nuclear twin family design models. The columns are labeled Model, V_A, V_NA, V_S, V_F, Cov_AF, V_E, and V_PP. The row labels are S @ zero, F @ zero, NA @ zero, and A @ zero. Each row provides values for the respective model. The table includes the following data: Row 1: S @ zero, V_A: 45, V_NA: .14, V_S: .00, V_F: .00, Cov_AF: .04, V_E: .36, V_PP: .34, Plausible. Row 2: F @ zero, V_A: .55, V_NA: .06, V_S: .03, V_F: .00, Cov_AF: .00, V_E: .36, V_PP: .34, Most plausible. Row 3: NA @ zero, V_A: .68, V_NA: .00, V_S: .03, V_F: .01, Cov_AF: -.05, V_E: .36, V_PP: .34, Less plausible. Row 4: A @ zero, V_A: .29, V_NA: .19, V_S: .03, V_F: .03, Cov_AF: .01, V_E: .36, V_PP: .34, Less plausible.
Of these four models, the most plausible was the model with V NA set at zero, and as shown elsewhere (Keller & Coventry, Reference Keller and Coventry2005), this model effectively ensured the estimates of V S, V F, CovAF , and V G (i.e. V A+VNA ) were maximized. The estimates of variance explained by this model are shown in Table 2. We note, also, that had we fixed the CovAF at zero, V A would have been 56% and V S would have been 7%. Had we also fixed the assortative mating copath at zero, V A would have been .46, V S, would have been .02, and V F would have been 01.
We now contrast this preferred NTFD model against the CTD. Due to the algebraic constraint mentioned earlier, the CTD has the potential to result in biased estimates of, for instance, V A. This is directly testable if estimates of heritability obtained using the CTD can be compared — when using the same dataset — with estimates obtained in an alternative model, such as the NTFD.
The additive genetic effects presented are larger in the CTD (54%) than the NTFD (68%), while nonadditive genetic effects are slightly larger in the NTFD (4%) than the CTD (set at zero). If taking assortative mating into account, the amount of variance explained by additive genes would have been similar to that of the CTD, at 56%). A chi-square test was performed to assess whether there was a significant difference between the NTFD (the saturated model) and the CTD (the nested model). The chi-square test was significant, χ2 (6, N = 6728) = 10,400, p < .001, indicating the NTFD fitted better than the CTD.
Discussion
A large body of literature has examined IQ variability (Polderman et al., Reference Polderman, Benyamin, De Leeuw, Sullivan, Van Bochoven, Visscher and Posthuma2015). These studies have almost exclusively employed the CTD, despite research indicating the CTD has the potential to produce biased estimates (Coventry & Keller, Reference Coventry and Keller2005; Keller & Coventry, Reference Keller and Coventry2005). To date, efforts to address the bias have been limited to three studies: a 20-year-old meta-analysis (Devlin et al., Reference Devlin, Daniels and Roeder1997); and two ETFD studies that have used such a wide variety of relative pairs for which data are hard to obtain (van Leeuwen et al., Reference van Leeuwen, van Den Berg and Boomsma2008; Vinkhuyzen et al., Reference Vinkhuyzen, Van Der Sluis, Maes and Posthuma2012). Large ETFD datasets do not exist. Consequently, research challenging the bias of CTDs is rare.
The aim of the present study was to address the bias of the CTD using a more capable yet parsimonious model — the NTFD. To accommodate the lack of data for the relative pairs required for the NTFD, our approach combined relative-pairs from a range of studies via a meta-analysis. This study represents the first meta-analysis of studies using an ETFD to examine IQ since Devlin et al. (Reference Devlin, Daniels and Roeder1997). Unlike Devlin et al., this study’s focus is not maternal effects, but instead incorporates IQ correlations from parent-child and spousal pair dyads to correct for the biases of the CTD.
The results of this study met all expectations, with all hypotheses supported if assortative mating is treated as a source of variance. All parameter estimates obtained under the NTFD deviated — in the direction predicted — from those obtained under the CTD. Each design is discussed individually below.
The main finding of this study was that CTD estimates of IQ heritability (68% in this study) that have dominated the literature was an accurate estimate of that generated using the NTFD. This corrected estimated of V A will more accurately inform gene-finding and polygenic risk-score studies. This is an ongoing focus of contemporary genetic research that relies on accurate guidance from BG. The results of this study are well placed to best guide this process. Plomin and Deary (Reference Plomin and Deary2015) identified a heritability gap, the difference in the 6% of variance in IQ currently explained by polygenic risk scores (Oxley et al., Reference Oxley, Wilding and Von Stumm2024) and the larger BG estimates. Estimates of V A obtained under the NTFD narrow this gap, while quantifying the presence of nonadditive genetic effects.
Beyond heritability, the second major finding in this study was the significant contribution assortative mating makes to IQ variability in a NTFD (34%). The current results, using the NTFD and a larger sample (6728 vs. 152 spousal pairs), offer substantial support to earlier research suggesting assortative mating may explain 11% of IQ variability (Vinkhuyzen et al., Reference Vinkhuyzen, Van Der Sluis, Maes and Posthuma2012). As predicted in the hypothesis presented earlier, V PP estimates in the NTFD will be greater than in the CTD. The implications for future research are significant, in that modeling assortative mating in IQ research will lead to significantly less biased estimates.
Beyond the role of nonadditive genetic effects and assortative mating in IQ, the NTFD also revealed effects, albeit small, of vertical transmission (1%), and gene-environment covariance (−5%) in explaining IQ. These effects are subsumed in a single estimate of shared-environment effects in the CTD. It is important to understand the nature of these potentially modifiable predictors of IQ, yet there has been little research on these effects to date.
Limitations and Opportunities for Future Research
This study has several limitations. First, while all care was taken to ensure there was no duplication in the data collected, there is no guarantee the samples (particularly twin samples from twin registers) used in different publications did not contain some of the same data.
In an endeavor to maintain the parsimony of the NTFD, no attempt was made to segregate twin-pairs or parent-child correlations according to gender. While Bouchard and McGue (Reference Bouchard and McGue1981) did not reveal any significant sex effects in their IQ correlations, a NTFD employed in Keller at al. (2013) determined that male narrow-sense (but not broad-sense) heritability estimates of IQ were lower than corresponding female narrow-sense heritability estimates. While such an undertaking was beyond the dataset employed in this current study, the value of future research examining sex-specific effects is acknowledged.
A further potential limitation is that the dataset incorporated correlations of IQ from participants of varying ages and socioeconomic status (SES) backgrounds. There is evidence that the heritability of IQ increases during childhood (Haworth et al., Reference Haworth, Wright, Luciano, Martin, De Geus, Van Beijsterveldt, Bartels, Posthuma, Boomsma, Davis, Kovas, Corley, DeFries, Hewitt, Olson, Rhea, Wadsworth, Iacono, McGue and Plomin2010), while the evidence on the impact of SES on the heritability of IQ is inconsistent (Hanscombe et al., Reference Hanscombe, Trzaskowski, Haworth, Davis, Dale and Plomin2012; Tucker-Drob & Bates, Reference Tucker-Drob and Bates2016). This current study disregarded both potential effects. It is therefore possible that by incorporating children and persons from low SES backgrounds in the dataset, genetic effects reported here will have been underestimated for older participants and higher SES environments. Future research partitioning participants by SES and age may reveal interesting findings.
This study also incorporated data collected from a variety of countries and cultures and made no endeavor to examine data heterogeneity or undertake country by country estimates. Further, it is assumed in this study that environmental influences on IQ are not more pronounced in MZ than DZ twins. There is potential for future research to address these issues with the data collected herein.
Finally, the CTD was estimated from the correlations among the MZ pairs and DZ pairs. By contrast, the NTFD used these twin-pair correlations and also the parent-parent and parent-child correlations. Given the meta-analytic nature of sample compiled, this resulted in the CTD estimating from a subsample of the total sample used by the NTFD estimates. This was an unavoidable consequence of the data used, and this may have biased the estimates to the extent the subsample was unrepresentative of the total sample. Given the small number of parent-parent pairs, at 6782, relative to the number of parent-child, MZ and DZ pairs, it is plausible some bias exists. That said, we cannot know the direction of this bias, so we class this as an unresolved limitation of this research.
Conclusion
To conclude, this study provides support for the hypothesis that IQ heritability estimates obtained under the CTD, across more than 280 peer-reviewed publications over 25 years, are accurate relative to those estimated using the NTFD. The results highlight that the CTD can be accurate in estimating heritability. By acknowledging the effects of assortative mating, the results of the NTFD suggest lower estimates of heritability and provide evidence that nonadditive genetic effects, assortative mating, covariation between genes and environment, and vertical transmission (albeit small) all influence IQ. These findings have important implications for interpreting prior studies and for future research designs.

 Open access

