1. Introduction
Land resources constitute the essential basis for human existence and serve as the catalyst for socioeconomic advancement. However, rapid urbanization and industrialization have engendered a comprehensive economic development model, culminating in the disordered growth and expansion of land resources (Chen et al., Reference Chen, Chen, Xu and Tian2016), causing issues such as low land use efficiency and misallocation of land resources (Cheng et al., Reference Cheng, Li and Zhang2023). To mitigate these problems, academics have promoted the effective utilization of current land resources, highlighting a transition in land usage from quantitative expansion to qualitative enhancement (Liu et al., Reference Liu, Xiao, Li, Ye and Song2020). This has spurred global attention to land regulation policies, including land use control (Jackson, Reference Jackson2016; Han et al., Reference Han, Zhang and Zheng2020), land price regulation (Feichtinger and Salhofer, Reference Feichtinger and Salhofer2016; Lin et al., Reference Lin, Qin, Yang and Zhu2020), and land supply regulation (Tian and Ma, Reference Tian and Ma2009; Fan et al., Reference Fan, Zhou, Yu and Zhang2021).
In particular, for developing countries like China, land financing has significantly contributed to its swift economic expansion (Lin and Yi, Reference Lin and Yi2011; Gyourko et al., Reference Gyourko, Shen, Wu and Zhang2022). This has triggered a series of issues, including unregulated urban land expansion, excessive loss of arable land, and environmental pollution (Du and Li, Reference Du and Li2021). As a result, the Chinese government has prioritized land management and regulation by enacting a series of land control regulations (Luo et al., Reference Luo, Qin, Wan and Jin2021). The LCIUP is a crucial initiative aimed at restricting land availability in multiple locations. Faced with land resource shortages, promoting land conservation and intensive use has become a critical necessity for sustainable development.
A substantial amount of research has examined the effects of extensive land usage. However, the environmental effects of land conservation and intensive use remain inconclusive. On the one hand, in the context of escalating resource and environmental limitations, land-saving and intensive land use can facilitate balanced growth of resources and the environment (Zhang et al., Reference Zhang, Zheng, Hunjra, Zhao and Bouri2024). Specifically, enhancing land utilization efficiency and altering land use patterns means adopting more resource-conserving and intensive methods, which can diminish energy use, carbon emissions (Xie et al., Reference Xie, Zhai, Wang, Yu, Lu and Chen2018; Shang et al., Reference Shang, Xu and Zhao2022). On the other hand, scholars contend that the allocation and land resource regulation threaten the ecological environment (Chen et al., Reference Chen, Lu, Hu, Zhang and Lin2021; Kong et al., Reference Kong, Zhou and Jiao2021). Kim (Reference Kim2011) contends that the primary objective of land use planning is not to produce economic advantages but to mitigate environmental hazards or resolve socio-political challenges. Therefore, the economic effects of land-intensive utilization may have dual outcomes. Land-intensive utilization may promote the transformation of counties from traditional resource-intensive industries to higher value-added, high-tech industries (Shang et al., Reference Shang, Xu and Zhao2022), thereby driving economic development. In addition, land-intensive utilization may constrain the development of land-dependent industries, particularly by curbing the expansion of resource-intensive and polluting sectors. Regional economic growth may suffer if economic transformation cannot be accomplished in the near future. Thus, the effects of land-intensive utilization remain an open question, warranting further investigation. For a detailed literature review, please refer to online Appendix A.
Against this backdrop, this study systematically evaluates the implementation effects of the land conservation and intensive use policy (LCIUP). Specifically, it views the selection of land conservation and intensive use model counties in China as a quasi-natural experiment, utilizing county-level economic and geographic data from 2006 to 2021. The Callaway and Sant'Anna (Reference Callaway and Sant'Anna2021) designed Difference-in-Differences method (CSDID) was employed to evaluate the environmental and economic impacts of LCIUP. These findings reveal the ‘environment–economy’ asymmetry effect of the LCIUP. Specifically, while the LCIUP actively promotes pollution control and improves environmental quality, it simultaneously inhibits economic growth. These two effects operate in completely opposite directions, exhibiting neither synchronized positive nor negative impacts, demonstrating pronounced asymmetry. This confirms that the LCIUP has not yet fulfilled the dual objectives of environmental preservation and economic development. This study has significant implications for refining land regulation policies, advancing the goal of sustainable development in these regions.
The marginal contribution manifests in four key aspects: First, existing studies relying on indicator-based methods to measure land intensive utilization often suffer from endogeneity bias. By selecting the LCIUP as a proxy variable for land conservation and intensive utilization and employing the CSDID method, this study mitigates such bias. Second, unlike Shang et al. (Reference Shang, Xu and Zhao2022), which analysed cities as units, this study employs long-period panel data at the county level in China for causal identification. This precisely reveals the heterogeneity of policy effects at the small-scale (county) level, providing targeted insights for sustainable county development. Third, in terms of industrial analysis, this study finds that LCIUP has not effectively promoted industrial transformation and upgrading at the county level. A policy focused solely on intensive land use may exert a suppressing effect on the county economy. This finding extends the scope of Shang et al. (Reference Shang, Xu and Zhao2022), which mainly investigated the effects of intensive land use on corporate pollution emissions, neglecting the aspect of industrial upgrading. Fourth, from the perspective of capital, technology and labour as three key factors, this study clarifies the differentiated synergistic effects between factor policies and LCIUP. Green finance policies can synergize with LCIUP to promote industrial transformation and upgrading in counties, while technological innovation and talent introduction policies have yet to demonstrate effectiveness. This conclusion forms an important complement to the research by Liu et al. (Reference Liu, Luo and Yan2024), which focused on the ‘policy complementarity’ scenario to validate the beneficial impacts of land management programs. This study reveals the limitations of single policies and confirms the contextual dependence of land control policy effects.
The remainder of this study is structured as follows. Section 2 discusses the policy background and Section 3 presents the research design. Section 4 details the empirical analysis and Section 5 provides further analysis. Section 6 concludes with a discussion. The research framework is shown in Figure 1.
Research framework.

2. Policy background
In the face of land resource shortages, significant discrepancies between land supply and demand, and suboptimal land utilization, the promotion of land resource conservation and intensive use has emerged as an essential developmental imperative (Yu and Yuan, Reference Yu and Yuan2025). As a developing country, China is experiencing increasingly severe pressures from land scarcity and environmental degradation, with land-use issues becoming particularly acute. Consequently, the Chinese government has prioritized land-use issues, implementing a series of laws and regulatory measures focused on land control. From the enactment of the Land Management Law in 1986, to the Decision on Deepening Reforms and Strictly Managing Land issued by the State Council in 2004 (Guo Fa [2004] No. 28), and the Notice on Promoting the Conservation and Intensive Use of Land issued in 2008 (Guo Fa [2008] No. 3), China has progressively developed a comprehensive policy framework for land conservation, providing clear guidance for the country's land-use strategy. Furthermore, to implement the LCIUP effectively, China’s Ministry of Land and Resources has designated three batches of 428 model counties and 25 model prefecture-level cities as exemplars of land conservation between 2011 and 2016, with the aim of leveraging planning to guide various departments towards more efficient land use.
The LCIUP has yielded significant results. Following the selection of model counties, the availability of industrial land significantly decreased. Specifically, for the first batch of pilot counties, the entire supply of industrial land experienced an initial increase in 2006, but after being designated as a model county in 2011, the supply of industrial land in these counties dropped from 6,037.305 hectares to 4,402.404 hectares by 2021, representing a decrease of approximately 27.1 per cent. Similarly, for the second batch of pilot counties, the total supply of industrial land increased in 2006, but after being designated as model counties in 2013, the supply of industrial land fell from 8,524.53 hectares to 5,948.492 hectares by 2021, a decline of about 30.2 per cent.
The selection of model counties follows the principles of ‘tiered responsibility, full transparency, and closed-loop management’, with a standardized and transparent process from application to public announcement that includes four core steps: county-level governments first conduct self-evaluation against specified criteria, prepare resource utilization data and innovation practice records, and submit electronic packages via designated systems plus hard copies to provincial authorities; provincial land departments then verify document authenticity, conduct eligibility screening, and recommend qualified counties within allocated quotas to the ministerial Creation Activity Office; the ministerial office subsequently carries out document reviews and expert panel assessments, and organizes on-site verification for top-ranked counties; finally, the proposed candidate list is reviewed by the ministerial office, publicly announced through authoritative platforms, and finalized as the official list if no objections are raised, with a dynamic follow-up supervision mechanism in place to ensure whole-process closed-loop management.
The primary reasons for selecting these counties as quasi-natural experiments are as follows. First, the model counties for LCIUP have been instrumental in executing the policy. They have attained significant accomplishments in advocating for the preservation and intensive utilization of land resources, offering valuable lessons for other regions. These counties serve as practical examples, facilitating the dissemination and replication of successful practices, and furthering the nationwide effort toward sustainable land resource use. Second is the practical effectiveness. These model counties provide concrete case studies and data that facilitate a thorough comprehension of the effects and repercussions of LCIUP in practice. By comparing the environmental pollution and economic development outcomes of the model counties with those of non-model counties, we can directly observe the real-world impact of the policy, thereby providing evidence to guide policy adjustments and optimization.
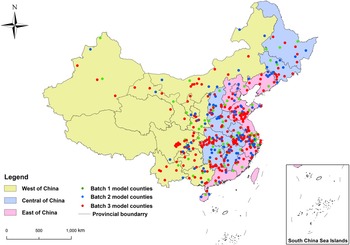
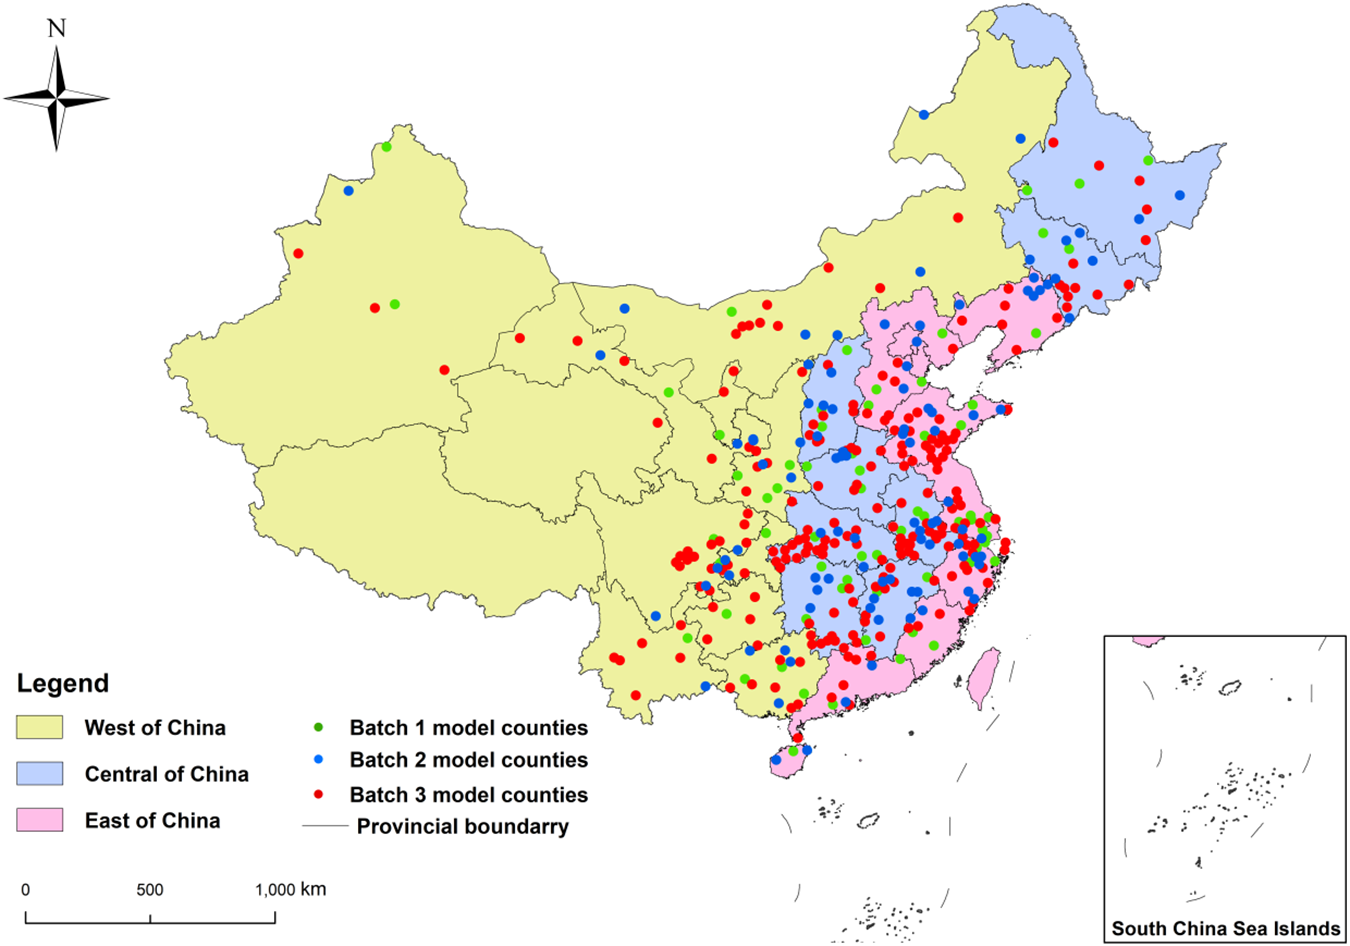
This study compiles a long-term panel dataset from 1,954 counties in China for the period 2006–2021. The experimental group includes 383 model counties from the three batches, while the control group consists of 1,571 counties from across eastern, central and western China. Figure 2 illustrates the precise locations of the counties.
Distribution of land conservation and intensive use pilot counties.
3. Empirical strategy
3.1. Identification strategy
Considering that the selection of model counties is implemented in three batches, their status of being affected by the policy may also change. To identify the heterogeneous effects of the LCIUP on the county-level ‘environment-economy’ nexus, this study mainly adopts the CSDID approach. This method addresses the estimation bias caused by ‘heterogeneity in treatment timing’ in the traditional multi-period difference-in-differences approach through ‘grouped estimation and dynamic aggregation’, enabling accurate capture of policy effects across different counties (with varying first-time policy shock timings) and over different periods.
We divide the sample into different groups based on the year when each county first received the LCIUP.
Treatment groups: Counties first selected as model counties for land and resources in period  $g$ (
 ${\text{g}} \in {\text{G}} = {\text{\{2011, 2013, 2016\}}}$).
Control group: Counties not selected as model counties during the observation period.
For groups first exposed to the policy in period  $g$, the group-time average treatment effect in periods
 $t \geqslant g$ is defined as
 \begin{equation}{\text{ ATT (g,t)}} = E\left[ {{Y_{i,t}}\left( 1 \right) - {Y_{i,t}}\left( 0 \right)|{{\text{G}}_{\text{i}}} = {\text{g}}} \right].\end{equation}
In Model (1), 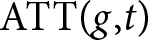 ${\text{ATT(}}g{\text{,}}t{\text{)}}$ characterizes the average effect of LCIUP for counties first exposed to it in period
 $g$ at year
 $t$, relative to the scenario where they do not receive the policy.
 ${Y_{i,t}}$ denotes the dependent variable, including the annual average PM2.5 concentration and per capita GDP of county
 $i$ in year
 $t$.
 ${Y_{i,t}}{\text{(1)}}$ represents the ‘potential outcome under treatment status’ of county
 $i$ in period
 $t$, i.e., the possible value of the dependent variable if county
 $i$ implements the LCIUP in year
 $t$.
 ${Y_{i,t}}{\text{(0)}}$ denotes the ‘potential outcome under non-treatment status’ of county
 $i$ in year
 $t$, i.e., the possible value of the dependent variable if county
 $i$ never implements the LCIUP in year
 $t$.
 ${G_i}$ indicates the ‘first treatment period’ of county
 ${\text{ }}i$, i.e., the year when county
 $i$ first implements the LCIUP.
This study employs the Doubly Robust (DR) estimation method to calculate 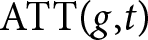 ${\text{ATT(}}g{\text{,}}t{\text{)}}$. After controlling for control variables, county fixed effects (FE), and year FE, the form of the DR estimator is expressed as
 \begin{equation}{\text{AT}}{{\text{T}}^{{\text{DR}}}}{\text{(}}g{\text{,}}t{{;\delta ) = }}E\left[ {\left( {\frac{{{{\text{G}}_{\text{g}}}}}{{{\text{E}}\left[ {{{\text{G}}_{\text{g}}}} \right]}}{\text{ - }}\frac{{\frac{{{{\text{P}}_{\text{g}}}{\text{(X)C}}}}{{{\text{1 - }}{{\text{P}}_{\text{g}}}{\text{(X)}}}}}}{{{\text{E}}\left[ {\frac{{{{\text{P}}_{\text{g}}}{\text{(X)C}}}}{{{\text{1 - }}{{\text{P}}_{\text{g}}}{\text{(X)}}}}} \right]}}} \right){\text{(}}{{\text{Y}}_{{\text{i,t}}}}{\text{ - }}{{\text{Y}}_{{{i,g - \delta - 1}}}}{\text{ - }}{{\text{m}}_{{{g,t,\delta }}}}{\text{(X))}}} \right].\end{equation}
In Model (2), 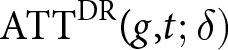 ${\text{AT}}{{\text{T}}^{{\text{DR}}}}{\text{(}}g{\text{,}}t{{;\delta )}}$ refers to the ‘group-time average treatment effect’ estimated by the DR method;
 ${{\delta }}$ denotes the pre-baseline period parameter
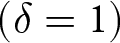 $({{\delta = 1)}}$, i.e., the outcome of the 1st period before policy implementation is used as the baseline period.
 ${G_g}$ represents the treatment group indicator variable, which takes a value of 1 if a county belongs to the ‘group first implementing the LCIUP in period
 $g$’ and 0 otherwise, serving to define the affiliation of samples to the treatment group.
 ${P_g}{\text{(}}X{\text{)}}$ is the propensity score, indicating the probability that a county belongs to
 $g$ given the covariates (control variables)
 $X$ and conditional on the county being either ‘in group
 ${\text{g}}$ or the never-treated group’. It is used to balance the distribution differences in observable characteristics between the treatment group and the control group.
 $C$ denotes the control group indicator variable.
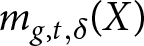 ${m_{g{\text{,}}t{{,\delta }}}}{\text{(}}X{\text{)}}$ is the outcome regression function, representing the expected outcome change from period
 $g - 1$ to
 $t$ based on the never-treated group samples and given the covariates
 $X$; it is used to construct counterfactual outcomes and control for the confounding effects of covariates.
Furthermore, this study adopts two aggregation strategies to aggregate the group-time average treatment effects, with the formulas expressed as follows:
 \begin{equation}{\text{CS\_ATT}} = \mathop \sum \limits_{{\text{g}}\in {\text{G}}} \mathop \sum \limits_{{\text{t = 2}}}^{\text{T}} {{\omega }}\left( {{\text{g,t}}} \right) \times {\text{AT}}{{\text{T}}^{{\text{DR}}}}{{(g,t;\delta )}}{\text{.}}\end{equation}
In Model (3),  $\omega{\text{(}}g{\text{,}}t{\text{)}}$ denotes the weights for simple weighting and calendar weighting, and
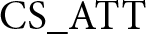 ${\text{CS\_ATT}}$ represents the average treatment effect calculated based on the two aggregation strategies.
3.2. Variables
3.2.1. Explained variables
The dependent variables are the logarithm of the average PM2.5 concentration (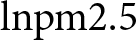 ${\text{lnpm2}}{\text{.5}}$) and the logarithm of per capita GDP (
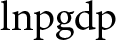 ${\text{lnpgdp}}$). PM2.5 concentration is used as a proxy for environmental pollution at the county level. Rapid urbanization and industrialization in China have led to severe air pollution, particularly in terms of PM2.5 concentration – fine particulate matter with a diameter of less than 2.5 micrometers (Jin et al., Reference Jin, Fang, Wen and Shan2017). Due to its significant impact on human health, PM2.5 is widely regarded as a key indicator of environmental pollution. Per capita GDP is used as a proxy for county-level economic development. It is calculated as the region’s GDP divided by its year-end population and is commonly employed to measure both economic development and living standards.
3.2.2. Explanatory variable
This study employs a dummy variable representing LCIUP as the explanatory variable. This variable is based on whether county  $i$ was first designated as a model county for LCIUP: it takes a value of 1 for years when county
 $i$ became the first LCIUP model county, and 0 otherwise.
3.2.3. Control variables and predefined variables
To account for potential confounding factors affecting county-level PM2.5 concentration and per capita GDP, this study incorporates a set of control variables that capture key socioeconomic characteristics. Population density is measured as the year-end total population divided by the administrative land area (O'Sullivan, Reference O'Sullivan2020). Government fiscal concentration is measured by the ratio of local general budget revenue to regional GDP (Li et al., Reference Li, Cheng, Yin, Yang and Xu2024). Financial development level is measured as the ratio of the year-end balance of financial institution loans to regional GDP (Huang, Reference Huang2018). Educational level is captured by the ratio of secondary school students to the year-end total population. Given the impact of climatic factors on PM2.5 concentration, this study follows Duan et al. (Reference Duan, Jiang and Qi2024) in including humidity, temperature, and wind speed as additional control variables.
Increased population density directly or indirectly elevates particulate matter emissions by boosting transportation demand and residential energy consumption while promoting industrial spatial clustering. Higher government fiscal concentration enhances local governments’ financial capacity, thereby increasing investment in pollution control facilities, which may influence PM2.5 levels. Financial development may increase emissions by supporting credit expansion for high-pollution industries, thereby affecting PM2.5 concentrations. Higher education levels enhance environmental awareness among residents and businesses, encouraging residents to adopt green lifestyles and businesses to implement cleaner production technologies.
Furthermore, to address potential selection bias, we adopt the approach of Li et al. (Reference Li, Gasser, Ciais, Piao, Tao, Balkanski and Zhou2016) and incorporate county-specific time trends of predefined variables. Specifically, we control for cultivated land area and terrain undulation in the baseline year (2006). Counties with less cultivated land face greater land scarcity, making them more inclined toward land conservation and thus more likely to be designated as model counties. Conversely, counties with greater terrain undulation face higher barriers to intensive land use, making them less likely to meet the selection criteria for model counties. The above variables have all been converted to natural logarithms.
3.2.4. Mechanism variables
This study conducts a mechanism analysis from three perspectives: land supply, firm dynamics, and industrial structure transformation. First, the LCIUP may lead local governments to impose restrictions on land supply in model counties. To capture this effect, we use total land supply, industrial land supply, commercial land supply, and residential land supply as proxy variables for land availability. Second, to examine firm dynamics, we leverage the China Industrial and Commercial Enterprise Database to identify newly registered firms, exiting firms and existing firms. These measures serve as proxies for firm entry, exit, and market activity adjustments. Third, we assess changes in industrial structure using the share of primary, secondary, and tertiary sector value-added in GDP at the county level.
Additionally, all variables are winsorized at the 1 per cent and 99 per cent levels to mitigate the influence of extreme values before model estimation. Table A5 (online appendix) presents the descriptive statistics of the key variables.
3.3. Data sources
This study focuses on a sample of 1,954 counties in China from 2006 to 2021, with a treatment group consisting of 383 counties and a control group comprising 1,571 counties across eastern, central and western China. The data sources are presented in online appendix Table A4.
4. Empirical analysis
4.1. Baseline estimations
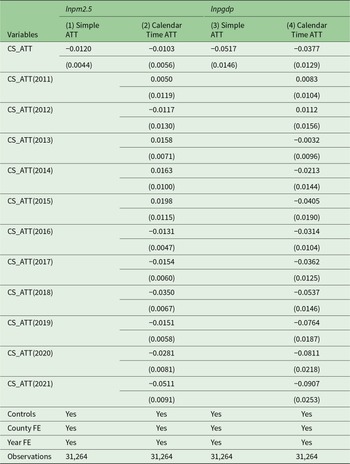
Table 1 presents the baseline regression results examining the impact of LCIUP on the mean PM2.5 concentrations and per capita GDP. Columns 1 and 3 of Table 1 aggregate results using a simple weighted average method, while columns 2 and 4 aggregate results using a calendar-weighted average method. It can be observed that regardless of the aggregation method employed, LCIUP exerts a significant negative impact on both the average PM2.5 concentration and per capita GDP.
Baseline regression results

Note: Standard errors clustered at the county level are reported in parentheses, as reported in subsequent tables.
Source: The table was created by the author.
In column 1, the coefficient for LCIUP is significantly negative, suggesting that LCIUP significantly reduced PM2.5 concentrations. Specifically, LCIUP led to an average reduction of approximately 1.2 per cent in PM2.5 concentrations in demonstration counties compared to non-demonstration counties. Intensive land use is considered a key approach to environmental protection (Quintas-Soriano et al., Reference Quintas-Soriano, Castro, Castro and García-Llorente2016). Land conservation implies more efficient use of existing land resources, reducing the need for new land development. Land development is often accompanied by ecological degradation and pollution (Shang et al., Reference Shang, Xu and Zhao2022), so minimizing land development can mitigate these negative externalities. The intensive management of industrial land can restrict the expansion of high-pollution, resource-intensive industries, and limited land supply may also deter the entry of such firms.
In column 3, the coefficient of LCIUP is significantly negative, indicating that LCIUP significantly suppresses per capita GDP. Specifically, LCIUP reduces per capita GDP in demonstration counties by approximately 5.17 per cent compared to non-demonstration counties. This finding suggests that while LCIUP yields significant environmental benefits, the policy exerts a certain degree of suppression on economic growth. This outcome primarily stems from the policy’s strict limitations on the supply of industrial land. A notable example is Shaoxing City in Zhejiang Province, where the Keqiao District, Zhuji City, and Xinchang County received the National Model County title for land conservation in three consecutive rounds of awards. The local government reduced the availability of industrial land to ensure its conservation and intensive use. Land, as one of the key production factors for industrial enterprises, is crucial for their expansion and development. A reduction in land supply implies that firms may be unable to continue expanding production capacity or establishing new plants, potentially leading to a decline in output, which ultimately manifests as slower economic growth. For relevant robustness tests to verify the reliability and stability of the empirical results, please refer to online Appendix D. Appendix Table A6 summarizes the results of all robustness tests conducted in this paper.
4.2. Parallel trend tests
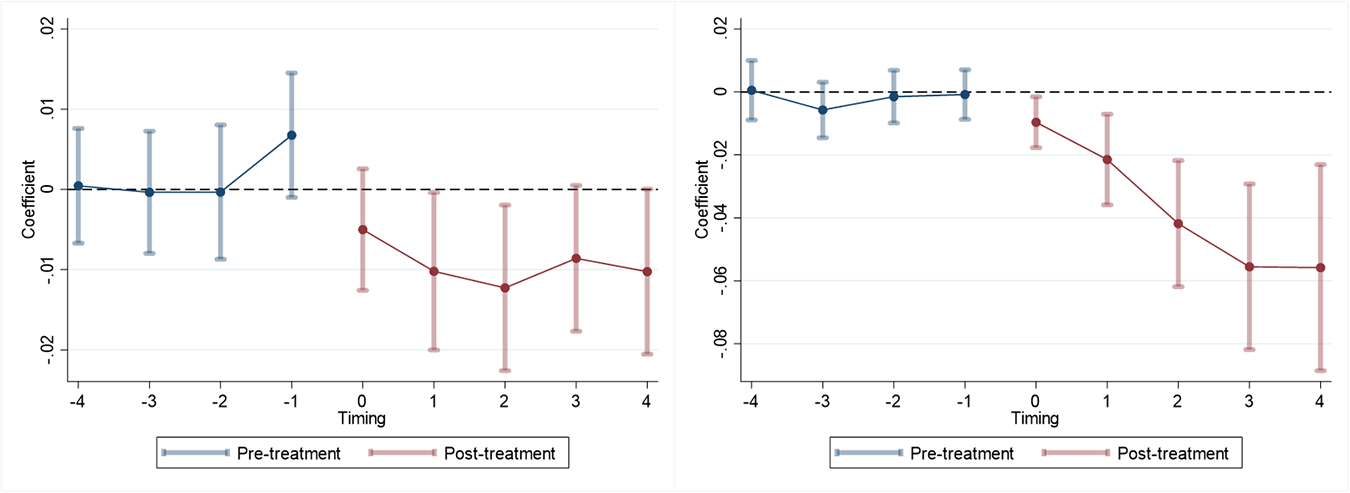
The parallel trend assumption necessitates that prior to the deployment of LCIUP, there should be no significant difference in the mean PM2.5 concentrations and per capita GDP between demonstration counties and non-demonstration counties, and their change trends should be parallel. Figure 3 presents the dynamic effect diagram based on the CSDID method. It can be observed that the mean PM2.5 concentrations and per capita GDP exhibit identical change trends before policy implementation, indicating that the conditions prior to the implementation of the LCIUP satisfy the parallel trend assumption.
Parallel trends test (CSDID).

5. Further analysis
5.1. Mechanism analysis
This paper argues that LCIUP influences both the average PM2.5 concentration and per capita GDP in demonstration counties through three channels: land supply, firm-level dynamic adjustments and industrial transformation. To verify the existence of these channels, we utilize the CSDID methodology to evaluate the impacts of LCIUP on these three dimensions.
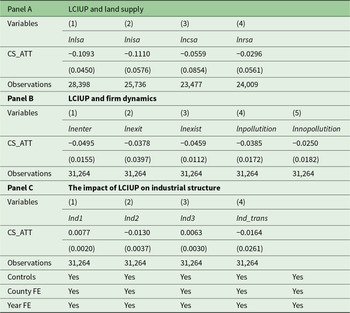
First, we examine the impact of LCIUP on land supply area from the perspective of land allocation. In columns 1 and 2 of panel A in Table 2, LCIUP exerts a significantly negative effect on both total land supply area and industrial land area. These findings suggest that the LCIUP primarily influences the allocation of industrial land resources, leading to a reduction in the land available to support industrial sector growth. Fewer land resources are allocated to industrial expansion and construction, meaning that existing industrial enterprises are less likely to freely expand their land use. However, the policy does not include incentives for land use conversion, such as preferential treatment for commercial land supply, which highlights the limitations of the LCIUP.
Mechanism analysis
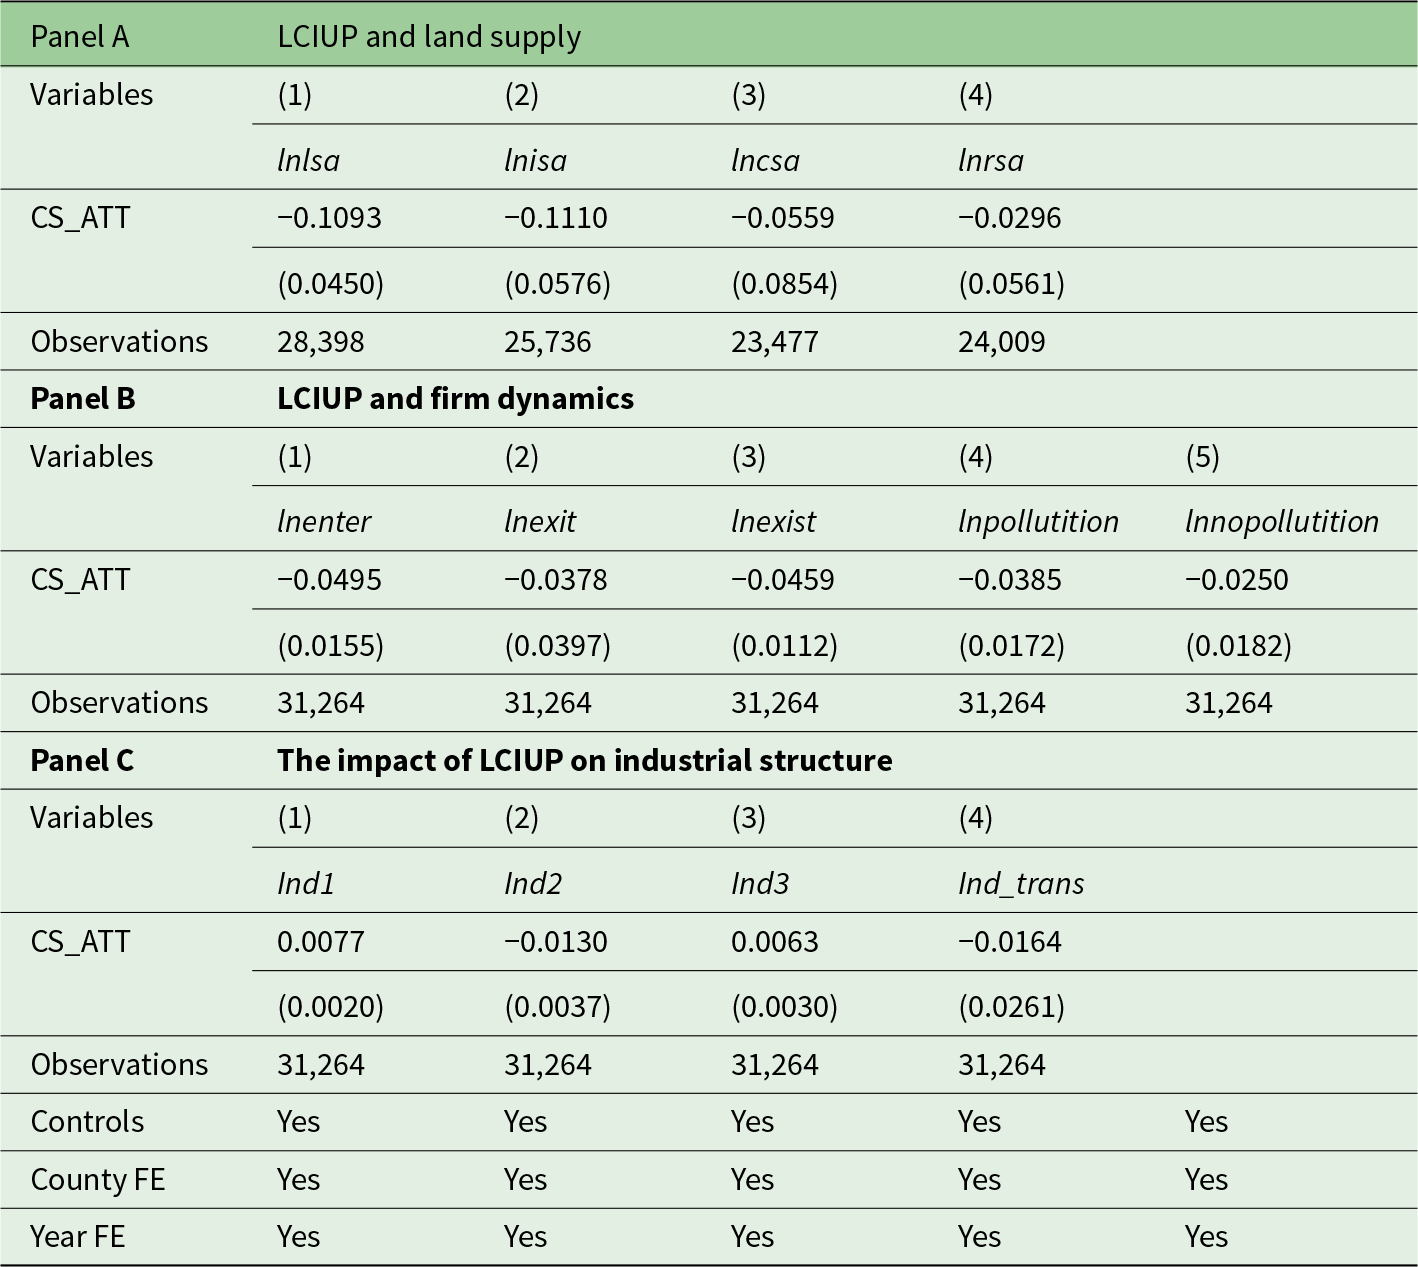
Notes: The categorization of polluting and non-polluting enterprise entries is primarily based on the Industry Classification Guidelines of the Ministry of Ecology and Environment of China. Polluting industries include mining; construction; electricity, heat, gas, and water production and supply; wholesale and retail trade; accommodation and catering services; manufacturing; and transportation, warehousing, and postal services, totalling seven categories. Non-polluting industries encompass agriculture, forestry, animal husbandry and fishery; information transmission, software and information technology services; water conservancy, environment and public facilities management; residential services, repairs and other services; education; culture, sports and entertainment; real estate; finance; leasing and business services; scientific research and technical services; health and social work; and public administration, social security and social organizations, totalling 12 categories.
Source: The table was created by the author.
Further, land-related policies can influence firm behaviour, which in turn affects regional environmental quality and economic development (Cherniwchan and Najjar, Reference Cherniwchan and Najjar2022). Land plays a crucial role in firm location decisions, with businesses typically considering factors such as land costs and availability (Zheng and Shi, Reference Zheng and Shi2018). Therefore, to comprehensively capture the policy’s impact on dynamic firm adjustments at the county level, we use data from China’s industrial registration database to compute the number of new firm registrations, firm exits, and existing firms in each county annually. These variables are then incorporated into the regression analysis as explanatory variables.
In columns 1 to 3 of panel B in Table 2, LCIUP has a significant negative effect on both the entry and the number of existing firms, while the effect on firm exits is statistically insignificant. This suggests that the policy affects the dynamic adjustment of firms, ultimately reducing both firm entry and the number of existing firms.
Further, based on the Ministry of Ecology and Environment’s industry classification guidelines, we calculate the number of new registrations for polluting and non-polluting industries in each county, using the logarithmic values of these numbers as explained variables in our regression analysis. The regression results are shown in columns 4 and 5 of panel B in Table 2. The LCIUP exerts a remarkably negative inhibitory effect on the market entry behaviours of pollution-intensive enterprises, while its impact on non-polluting enterprises is insignificant. This indicates that the LCIUP primarily restricts the entry of polluting enterprises. When demonstration counties reduce land supply, the cost of remaining land increases, which limits the entry of less efficient firms, particularly polluting ones, resulting in a decrease in the total number of enterprises. To summarize, while the LCIUP improves environmental quality through dynamic firm adjustments, it also inhibits economic development at the county level.
Finally, this paper examines the impact of the policy on the industrial structure by using the shares of primary, secondary, and tertiary industries in GDP as the dependent variable. The regression results are presented in panel C of Table 2. In columns 1 and 3, the LCIUP has a significant positive effect on both the share of the primary industry and the share of the tertiary industry in GDP. In column 2, LCIUP exerts a significant negative impact on the secondary industry’s share of GDP. This indicates that LCIUP adjusts the proportion of each industry within county-level economies.
Specifically, LCIUP significantly increases the share of the primary sector, with the policy on average boosting its share by 0.77 per cent; it significantly reduces the share of the secondary sector, with the policy on average decreasing its share by 1.30 per cent; and it significantly increases the share of the tertiary sector, with the policy on average boosting its share by 0.63 per cent. The mean share of the primary sector is 0.2116. LCIUP increases this share by 0.0016 (0.2116 * 0.77%), resulting in an average increase of 26.5015 million yuan in primary sector value added (0.0016 * 165.6346 billion yuan). The average share of the secondary industry was 0.4158. LCIUP reduced this share by 0.0054 (0.4158 * 1.30%), resulting in an average decrease of 89.4543 million yuan in secondary industry value-added (0.0054 * 1,656,346 million yuan). The average share of the tertiary industry was 0.3723. LCIUP increased this share by 0.0023 (0.3723 * 0.63%), resulting in an average increase of 38.0346 million yuan in tertiary industry value-added (0.0023 * 1,656,346 million yuan). The sum of these three changes is −24.9182 million yuan, indicating that the net effect of the LCIUP is negative. Consequently, it exerts a considerable adverse effect on the county's economic development.
Furthermore, this paper employs the ratio of tertiary industry value-added to secondary industry value-added as a proxy variable for industrial transformation and upgrading in regression analysis. The results are presented in column 4 of panel C in Table 2. The coefficient for LCIUP is not statistically significant, indicating that LCIUP has failed to effectively incentivize the secondary industry to transition toward higher value-added and more environmentally friendly sectors. This also constitutes a key reason why the implementation of LCIUP has suppressed county-level economic growth.
5.2. Cost and potential analysis of industrial transformation
In the previous sections, we have discussed the limited success of the policy in achieving the expected industrial transformation. To further assess the effects of the policy implementation, this section will analyse the transformation challenges and opportunities in county regions from two perspectives: the costs of industrial transformation and the potential of transformation.
5.2.1. Cost of industrial transformation
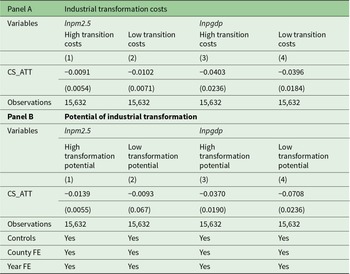
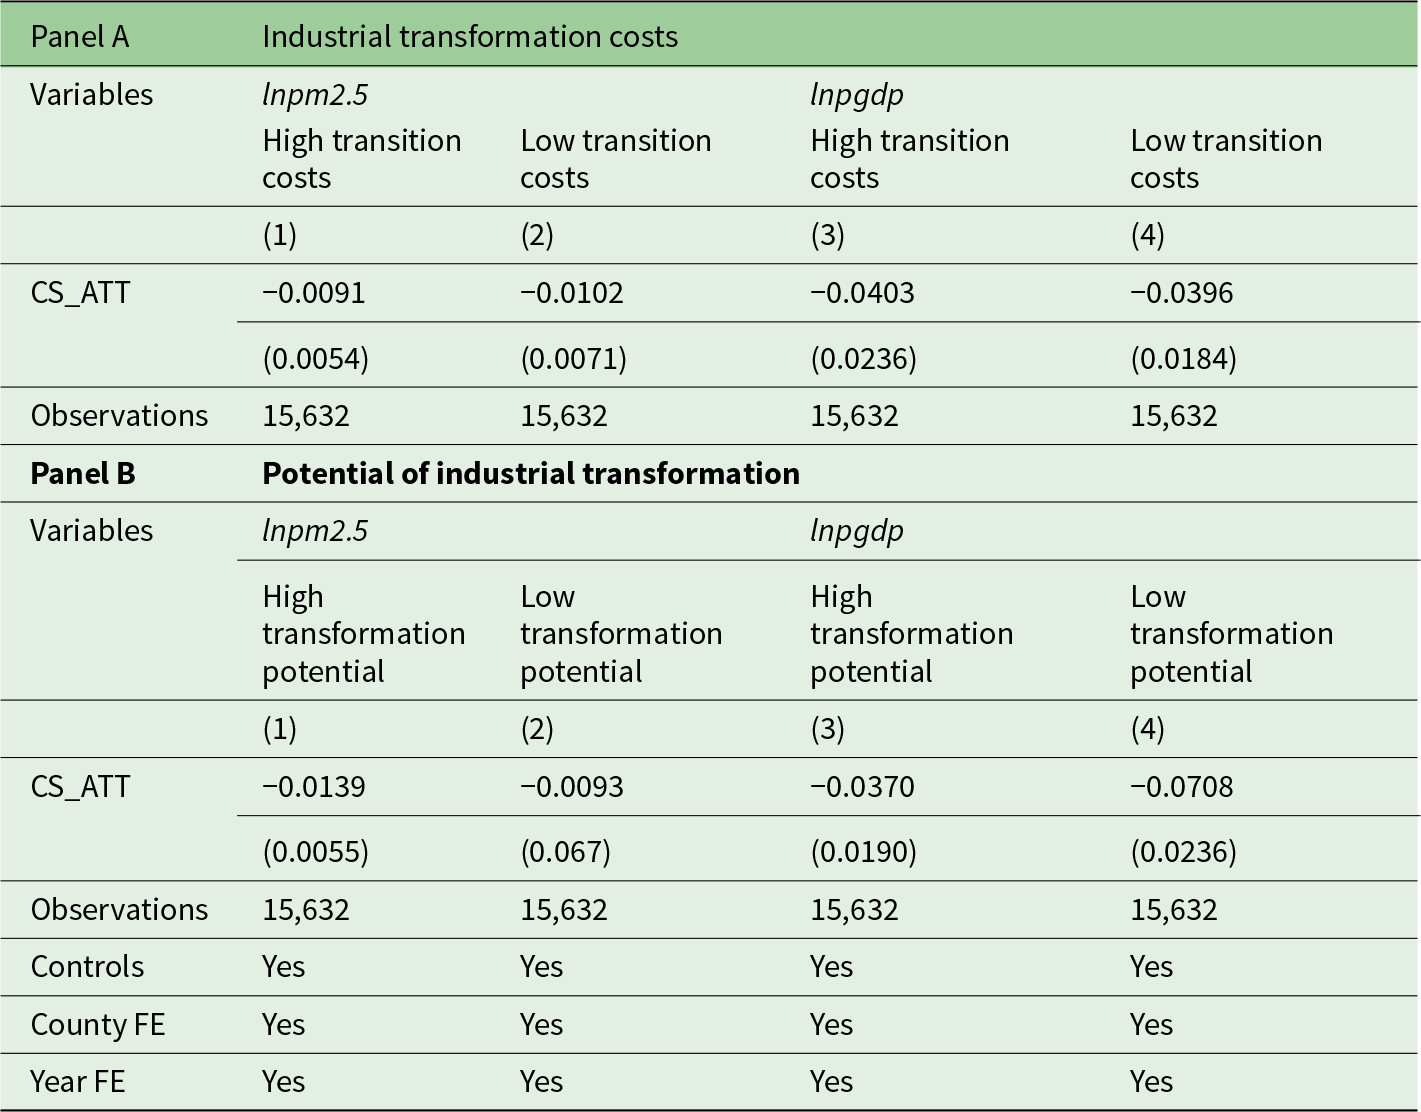
The LCIUP significantly restricts the supply of industrial land, which is most relevant to the secondary industry. Therefore, counties with a higher initial share of the secondary industry in GDP will face greater difficulty in achieving industrial transformation in the short term, leading to higher transformation costs. The environmental pollution reduction effects and the economic crowding-out effects of the policy will also be more pronounced. To address potential endogeneity, we measure the costs of industrial transformation using the proportion of the secondary industry in GDP in the base year (2006). The data was categorized into two regression groups according to the mean: ‘high transition costs’ and ‘low transition costs’. The results are shown in panel A of Table 3.
Cost and potential analysis of industrial transformation
Source: The table was created by the author.
In columns 1 and 2, in counties with high industrial transition costs, the regression coefficient for LCIUP is significantly negative, indicating that after LCIUP implementation, the average PM2.5 concentration in these counties decreased significantly. In counties with low industrial transition costs, the coefficient for LCIUP is not significant. In counties with high transformation costs (high initial secondary industry share), industry is the primary pollution source. By restricting industrial land supply, LCIUP directly curbs high-pollution industrial activities, making pollution reduction effects more readily apparent in the short term. Conversely, in counties with low transformation costs (low initial secondary industry share), pollution emissions are predominantly from non-industrial sources. Policy controls on industry struggle to rapidly drive down overall pollution levels, resulting in insignificant pollution reduction effects.
In columns 3 and 4, in counties with high industrial transition costs, the coefficient for LCIUP is −0.0403, significant at the 10 per cent level. In counties with low industrial transition costs, the difference-in-differences coefficient is −0.0396, significant at the 5 per cent level, slightly lower than that of counties with high transition costs. Counties with high transformation costs rely on industry as their economic pillar. LCIUP restrictions on industrial land directly impact core industries, damaging the ‘core drivers’ of economic growth. This crowding-out effect constitutes a direct impact on the economic foundation.
In summary, industrial transition costs significantly moderate the environmental and economic effects of LCIUP. Counties with high transition costs achieve significant pollution reduction but bear higher economic crowding-out effects, while those with low transition costs exhibit insignificant emission reduction effects.
5.2.2. Potential for industrial transformation
We observed that industrial transformation has not yet been realized. Thus, we turn to market potential to analyse the potential for industrial transformation. Market potential is measured by the distance from each county to the provincial capital in the base year, as the development of the tertiary sector frequently relies on external market demand, particularly in the service sector. Provincial capitals, as economic hubs, offer stronger market demand and consumption power. Therefore, counties farther from these economic centres face smaller market demand, which limits the rapid development of the tertiary sector.
This study classifies the aforementioned distances into two categories according to the median: high transformation potential (closer to provincial capitals) and low transformation potential (further from provincial capitals), performing separate regressions for each. The results are presented in panel B of Table 3. In columns 1 and 2, the coefficient for LCIUP is significantly positive in counties with high industrial transformation potential, while it is not significant in counties with low transformation potential. This difference stems from the fact that counties closer to provincial capitals can more readily achieve environmental pollution reduction by transitioning from secondary to tertiary industries. In contrast, counties farther from provincial capitals lack sufficient transformation resources, making it difficult for them to rapidly reduce pollution.
In columns 3 and 4 of Table 3, in counties with greater industrial transformation potential, the regression coefficient for LCIUP is −0.0370 and significant at the 10 per cent level. In counties with lesser industrial transformation potential, the regression coefficient for LCIUP is −0.0708 and significant, indicating more severe economic damage. This phenomenon stems from the fact that counties near provincial capitals can offset economic declines caused by shocks to traditional industries by developing supporting services. In contrast, counties farther from provincial capitals have limited market potential and lack alternative industries, making them prone to falling into a ‘industrial contraction – growth slowdown’ dilemma. This aligns with the earlier conclusion that LCIUP has not achieved industrial transformation and upgrading.
The findings indicate that industrial transformation potential significantly moderates the policy effects of LCIUP. Counties with high transformation potential achieve substantial emission reductions with relatively minor economic losses, whereas those with low potential exhibit negligible emission reductions and suffer more severe economic damage. This demonstrates that positive policy outcomes depend on transformative foundations, providing empirical support for implementing tailored industrial support policies in low-potential counties.
6. Conclusion and discussion
6.1. Conclusion
This paper examines the dual effects of this land control policy on pollution reduction and economic growth. The findings reveal an asymmetric relationship in the environmental–economic impacts of the LCIUP, indicating that the policy failed to fulfil the dual objectives of environmental preservation and economic advancement. Specifically, LCIUP reduced average PM2.5 concentrations by 1.2 per cent in model counties while causing an average decline of approximately 5.17 per cent in per capita GDP. This finding remained resilient following a number of stability assessments, indicating that LCIUP positively influences environmental protection while negatively affecting economic growth – demonstrating the asymmetric nature of LCIUP’s effects on county-level environment and economy.
This paper analyses the LCIUP impact mechanism through the logic chain of ‘land supply – enterprise dynamic adjustment – industrial structure transformation’, addressing the oversight of micro-level behavioural linkages in traditional research. Specifically, intensive land usage significantly enhances environmental quality. By restricting industrial land supply, LCIUP curtails the registration of polluting enterprises and reduces the number of existing polluting enterprises, thereby suppressing secondary industry development and contributing to environmental quality improvement. However, the policy has failed to significantly promote industrial restructuring. Constraints on secondary industry development have hindered industrial upgrading and transformation. Consequently, the environmental pollution reduction achieved by LCIUP comes at the expense of economic growth.
Industrial upgrading and transformation depend on two factors: county-level industrial characteristics and external policy coordination. Regarding county-level industrial characteristics, transformation hinges on the county’s transition costs and potential. For counties where the secondary industry is dominant, implementing LCIUP presents significant challenges, as the policy constrains industrial development in these areas. In the short term, these counties struggle to replace the shrinking secondary industry with other sectors, resulting in high transformation costs. In contrast, counties with greater market potential demonstrate stronger industrial transformation potential, which can partially offset the negative economic impacts of LCIUP, attaining a mutually beneficial result for economic advancement and ecological preservation. Regarding external policy coordination, synergies may exist between LCIUP and policies related to capital, technology, and labour factors. Research indicates that green finance policies can effectively synergize with LCIUP to drive county-level transformation and upgrading, while policies on technological innovation and talent recruitment currently fail to generate synergistic effects. This discrepancy directly relates to the core constraint of county industrial upgrading being capital scarcity, which green finance can precisely address. For details on the synergistic effects between factor policies and LCIUP, please refer to online Appendix B.
This study further constructs a cost–benefit trade-off framework for the policy, evaluating the marginal advantages of enhancements in environmental quality relative to the marginal costs of economic detriments. For a detailed cost–benefit analysis of the policy, please refer to online Appendix C. The social benefits from the environmental pollution reduction effects of the LCIUP significantly exceed the economic costs resulting from the decline in per capita GDP. However, the path to realizing these ‘net benefits’ exposes the inherent contradictions of the policy’s effects.
6.2. Policy implications
The LCIUP proposes a more environmentally friendly and efficient development model for land resource utilization, guiding the shift from ‘quantity-expansion’ to ‘quality-enhancement’ in land use. While aligning with global sustainable development trends, it also carries potential negative impacts. Based on this, the following policy recommendations are proposed.
In the short term, local governments should focus on alleviating transition pains and ensuring basic stability. For counties heavily reliant on secondary industries, local governments could establish a ‘Special Industrial Transformation Subsidy Fund’. This should primarily cover direct costs such as relocation and green equipment upgrades to mitigate operational pressures caused by policy changes. Simultaneously, local governments should establish a land use control-industrial compensation-spatial coordination mechanism. They should utilize an ‘Industrial Land Replacement Fund’ to finance the conversion of existing industrial land into green technology parks. This approach fulfils land intensification requirements while providing physical space for industrial upgrading, preventing excessive economic slowdown. After alleviating short-term pains, the focus must shift to addressing core bottlenecks in county-level industrial transformation by enhancing synergies between factor policies and LCIUP. Research has identified capital scarcity as the key obstacle to breaking the ‘secondary industry lock-in’ in counties. Therefore, green finance policies should serve as the core of this synergy, expanding the coverage of low-interest green loans and environmental rights pledge financing in counties. Priority should be given to supporting low-carbon industrial upgrading and cultivating green service industries to precisely address capital gaps.
Long-term policy design must focus on enhancing the inherent transformation potential of counties to achieve sustainable environmental and economic win–win outcomes. Governments should lower industrial transition barriers by improving digital infrastructure and leveraging regional resources to cultivate new growth engines. Examples include supporting digital agriculture, eco-tourism or green manufacturing clusters based on local strengths to gradually replace traditional secondary industries’ economic contributions. Successful models from high-potential counties should be replicated nationwide to guide more regions through industrial upgrading challenges. Furthermore, to address the limited effectiveness of policies on technological innovation and talent recruitment, policy implementation should be recalibrated. Technology policies must shift from ‘cutting-edge R&D’ to ‘practical application’, aligning with county-level industrial needs. Talent policies should transition from attracting talent to retaining talent by improving job opportunities in local industries and optimizing public services like education and healthcare. This ensures talent aligns with county industrial development, creating a synergistic force linking ‘land–capital–technology–talent’.
The global relevance of this study lies in several key areas. First, most developing countries still rely on land expansion to drive growth, and these regions face similar land-use pressures. China’s experience offers valuable insights for these countries, particularly in reconciling economic advancement with environmental conservation via judicious land-use regulation. Second, this study elucidates the correlation between land-intensive utilization and industrial structural transformation, confirming the feasibility of land control policies in reshaping development models by reconfiguring the allocation of production factors. It also highlights the limitations of land-saving intensive land-use models in driving industrial transformation, providing a viable path for combining land-use control with industrial upgrading strategies to achieve environmental improvement and long-term economic development.
Supplementary material
The supplementary material for this article can be found at https://doi.org/10.1017/S1355770X26100552.
Competing interests
The authors declare none.