Introduction
Family history is a major risk factor for most psychiatric disorders (Kendler et al. Reference Kendler, Davis and Kessler1997; Miles et al. Reference Miles, Stallings, Young, Hewitt, Crowley and Fulker1998; Sullivan et al. Reference Sullivan, Neale and Kendler2000; Bandelow et al. Reference Bandelow, Späth, Tichauer, Broocks, Hajak and Rüther2002, Reference Bandelow, Torrente, Wedekind, Broocks, Hajak and Rüther2004; Byrne et al. Reference Byrne, Agerbo and Mortensen2002; Klein et al. Reference Klein, Lewinsohn, Rohde, Seeley and Shankman2003; Qin et al. Reference Qin, Xu, Laursen, Vestergaard and Mortensen2005; Newman & Bland, Reference Newman and Bland2006; Coelho et al. Reference Coelho, Cooper and Murray2007). There has been a recent revival of interest in the family history method for both genetic research and public health screening. For example, gene-association studies and genome-wide studies often now collect family history information so as to improve statistical power to detect associations (Thompson et al. Reference Thompson, Witte, Slattery and Goldgar2004; Prescott et al. Reference Prescott, Sullivan, Myers, Patterson, Devitt, Halberstadt, Walsh and Kendler2005; Chen et al. Reference Chen, Wang, Hossain, O'Neill, Walsh, van den Oord, Fanous and Kendler2007). Family history is also being promoted for disease prevention (Yoon et al. Reference Yoon, Scheuner, Peterson-Oehlke, Gwinn, Faucett and Khoury2002).
Typically, family history is assessed by collecting reports of disorder for members of a target person's (or proband's) family. Once these data have been collected, the question becomes, what to do with them? That is, how should family history reports for a disorder be combined into an overall family history score for that disorder? Will a simple family history positive/negative dichotomy based on the presence or absence of disorder among family members predict proband outcome well enough, or is a more elaborate scoring method warranted?
Surprisingly few studies have compared the performance of different family history scores. Most have focused on whether simple dichotomous scores can perform as well as more complex scores which take account of density of disorder (i.e. the number of family members who have the disorder). Results suggest that density scores perform better than dichotomous scores for alcohol dependence (Turner et al. Reference Turner, Cutter, Worobec, O'Farrell, Bayog and Tsuang1993; Stoltenberg et al. Reference Stoltenberg, Mudd, Blow and Hill1998), but not for depression (Sullivan et al. Reference Sullivan, Wells, Joyce, Bushnell, Mulder and Oakley-Browne1996). The relative performance of density versus dichotomous scores for other psychiatric disorders has not been investigated. Moreover, whereas research in other health domains has investigated whether factors such as family size and family demographic structure (i.e. the age and sex of each family member) affect the predictive validity of family history scores (Silberberg et al. Reference Silberberg, Fryer, Wlodarczyk, Robertson and Dear1999; Murad et al. Reference Murad, Kalter-Leibovici, Chetrit and Freedman2007), these factors have yet to be investigated in psychiatry.
In this study we sought to determine the effect of taking account of density of disorder, family size and family demographic structure on the predictive validity of family psychiatric history scores (operationally defined as the ability of a family history score for a disorder to predict the same disorder in probands). We were able to assess the predictive validity of family history scores for seven psychiatric conditions (major depressive episode, anxiety disorder, suicide attempt, schizophreniform disorder, conduct disorder, alcohol dependence and drug dependence) as well as for two non-psychiatric outcomes: smoking and asthma. By assessing both psychiatric disorders and non-psychiatric outcomes, we were able to determine whether our findings about the predictive validity of family history scores were specific to psychiatric disorders or could be generalized to other areas of health.
The findings we report are from a new family history study, the Dunedin Family Health History Study (DFHHS). Thus, this report also serves to describe the methods of the DFHHS.
Method
Participants
All probands and informants gave informed consent before participating. Study protocols were approved by the Otago Ethics Committee.
Probands
Probands are members of the Dunedin Study, a 1-year birth cohort constituted at 3 years of age when investigators enrolled 91% of consecutive eligible births between April 1972 and March 1973 in Dunedin, New Zealand (Moffitt et al. Reference Moffitt, Caspi, Rutter and Silva2001). Follow-up assessments were conducted at ages 5, 7, 9, 11, 13, 15, 18, 21, 26 and 32 years. Here we report data from 981 probands (97% of the living sample of 1015, 51% male) who had available family history data. Cohort families represent the full range of socio-economic status in New Zealand's South Island and are primarily white.
Informants
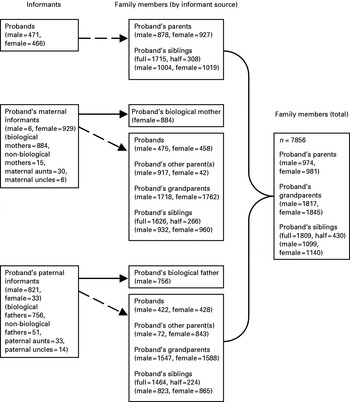
The DFHHS aimed to obtain informant-reported family history for three generations of the proband's family. To achieve this aim, we recruited up to three informants per family: the proband and both of the proband's parents. Fig. 1 summarizes information about informants and family members from the DFHHS.
Informants and family members from the Dunedin Family Health History Study.  , Information provided by self-report;
 , information provided by informant-report.

Proband reports
A total of 937 probands (92% of the living sample) provided information on the psychiatric health history and smoking of their biological siblings (aged >10 years) and parents. Family history interviews typically took place at the Dunedin Research Unit when probands were aged 32 years (2004–2005). Interviews were conducted by trained research interviewers who were blind to the proband's previous data and to the data provided by the parent. Probands did not report on their grandparents as we were not confident that they would have sufficient knowledge to report accurately, nor did they report on asthma as they were not interviewed about their family members' physical health at the age 32 years assessment.
Parent reports
Maternal and paternal informants provided information on the psychiatric health history, smoking and asthma of the probands' biological siblings (aged >10 years), parents and grandparents. Family history interviews typically took place in the home of the parent during 2003–2006, when probands were aged 30–33 years. Interviews were conducted by trained research interviewers who were blind to the data provided by the proband. We aimed to interview the biological mother and father of all living probands (n=1015), but sought alternative informants when a biological mother or father was either deceased or unable to be interviewed. A total of 884 biological mothers participated. Of the 131 living probands for whom a biological mother could not be interviewed, 51 had a non-biological mother or a maternal aunt or uncle who agreed to participate. Thus, we achieved maternal informants for 935 of the 1015 living probands (92%). A total of 756 biological fathers participated. Of the 259 living probands for whom a biological father could not be interviewed, 98 had a non-biological father or a paternal aunt or uncle who agreed to be interviewed. Thus, we achieved paternal informants for 854 of the 1015 living probands (84%).
Family members
All three informants reported for members of 790 families (80.5%), two informants reported for members of 154 families (15.7%), and one informant reported for members of 37 families (3.8%). Combining data from the three informants resulted in data for 7856 biological family members from 981 proband families (average of 8.0 family members; range 3–16). These include 3764 first-degree relatives (981 biological mothers, 974 biological fathers and 1809 full siblings) and 4092 second-degree relatives (1845 biological grandmothers, 1817 biological grandfathers and 430 half siblings).
Measures
Family history reports
Family history reports were obtained from each informant as follows. First, we obtained a family pedigree list for the proband by asking about the sex, age (or age at death) and relatedness of the proband's biological family members, following the methods of Thompson et al. (Reference Thompson, Kidd and Weissman1980). Second, the psychiatric health history of each family member was assessed using the Family History Screen (FHS; Weissman et al. Reference Weissman, Wickramaratne, Adams, Wolk, Verdeli and Olfson2000). We chose this instrument because it has been shown to be valid and reliable, as well as economical for data collection in large samples, and feasible when some family members are not available for direct interview (Weissman et al. Reference Weissman, Wickramaratne, Adams, Wolk, Verdeli and Olfson2000). To minimize under-reporting, the FHS uses pairs of questions to ascertain each symptom. A broadly sensitive ‘introductory-screen’ question is first asked to stimulate memory and give the informant time to reflect [e.g. ‘Has (names on the pedigree list) ever had a sudden spell or attack in which they felt frightened or panicked?’]. If any family members are named in response to the introductory question, this is followed by a second, narrower ‘symptom-definition’ question [e.g. ‘Has (names on the pedigree list) had several attacks, of extreme fear or panic, even though there was nothing to be afraid of?’]. For data analysis purposes, only the second question in a pair is used.
To broaden the FHS's coverage, we added items drawn from the Diagnostic Interview Schedule (DIS; Robins et al. Reference Robins, Helzer, Croughan and Ratcliff1981, Reference Robins, Cottler, Bucholz and Compton1995), the Short Michigan Alcoholism Screening Test (Selzer et al. Reference Selzer, Vinokur and Van Rooijen1975) and the Drug Abuse Screening Test (Skinner, Reference Skinner1982). We also added a checklist of psychiatric conditions commonly understood by the public (e.g. ‘alcoholism’, ‘depression’), the asthma item from the National Heart, Lung and Blood Institute Family Heart Study (Higgins et al. Reference Higgins, Province, Heiss, Eckfeldt, Ellison, Folsom, Rao, Sprafka and Williams1996) and an item asking whether family members were ever a smoker. In total, there were symptom-definition items pertaining to major depressive episode (four items), anxiety (13 items on generalized anxiety, panic, agoraphobia, phobia and obsessive-compulsive disorder), schizophreniform disorder (eight items), conduct disorder (eight items), alcohol dependence (three items), drug dependence (three items), suicide attempt (two items), smoking (one item) and asthma (one item). Following the recommendations of Vandeleur et al. (Reference Vandeleur, Rothen, Jeanpretre, Lustenberger, Gamma, Ayer, Ferrero, Fleischmann, Besson, Sisbane and Preisig2008), a family member was considered to have a positive history of a disorder if one or more of the disorder's items were endorsed by at least 50% of informants (i.e. two of three informants, one of two informants, or one of one informant).
Family history scores
One dichotomous score and three density scores were computed. Each score took account of biological relatedness by giving first-degree relatives double the weight of second-degree family members (as described below). The scores were as follows.
(1) Dichotomous
This defines probands as ‘family history positive’ if one or more of a proband's first-degree family members (or, equivalently, two or more of a proband's second-degree family members) had a positive history of disorder.
(2) Observed number of disordered family members, weighted by relatedness
This is a simple count of the number of family members with a positive history of disorder, with a count of ‘1’ given for each first-degree family member and a count of ‘0.5’ given for each second-degree family member. This method takes account of density of disorder (i.e. number of family members with disorder).
(3) Proportion of disordered family members, weighted by relatedness
This is the count in (2) above, divided by the number of family members (again, with a count of ‘1’ given for each first-degree family member and a count of ‘0.5’ given for each second-degree family member). This method takes account of density of disorder and family size.
(4) Reed's score
This is  where O is the observed number of family members with a positive history of disorder (i.e. the count in (2) above), and E is the expected number of family members with a positive history of disorder, given the age and sex of each family member and the age- and sex-specific prevalence of the disorder. Simulations suggest Reed's score performs best of all methods relating observed to expected rates (Murad et al. Reference Murad, Kalter-Leibovici, Chetrit and Freedman2007). We made two modifications to the method of Reed et al. (Reference Reed, Wagener, Donahue and Kuller1986). First, to take account of relatedness (in line with scores above), first-degree relatives were given double the weight of second-degree relatives when calculating observed and expected totals. Second, because we did not collect the data necessary to determine age-at-first-incidence of disorder for each family member in our sample, we calculated expected rates based on prevalence of disorder and not incidence of disorder. Thus, for each disorder, we determined the expected probability of a family member ever having had the disorder by calculating the prevalence of that disorder by sex and 5-year age band (⩽20, 21–25, …, 86–90, >90 years), using data derived from probands and family members in this sample. Reed's score takes account of density of disorder, family size and family demographic structure (i.e. the age and sex of each family member).
Proband outcomes
There were proband outcomes for each disorder for which family history data were available (i.e. for seven psychiatric disorders, as well as for smoking and asthma).
Psychiatric disorders
The psychiatric assessment of Dunedin probands has been described in detail elsewhere (Kim-Cohen et al. Reference Kim-Cohen, Caspi, Moffitt, Harrington, Milne and Poulton2003). Briefly, proband psychiatric disorder was assessed using the Diagnostic Interview Schedule for Children (Costello et al. Reference Costello, Edelbrock, Kalas, Kessler and Klaric1982) at younger ages (11–15 years) and the DIS (Robins et al. Reference Robins, Helzer, Croughan and Ratcliff1981, Reference Robins, Cottler, Bucholz and Compton1995) at older ages (18–32 years), with a past-year reporting period at each age. At ages 11, 13 and 15 years diagnoses were made using the then-current Diagnostic and Statistical Manual of Mental Disorders (DSM), version 3 (DSM-III; APA, 1980), at ages 18 and 21 years according to the then-current DSM-III-R (APA, 1987) criteria, and at ages 26 and 32 years according to DSM-IV (APA, 1994) criteria. Diagnoses were derived as follows. We assessed conduct disorder in childhood: those who were diagnosed with conduct disorder at any of ages 11, 13, 15 or 18 years were considered to have a childhood diagnosis of conduct disorder. In adulthood we assessed major depressive episode, anxiety (generalized anxiety disorder, phobia, agoraphobia, panic disorder, obsessive-compulsive disorder and post-traumatic stress disorder), schizophreniform disorder, alcohol dependence and drug dependence. For each disorder, those who were diagnosed with that disorder at any of ages 21, 26 and 32 years were considered to have an adult diagnosis of disorder. We assessed suicide attempt in adolescence and adulthood: those who reported a lifetime suicide attempt at any of ages 15, 18, 21, 26 or 32 years were considered to have attempted suicide in their lifetime.
Smoking
Those who reported that they had smoked daily for at least 1 month of the previous year at any of the assessments at ages 15, 18, 21, 26 and 32 years were considered to have ‘ever been a smoker’.
Asthma
Those who presented with current asthma at any of the assessments at ages 9, 11, 13, 15, 18, 21, 26 and 32 years were considered to have ‘ever had asthma’. Further details on the assessment of asthma are available in Sears et al. (Reference Sears, Greene, Willan, Taylor, Flannery, Cowan, Herbison and Poulton2002).
As described above, we based diagnoses for each outcome on a cumulative count of cases, each of which was ascertained in a past-year assessment. Using this prospective approach, cases are not under-counted due to failure to recall criterion symptoms from years past, as occurs in retrospective surveys (Simon & VonKorff, Reference Simon and VonKorff1995). Moreover, we have shown that there is very little case under-counting as a result of the gaps between past-year assessments. For example, only eight cohort members who had received mental-health services in the years between assessments had not been diagnosed by the study's repeated psychiatric interviews (Moffitt et al. Reference Moffitt, Harrington, Caspi, Kim-Cohen, Goldberg, Gregory and Poulton2007). These eight cases had received services for either depression or anxiety; no cases of psychosis, suicide or substance abuse were missed.
Statistical methods
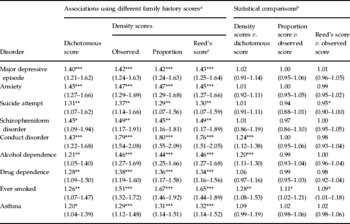
For each disorder, associations between family history and diagnosis of disorder was assessed by conducting four logistic regression models, one with each family history score as a predictor (Table 1). The binary outcome in each model was the proband's disorder. Each model controlled for sex. So that predictive validity could be compared across family history scores, each score was z-standardized (mean=0 and standard deviation=1).
Family history associations using four different family history scores and statistical comparison of the family history score methods
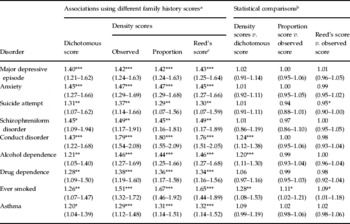
a Sex-adjusted odds (95% confidence intervals) of the proband having the disorder associated with a 1 standard deviation change in the family history score for that disorder (family history scores have been z-standardized).
b Statistical comparison of the family history score methods. Odds ratios (95% confidence intervals) for tests of whether the associations between family history and disorder differ for different family history score methods.
c Reed et al. (Reference Reed, Wagener, Donahue and Kuller1986).
* p<0.05, ** p<0.01, *** p<0.001.
To compare the predictive validity of the dichotomous score versus the three density scores, we conducted the following logistic regression model for each disorder outcome:

where Y i represents the disorder status of proband i (0=non-disordered, 1=disordered), X ij represents the family history score for proband i and family history score j (z-standardized as described above) and X j represents the family history score method j (0=dichotomous, 1=density). The coefficient of interest here is βFD, which tests whether the association between family history and disorder varies according to whether the method used to estimate family history is dichotomous or takes account of density of disorder (Table 1; statistical comparisons). As there are four family history scores (one dichotomous and three density), this model contains four observations per proband.
To compare the predictive validity of the three density scores, we restricted analyses to those three scores and conducted a second logistic regression model for each disorder outcome. We chose the simplest, observed score as the reference category when comparing family history scores. Thus, we modelled:

where the Y i and X ij terms are the same as in model (1), X P represents the effect of the proportion score relative to the observed score (1=proportion score, 0=other scores), and X R represents the effect of Reed's score relative to the observed score (1=Reed's score, 0=other score). The coefficients of interest here are βFP, which tests whether the association between family history and disorder is different for the proportion versus the observed score (Table 1; statistical comparisons), and βFR, which tests whether the association between family history and disorder is different for Reed's score versus the observed score (Table 1; statistical comparisons). As there are three family history scores, this model contains three observations per proband.
Because models (1) and (2) involve multiple observations per subject, standard error estimates were adjusted based on the sandwich or Huber–White variance estimator (Williams, Reference Williams2000) to account for the lack of independence in the data. Both models (1) and (2) controlled for sex.
All analyses were conducted using stata 9.1 (StataCorp, 2005).
Results
Table 1 shows the association between family history and disorder outcome for the four family history scores, and statistical comparisons of the associations produced by these four scores. The table shows that there were significant associations between family history and proband disorder outcome for all psychiatric disorders, as well as for smoking and asthma. These results held across the four family history scores, with odds of disorder associated with a 1 standard deviation increase in family history score ranging from 1.2 (asthma) to 1.8 (conduct disorder).
The statistical comparisons of Table 1 reveal two main findings. First, there was some evidence that density scores had greater predictive validity than the dichotomous score: the density scores performed slightly better for all disorders, and performed significantly better for conduct disorder, alcohol dependence and smoking.
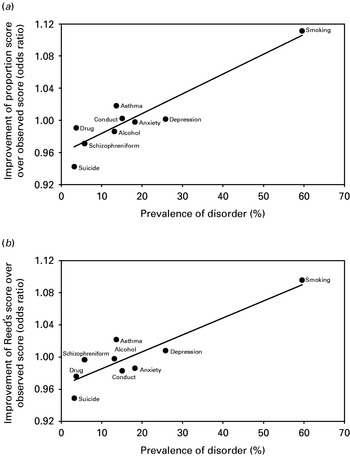
Second, among density scores, there was evidence that the proportion score and Reed's score were more predictive than the observed score (i.e. the observed number of family members with a positive history of disorder) for one outcome only: smoking. Moreover, compared with the observed score, Reed's score was actually less predictive of disorder for suicide attempt. We were surprised that the proportion score and Reed's score performed no better than the observed score for psychiatric disorders and asthma, because it suggests that the risk conveyed by having a number of family members with disorder is the same regardless of family size and family demographic structure. As smoking was far more prevalent among family members (prevalence=59.6%) than the other disorders (prevalence ranged from 3.3% for suicide attempt to 25.8% for major depressive episode), we hypothesized that taking account of family size and family demographic structure may be important for prevalent disorders only. To test this, we plotted the odds ratios assessing the difference between the proportion score and the observed score against the prevalence for each disorder (Fig. 2a) and the odds ratios assessing the difference between Reed's score and the observed score against the prevalence for each disorder (Fig. 2b). In support of our hypothesis, there was a strong positive correlation between the extent to which the proportion score was an improvement on the observed score and prevalence of disorder in family members (r=0.93, Fig. 2a). Similarly, there was a strong positive correlation between the extent to which Reed's score was an improvement on the observed score and prevalence of disorder in family members (r=0.91, Fig. 2b). Correlations were still strong if smoking, which is likely to exert a strong effect on the magnitude of the correlations, was excluded from analyses (r=0.65 and r=0.58, respectively).
Scatter-plots of prevalence of psychiatric disorders, smoking and asthma in family members versus the odds ratio assessing the difference in estimates of family history associations between the proportion score and the observed score (a), and versus the odds ratio assessing the difference in estimates of family history associations between Reed's score (Reed et al. Reference Reed, Wagener, Donahue and Kuller1986) and the observed score (b). The solid lines in each plot are fitted regression lines; Pearson's correlation coefficients are r=0.93 for (a) and r=0.91 for (b). Correlations were still strong if smoking, which is likely to exert a strong effect on the magnitude of the correlations, was excluded from analyses [r=0.65 for (a) and r=0.58 for (b)].

Discussion
This study described the methods of the DFHHS and estimated associations between family history and disorder using four different family history scores. We found significant associations for all disorders across all family history scores, with odds of disorder associated with a 1 standard deviation increase in family history score ranging from 1.2 (asthma) to 1.8 (conduct disorder).
Are family history associations stronger for density versus dichotomous scores?
For all disorders, the measures we tested that took account of density of disorder (i.e. the number of family members with disorder) performed slightly better than a measure that dichotomized probands based on the presence or absence of disorder in at least one first-degree relative. Taking account of density of disorder is likely to be most beneficial for alcohol dependence, conduct disorder and smoking, for which the density measures produced family history associations that were significantly stronger than the family history associations produced by the dichotomous method.
Does taking account of family size and family demographic structure produce stronger family history associations?
The extent to which taking account of family size produced stronger family history associations was determined in part by the prevalence of disorder in family members. Thus, for most disorders, we found very little difference between the density scores we computed based on a count of disordered family members (‘observed’) and the density scores we computed that took account of family size (‘proportion’ and ‘Reed's score’). However, for smoking, a very prevalent phenotype among family members, both the proportion score and Reed's score produced stronger family history associations. Conversely, for suicide attempt, a rare phenotype among family members, Reed's score actually produced weaker family history associations. A possible explanation for this pattern of results is that an increase in family size is more likely to be associated with an increase in affected family members for prevalent than for non-prevalent disorders. Thus the need to take account of family size is likely to increase with increasing prevalence of disorder.
Taking account of family demographic structure did not appear to convey any benefits over and above those conveyed by taking account of family size.
Do our findings using psychiatric disorders generalize to non-psychiatric disorders?
Our finding that density scores tend to produce stronger family history associations than dichotomous scores generalized to the two non-psychiatric outcomes we tested: smoking and asthma. Also, our finding that the best method to assess family history depends on the prevalence of disorder appeared to apply to smoking and asthma as well as to psychiatric disorders. More work is needed to determine whether this phenomenon is universal across health domains.
Strengths
The present study has a number of strengths. First, we obtained family history reports from multiple informants. This has been shown to help avoid under-reporting, a common problem of the family history method (Kosten et al. Reference Kosten, Anton and Rounsaville1992; Weissman et al. Reference Weissman, Wickramaratne, Adams, Wolk, Verdeli and Olfson2000; Hardt & Franke, Reference Hardt and Franke2007). Moreover, by collecting reports from multiple informants we avoided the biases associated with estimating family history solely from proband reports. That is, because informants with a psychiatric history of disorder tend to over-report that same disorder in family members (Kendler et al. Reference Kendler, Silberg, Neale, Kessler, Heath and Eaves1991; Chapman et al. Reference Chapman, Mannuzza, Klein and Fyer1994; Roy et al. Reference Roy, Walsh and Kendler1996; Heun et al. Reference Heun, Maier and Müller1997; Coelho et al. Reference Coelho, Cooper and Murray2006), relying solely on probands as informants would result in artefactual differences between disordered and non-disordered probands in terms of their family history.
Second, we were able to take advantage of our longitudinal design to prospectively assess disorder in the probands at a number of ages, and derived diagnoses by combining data across ages. In this way we were able to assess the association between family history and disorder using a measure of disorder that is not prone to biases associated with retrospective recall (Simon & Vonkorff, Reference Simon and VonKorff1995).
Third, our findings were derived from a representative, population-based sample, so are likely to be applicable to population-based uses of family history (e.g. whole genome scans, public health screening programmes).
Fourth, we compared results across a number of psychiatric disorders as well as two non-psychiatric outcomes, so were able to test the generality of our findings. Moreover, studying a number of disorders at the one time enabled us to uncover patterns across disorders, e.g. the correlation between prevalence of disorder and the extent to which taking account of family size produced stronger family history associations. This correlation would not have been apparent if we had limited our analyses to just one or two disorders.
Limitations
Our findings should be interpreted in the context of the following limitations. First, our sample of probands consists of a primarily white birth cohort born in New Zealand in 1972–1973. Although our findings regarding the familiality of psychiatric disorder are consistent with the literature (Kendler et al. Reference Kendler, Davis and Kessler1997; Miles et al. Reference Miles, Stallings, Young, Hewitt, Crowley and Fulker1998; Sullivan et al. Reference Sullivan, Neale and Kendler2000; Bandelow et al. Reference Bandelow, Späth, Tichauer, Broocks, Hajak and Rüther2002, Reference Bandelow, Torrente, Wedekind, Broocks, Hajak and Rüther2004; Byrne et al. Reference Byrne, Agerbo and Mortensen2002; Klein et al. Reference Klein, Lewinsohn, Rohde, Seeley and Shankman2003; Qin et al. Reference Qin, Xu, Laursen, Vestergaard and Mortensen2005; Newman & Bland, Reference Newman and Bland2006; Coelho et al. Reference Coelho, Cooper and Murray2007), our new findings regarding the relative merits of density and dichotomous scores need to be tested in other settings and with other ethnic groups.
Second, although we did our best to ensure the validity of family history reports (e.g. by using a validated instrument and by obtaining reports from multiple informants), the validity of the family history method is known to be inferior to directly interviewing every relative (Orvaschel et al. Reference Orvaschel, Thompson, Belanger, Prusoff and Kidd1982; Andreason et al. Reference Andreasen, Rice, Endicott, Reich and Coryell1986; Rice et al. Reference Rice, Reich, Bucholz, Neuman, Fishman, Rochberg, Hesselbrock, Nurnberger, Schuckit and Begleiter1995; Roy et al. Reference Roy, Walsh and Kendler1996; Davies et al. Reference Davies, Sham, Gilvarry, Jones and Murray1997; Vandeleur et al. Reference Vandeleur, Rothen, Jeanpretre, Lustenberger, Gamma, Ayer, Ferrero, Fleischmann, Besson, Sisbane and Preisig2008). However, we chose to use the family history method because it is an inexpensive way to collect family history data on all relatives in a family. Also, it is not subject to the ascertainment bias associated with direct interviews, whereby those relatives able to be interviewed may have less psychopathology than those relatives unable to be interviewed due to death, estrangement or unwillingness to take part (Davies et al. Reference Davies, Sham, Gilvarry, Jones and Murray1997).
Third, when calculating Reed's score to take account of family demographic structure, we calculated expected rates based on prevalence of disorder rather than incidence of disorder. We took this approach because, to our knowledge, there are no published sex- and age-specific incidence rates for psychiatric disorders for the population we investigated. It is possible that this approach compromised our ability to assess the merits of Reed's score. However, studies of cardiovascular disease that have used incidence rates to calculate Reed's score have reached the same conclusion as us: that it adds little or no benefit over and above a proportion score (Silberberg et al. Reference Silberberg, Fryer, Wlodarczyk, Robertson and Dear1999; Murad et al. Reference Murad, Kalter-Leibovici, Chetrit and Freedman2007).
Implications for family history researchers
With these limitations in mind, implications of our findings can be noted. First, for conduct disorder, alcohol dependence and smoking, researchers would benefit from assessing family history using density scores. Second, for other disorders, in particular depression, anxiety, suicidality and schizophrenia, family history can be adequately assessed using dichotomous scores. Third, the choice of density score depends upon the prevalence of disorder in family members. For disorders with very low prevalence (e.g. suicide), a simple count of family members with disorder should be preferred. For disorders with low to moderate prevalence, either a count score or a score calculated as the proportion of family members with disorder will suffice. For disorders with high prevalence (e.g. smoking), a proportion score should be preferred.
The use of family history data is vital for many areas of psychiatry. However, family history will only be as good as the scores that are used to measure it, so getting this right is important. We hope this comparative analysis will help researchers decide the best family history score to use.
Acknowledgements
The present study was supported by grants from the US National Institute of Mental Health (grants MH45070, MH49414 and MH077874), the UK Medical Research Council (G0100527), the William T. Grant Foundation and the Health Research Council of New Zealand. A.C. holds a Royal Society Wolfson Merit Award. We thank the Dunedin Study members and their families and friends, Unit research staff, HonaLee Harrington, Wendy Slutske, Lucy Tully and study founder Phil Silva.
Declaration of Interest
None.