- CD
Circular dichroism
- DEPC
diethylpyrocarbonate
- DMS
dimethyl sulfate
- Kethoxal
α-keto-β-ethoxybutyraldehyde
- K Mg
Mg2+ concentration at the midpoint of an RNA folding transition
- n
the Hill constant
- m
the free energy dependence on the urea concentration
- U
unfolded
- Ieq
equilibrium intermediate
- N
native; SAXS, small-angle X-ray scattering
- TL
tetraloop.
1. Introduction
The identification of hundreds of thousands of new RNA transcripts in eukaryotes (Kapranov et al. Reference Kapranov, Cawley, Drenkow, Bekiranov, Strausberg, Fodor and Gingeras2002; Bertone et al. Reference Bertone, Stolc, Royce, Rozowsky, Urban, Zhu, Rinn, Tongprasit, Samanta and Weissman2004; Stolc et al. Reference Stolc, Gauhar, Mason, Halasz, van Batenburg, Rifkin, Hua, Herreman, Tongprasit and Barbano2004) demonstrates that much remains to be discovered about the role of large RNAs in the cell. According to a recent account, the number of human RNA transcripts containing more than 150 residues is at least 10 times greater than the number of mRNAs (Cheng et al. Reference Cheng, Kapranov, Drenkow, Dike, Brubaker, Patel, Long, Stern, Tammana and Helt2005). Functional non-coding RNAs often require that they fold to structures with specific secondary structure, and in many instances, tertiary structure. Hence, even if a small fraction of human RNA transcripts are functional and non-coding, many thousands of structured RNAs are likely present in a human cell. These observations emphasize that RNA folding studies are increasingly crucial in our understanding of the extensive involvement of RNA in many cellular activities.
RNase P is an essential enzyme required for the maturation of all tRNAs (Frank & Pace, Reference Frank and Pace1998; Altman & Kirsebom, Reference Altman, Kirsebom, Gesteland, Cech and Atkins1999). The bacterial RNase P is composed of a large RNA subunit [300–450 nucleotides (nt)] and a small protein subunit (∼120 amino acids). The archaeal RNase P is composed of one large RNA subunit and about four proteins. The eukaryotic RNase P is composed of a large RNA subunit and >8 protein subunits. The bacterial RNase P RNA is the catalytic subunit of this enzyme; it contains the active site and another major binding site of the precursor tRNA substrate. As a ribozyme, bacterial RNase P has been the focus of structure and function studies for over two decades.
We have been studying the folding of bacterial RNase P RNA (P RNA) since 1997. These studies focus on Mg2+-induced folding as well as the more biologically relevant, folding during the transcription process (Pan et al. Reference Pan, Artsimovitch, Fang, Landick and Sosnick1999a; Wong et al. Reference Wong, Sosnick and Pan2005). A summary of RNase P RNA folding during transcription has been reviewed elsewhere (Pan & Sosnick, Reference Pan and Sosnick2006). The current review focuses on the thermodynamic, kinetic and structural understanding of Mg2+-induced folding of RNase P RNA.
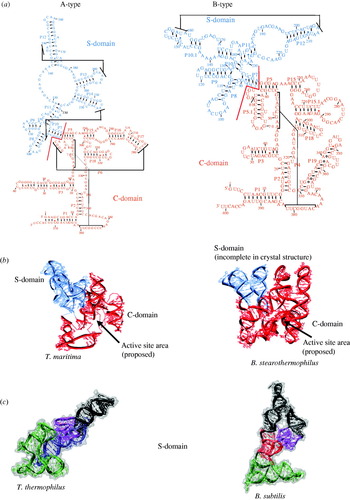
Our folding studies primarily focused on the two folding domains of bacterial RNase P RNA. Bacterial P RNA is classified in two types according to their differences in the phylogenetically derived secondary structures (Brown, Reference Brown1999) (Fig. 1a). The ancestral or A-type P RNA has over 300 members and is distributed among many branches of bacteria. The Bacillus or B-type P RNA has ∼40 members and is confined within Gram-positive bacteria. The A- and B-type RNase P RNAs have a common catalytic core and a tertiary structure involved in binding the TΨC-stem loop portion of a pre-tRNA substrate. They differ in their peripheral supporting or ‘buttressing’ structures that properly orient and stabilize the common structures required for the catalytic functions (Krasilnikov et al. Reference Krasilnikov, Yang, Pan and Mondragon2003, Reference Krasilnikov, Xiao, Pan and Mondragon2004; Kazantsev et al. Reference Kazantsev, Krivenko, Harrington, Holbrook, Adams and Pace2005; Torres-Larios et al. Reference Torres-Larios, Swinger, Krasilnikov, Pan and Mondragon2005).
(a) Secondary structure presentation of A-type (left) E. coli and B-type (right) B. subtilis RNase P RNA with domains noted. (b) Crystal structures of full-length A-type P RNA from T. maritima PDB code 2A2E.PDB (left), and B-type P RNA from B. stearothermophilus, 2A64.PDB (right). (c) S-domains from A-type T. thermophilus, 1U9S.PDB and B-type B. subtilis, 1NBS.PDB. The four major regions of the S-domain are color coded.

Both A- and B-type P RNA are made of two domains that fold independently from each other (Pan, Reference Pan1995a; Loria & Pan, Reference Loria and Pan1996; Pan & Jakacka, Reference Pan and Jakacka1996) (Fig. 1). These domains were initially discovered using hydroxyl radical protection and functional analysis (Pan, Reference Pan1995a; Loria & Pan, Reference Loria and Pan1996). Crystal structures of both domains have been solved recently (Krasilnikov et al. Reference Krasilnikov, Yang, Pan and Mondragon2003, Reference Krasilnikov, Xiao, Pan and Mondragon2004; Kazantsev et al. Reference Kazantsev, Krivenko, Harrington, Holbrook, Adams and Pace2005; Torres-Larios et al. Reference Torres-Larios, Swinger, Krasilnikov, Pan and Mondragon2005) (Fig. 1b). Both types of P RNA contain a catalytic domain (C-domain) of >220 nt. The C-domain contains the entire active site of this ribozyme. Although this domain lacks a portion of the binding site for the natural, pre-tRNA substrate, an in vitro selected RNA substrate was identified that utilizes a portion of this domain for binding affinity and specificity (Pan & Jakacka, Reference Pan and Jakacka1996). Hence, the folding of the C-domain can be assessed either by itself or in the context of the full-length P RNA by monitoring the catalytic activity with the selected substrate or pre-tRNA, respectively.
Both types of P RNA also contain a specificity domain (S-domain) of >150 nt with four major structural elements (Fig. 1c). The S-domain contains the binding site for the TΨC portion of tRNA. This binding activity is specific and has been used as the functional assay for the folding studies of the S-domain.
2. The native structures of bacterial RNase P RNA
Four crystal structures of P RNA have been determined since 2003 (Krasilnikov et al. Reference Krasilnikov, Yang, Pan and Mondragon2003, Reference Krasilnikov, Xiao, Pan and Mondragon2004; Kazantsev et al. Reference Kazantsev, Krivenko, Harrington, Holbrook, Adams and Pace2005; Torres-Larios et al. Reference Torres-Larios, Swinger, Krasilnikov, Pan and Mondragon2005) (Fig. 1b, c), whereas structures of only small fragments of bacterial RNase P RNA previously were available. The crystal structures are available for two full-length P RNAs (Kazantsev et al. Reference Kazantsev, Krivenko, Harrington, Holbrook, Adams and Pace2005; Torres-Larios et al. Reference Torres-Larios, Swinger, Krasilnikov, Pan and Mondragon2005) and two S-domains (Krasilnikov et al. Reference Krasilnikov, Yang, Pan and Mondragon2003, Reference Krasilnikov, Xiao, Pan and Mondragon2004). It was very fortunate that these four crystal structures are from both A- and B-type P RNAs, allowing for direct visualization of common and idiosyncratic structural elements. With these structures in hand, folding studies of P RNA are no longer limited to describing folding in abstract terms such as percent populations and kinetic rates. Rather, intermediate states can now be described in structural terms at the nucleotide resolution. We will first briefly describe these crystal structures which correspond to the native states in the folding studies.
2.1 The full-length 338-nt A-type P RNA
The structure of the 338-nt, full-length A-type RNase P from Thermotoga maritima was obtained at 3·85 Å resolution (Torres-Larios et al. Reference Torres-Larios, Swinger, Krasilnikov, Pan and Mondragon2005) (Fig. 1b). The S-domain portion of this structure is very similar to the other A-type structure, T. thermophilus S-domain (see Section 2.4) (Krasilnikov et al. Reference Krasilnikov, Xiao, Pan and Mondragon2004). The C-domain is made of just two structural modules: a complicated catalytic core composed of several connecting junction loops between helices and a pseudoknot P4, flanked by several coaxially stacked helices and a peripheral helical structure P6. The active site is located in the vicinity of two junctions, J18/2 and J2/4, and is near loop L15 which binds the 3′-CCA residues in a pre-tRNA substrate (Fig. 1b). There are three interactions between hairpin-loop residues and the minor groove of a helix. The L8 loop–helix P4 interaction places the S-domain four-way junction in the proximity to the active site. The L9 loop–helix P1 interaction and the L18–helix P8 interaction determine the relative orientation of S- and C-domains.
2.2 The full-length 417-nt B-type P RNA
The structure of the 417-nt, full-length B-type RNase P from Bacillus stearothermophilus was obtained at 3·3 Å resolution (Kazantsev et al. Reference Kazantsev, Krivenko, Harrington, Holbrook, Adams and Pace2005) (Fig. 1b). The S-domain portion is again similar to the other B-type, B. subtilis S-domain (see Section 2.3). The C-domain is also made of two structural modules. The catalytic core and the flanking coaxially stacked helices have a comparable structure as the A-type C-domain. However, the peripheral module, in this case between the loops of P5.1 and P15.1 helices, is completely different from the A-type C-domain. This result highlights that a common core structure of a tertiary RNA can be built using peripheral interactions that are placed at different locations and protruding from different regions in the molecule. The B-type P RNA contains just one domain–domain interaction between the L8 loop of the S-domain and the P4 helix of the C-domain. The lack of additional domain–domain interactions likely allows a greater degree of flexibility between the domains in the B-type P RNA as compared to the A-type P RNA.
2.3 The 154-nt specificity domain of a B-type P RNA
The crystal structure of the 154-nt S-domain of a B-type RNase P RNA from Bacillus subtilis was obtained at 3·15 Å resolution (Krasilnikov et al. Reference Krasilnikov, Yang, Pan and Mondragon2003) (Fig. 1c, right). This structure is composed of a four-way helical junction (green), a structural core made of loop–helix interactions (red), a complicated local tertiary structure made of two intertwined loops (purple), and a classical tetraloop–tetraloop receptor (TL receptor) (black). The four-way junction is the base of the structure, on which the core is built on. The intertwined loops protrude from the core and present the GAAA TL for interaction with its receptor, which is embedded in a helix extended from another portion of the core. A portion of the four-way junction and the J11/12 loop structure form the walls of the cavity where binding of the TΨC-stem loop of the tRNA takes place.
2.4 The 160-nt specificity domain of an A-type P RNA
The second crystal structure is the 161-nt S-domain of an A-type RNase P RNA from Thermus thermophilus at 2·9 Å resolution (Krasilnikov et al. Reference Krasilnikov, Xiao, Pan and Mondragon2004) (Fig. 1c, left). The A-type S-domain differs in secondary and even some portions of the tertiary structure from the B-type S-domain. Despite these differences, the tRNA binding portion of the domains has a very similar three-dimensional structure. The similar geometry of the tRNA binding region is fixed by different sets of interactions involving distinct auxiliary elements, providing a case of using distinct peripheral structures (blue) to orient and stabilize the same functional ‘core’. The common structure of A- and B-type S-domains is made of two intertwined T loop motifs (J11/12) and a four-way junction positioned in very similar orientations. The A-type S-domain has two peripheral structures made of a loop–loop interaction between P12 and P13, and a P14 GNRA TL–P8 helix interaction connecting the J11/12 structure to the four-way junction. The B-type S-domain also has two peripheral structures supporting the functional ‘core’; one is made of the aforementioned GAAA TL receptor between P12 and P10.1, and the other a T loop motif at the end of P10.1 interacting with the junction of P7/P10, which is a part of the four-way junction.
3. Experimental methods
3.1 Methods
A variety of biophysical and biochemical methods have been applied in folding studies of P RNA. Spectroscopic methods include absorbance, circular dichroism (CD) and fluorescence (Fig. 2). These methods can track changes in secondary and tertiary structure (Pan & Sosnick, Reference Pan and Sosnick1997), and the local environments around chromophores (Fang et al. Reference Fang, Pan and Sosnick1999a). Small-angle X-ray scattering (SAXS) follows the change in the overall size and shape of the RNA during folding (Fang et al. Reference Fang, Littrell, Yang, Henderson, Siefert, Thiyagarajan, Pan and Sosnick2000). Chemical and enzymatic cleavage monitor the changes in the exposure of selected residues upon folding (Zarrinkar et al. Reference Zarrinkar, Wang and Williamson1996; Kent et al. Reference Kent, Chaulk and MacMillan2000; Baird et al. Reference Baird, Westhof, Qin, Pan and Sosnick2005). Functional assays include catalytic activity for the C-domain, and tRNA binding for the S-domain (Pan et al. Reference Pan, Fang and Sosnick1999b). Molecular modeling can be used to build structural models of the folding intermediates with the residue-level resolution (Baird et al. Reference Baird, Westhof, Qin, Pan and Sosnick2005).
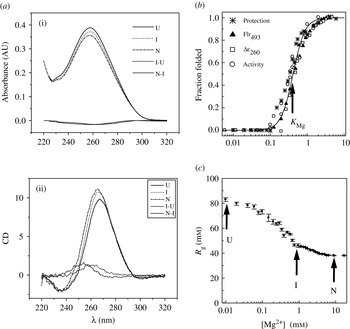
(a) Absorbance (i) and circular dichroism (ii) spectra of the S-domain under solution conditions where one of the three major states [unfolded (U), intermediate (I) or native (N) state], is predominantly populated. Also shown are the difference spectra for the unfolded-to-intermediate transition and the intermediate-to-native transition. (b) Folding as a function of [Mg2+] monitoring (b) hydroxyl radical protection, fluorescence of a fluoroscein, CD260 nm, catalytic activity and (c) the radius of gyration (R g) for the C-domain obtained by SAXS. A fit using a Hill-style analysis (solid line) with a transition midpoint, K Mg, where half the molecules have folded to the native state is shown in panel (b).

3.1.1 Spectroscopy
UV absorbance has been extensively used to monitor structural changes in RNA (Turner & Sugimoto, Reference Turner and Sugimoto1988; Puglisi & Tinoco, Reference Puglisi and Tinoco1989). Folding involves the formation of additional or enhanced stacking of nucleotide bases. This change results in a decrease in the UV absorbance (hypochromicity). Changes in UV absorbance during folding can track the formation of folding intermediates (Fig. 2a) (Pan & Sosnick, Reference Pan and Sosnick1997; Fang et al. Reference Fang, Pan and Sosnick1999b). In many instances, however, the folding transition leading to the native structure does not result in a change in base stacking sufficient to be detected by UV absorbance. This transition can involve only the formation of tertiary interactions that do not increase base stacking or change the absorbance properties of the RNA.
We have helped pioneer the use of CD spectroscopy to study tertiary RNA folding (Pan & Sosnick, Reference Pan and Sosnick1997; Sosnick et al. Reference Sosnick, Fang and Shelton2000). CD has been extensively used for protein folding (Woody, Reference Woody1995). Here, large changes in the far-UV signal are observed upon the formation of secondary structures (α-helices and β-sheets). The changes also are observed in the near-UV signal indicating that aromatic residues, particularly tryptophan, become buried in chiral environments. Quantitative CD studies of RNA secondary structure formation exist (SantaLucia et al. Reference SantaLucia, Kierzek and Turner1990; Gray et al. Reference Gray, Hung and Johnson1995). Changes in the CD signal accompanying tertiary RNA folding, however, generally are much less than those observed in protein folding or RNA secondary structure transitions. In many instances, this change is only ∼0·2 mdeg at an RNA concentration giving an A 260 absorbance of 0·3–0·6 AU (Fig. 2a). We have found such small changes could only be reliably detected using automated titrators injecting and/or removing small aliquots of sample into a stirred cuvette. Using such methods, a measurable CD change has been observed in the folding transition to the native state for the tertiary RNAs we have studied (P RNA and its domains, and tRNA). The molecular basis of these CD changes is not well understood, particularly those centered at λ∼260–290 nm, which tend to be the largest in magnitude.
Because the natural RNA bases are not intrinsically fluorescent, specific fluorophores have to be incorporated into the RNA to monitor folding using fluorescence. A general, ligation-based method using DNA oligonucleotide splint is, in theory, the best method to incorporate fluorophore at any location (Moore & Sharp, Reference Moore and Sharp1992). In practice, however, the yield of this method is very context dependent, and is particularly sensitive to the extensive structures of the RNA molecules we study. Therefore, we used a transcription-based method to incorporate a 5′-fluorophore of any RNA that begins with a G by the inclusion of a fluorophore-G compound in the transcription mixture (Fang et al. Reference Fang, Pan and Sosnick1999a, Reference Fang, Pan and Sosnickb). This compound can only be incorporated at the 5′-end of the RNA. Although only ∼10% of the RNA transcript actually has an attached fluorophore, this method allows convenient preparation of a large amount of sample for spectroscopic studies. The usefulness of a 5′-fluorophore in monitoring P RNA folding to the native state is a ‘hit-or-miss’ affair, as is the incorporation of fluorophores at any location via DNA oligonucleotide splints. The strategy worked well for the study of a B-type C-domain (Fang et al. Reference Fang, Pan and Sosnick1999a), but the fluorescence signal remained unchanged in the folding of a B-type S-domain (X.-W. Fang, T. Pan & T. Sosnick, unpublished results).
3.1.2 Small-angle X-ray scattering
SAXS is an ideal tool to measure the dimensions of macromolecules in solution (Svergun & Koch, Reference Svergun and Koch2003). The technique is particularly useful for the characterization of unfolded or intermediates states which are not readily studied by high-resolution techniques. X-rays are scattered at low angles by the molecules in solution, and the scattering profile can be used to generate the radius of gyration (R g) and the pair-distribution function, P(r), of the molecule (Cantor & Schimmel, Reference Cantor and Schimmel1980). This function is the probability distribution of vector lengths within the particle.
The application of SAXS to RNA folding became practical with the availability of synchrotron X-ray sources [e.g. at the advanced photon source (APS) at the Argonne National Laboratory]. Here, the amount of RNA sample required per measurement is ∼0·3 mg/ml RNA in a ∼200 μl volume. This modest requirement makes sample preparation tenable using in vitro transcription methods, and detailed Mg2+ or urea titrations are feasible. The low RNA concentration also minimizes the reduction of the free Mg2+ concentration arising from non-specific interactions of ion–RNA (2–4 ions per base pair). This reduction in [Mg2+]free increases the amount of the ion required to fold the RNA, i.e. apparent midpoint of the folding transition (see Section 4.1).
3.1.3 Chemical and enzymatic footprinting
A battery of chemical and enzymatic probes has been used extensively in structural and functional studies of RNA (Ehresmann et al. Reference Ehresmann, Baudin, Mougel, Romby, Ebel and Ehresmann1987). Chemical probes react specifically with nucleotide bases or the ribophosphate backbone with the reactivity largely depending on the exposure of these moieties. Hydroxyl radical is the most popular probe used in RNA folding studies (Latham & Cech, Reference Latham and Cech1989; Celander & Cech, Reference Celander and Cech1991). This highly reactive chemical likely abstracts a hydrogen atom from the ribose, leading to the formation of reactive oxygen and subsequent strand scission of the RNA. Hydroxyl radicals can be generated in the laboratory on the order of seconds to minutes (Kent et al. Reference Kent, Chaulk and MacMillan2000), and at the synchrotron on the order of ten milliseconds (Sclavi et al. Reference Sclavi, Woodson, Sullivan, Chance and Brenowitz1997). Hence, hydroxyl radical reaction can cover the large range of time-scales relevant to RNA folding. Other chemicals utilized in RNA folding studies include dimethyl sulfate (DMS), kethoxal (α-keto-β-ethoxybutyraldehyde) and diethylpyrocarbonate (DEPC) which react with A, C and G bases (Cheng et al. Reference Cheng, Kapranov, Drenkow, Dike, Brubaker, Patel, Long, Stern, Tammana and Helt2005). The chemically modified bases are then detected through primer extension.
Ribonucleases T1 and V1 detect the exposure of nucleotide bases (Ehresmann et al. Reference Ehresmann, Baudin, Mougel, Romby, Ebel and Ehresmann1987). T1 is specific for guanosines located in single-stranded regions, so more cleavage is expected when the RNA is less structured. Ribonuclease V1, however, cleaves RNA residues with pronounced base stacking, so increased reactivity is expected when the RNA is more structured. The nuclease assays are technically more convenient than those with the chemical reagents listed above because the number of steps involved is much fewer.
3.1.4 Functional activity
Two functional assays have been used to monitor folding of P RNA and its domains, catalytic activity and pre-tRNA binding (Pan et al. Reference Pan, Fang and Sosnick1999b). The full-length P RNA cleaves the pre-tRNA substrate only when both of the domains are folded. When the C-domain is folded, irrespective of whether the S-domain is folded, the full-length P RNA also cleaves an in vitro selected RNA substrate that only binds to the C-domain (Pan, Reference Pan1995b). Therefore, the combined use of the pre-tRNA and the selected substrate can be used to identify the native state of P RNA, as well as intermediate states where the C-domain is folded. The same selected substrate has been used to monitor folding of the C-domain constructs in the absence of the S-domain (Fang et al. Reference Fang, Pan and Sosnick1999a, Reference Fang, Pan and Sosnickb).
The S-domain by itself specifically binds pre-tRNA substrate, and can competitively inhibit substrate cleavage by the full-length P RNA (Qin et al. Reference Qin, Sosnick and Pan2001). However, the dissociation constant of the S-domain to pre-tRNA substrate is K d∼1 μm. Consequently, this competition assay can only be used at micromolar concentrations for S-domain folding studies. It has not been applied in the thermodynamic folding studies which generally are conducted at submicromolar RNA concentration to minimize the depletion of free Mg2+ ion due to non-specific ion-RNA interactions.
3.1.5 Molecular modeling of folding intermediates
The availability of the P RNA crystal structures along with the multiple types of experimental data provide the starting points and constraints, respectively, for the building of nucleotide-level resolution models of folding intermediate using the Westhof group's molecular modeling software MANIP (Massire et al. Reference Massire, Jaeger and Westhof1998). Two types of experimental data have been used in the modeling studies. SAXS provides information on the size and overall shape while chemical and nuclease mapping measurements provide residue-level information on the exposure, and hence conformation of selected nucleotides. The user of the molecule modeling software creates models starting from the native structure by progressively eliminating contacts, primarily tertiary, as identified by the mapping experiments to produce a family of structures consistent with the size and shape constraints provided by SAXS measurements.
3.2 Data analysis
3.2.1 Equilibrium folding transitions
The stability of a natively folded RNA directly reflects the fraction of molecules that are folded in the native conformation. One can use the Hill equation to fit an RNA folding curve. This provides a useful, albeit semi-empirical quantitative description of the Mg2+-induced folding transitions of P RNA (Pan & Sosnick, Reference Pan and Sosnick1997; Fang et al. Reference Fang, Pan and Sosnick1999a, Reference Fang, Pan and Sosnickb) and other RNAs (Zarrinkar & Williamson, Reference Zarrinkar and Williamson1996; Doherty & Doudna, Reference Doherty and Doudna1997). Two parameters describe these transitions, the Mg2+ concentration at the midpoint, K Mg, where half the molecules have folded (Fig. 2b), and the degree of cooperativity, the Hill constant n. This latter parameter is the differential ion-binding term which reflects the uptake of additional ions upon the formation of more compact structures.
In P RNA studies, the minimal scheme of thermodynamic folding consists of two transitions:
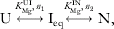
where
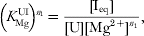
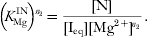
According to the Hill-type analysis, the fractional populations of these three states, f U, f I, and f N, are given by:



Using these equations, the free energy assigned to the Ieq-to-N transition can be obtained:

where R is the gas constant and T is the absolute temperature.
The K Mg of both the U-to-I and I-to-N transitions significantly increases in the presence of the denaturant urea because more Mg2+ is required to fold the RNA. For P RNA and its subdomains, the Hill constant of the I↔N transition remains unchanged in urea (Pan & Sosnick, Reference Pan and Sosnick1997; Fang et al. Reference Fang, Pan and Sosnick1999b). When the Hill constant is unchanged, the shift in the midpoint quantifies the degree of destabilization due the presence of urea

As frequently done in protein folding studies (Matthews, Reference Matthews1987; Pace, Reference Pace1986), the folding free energy can be approximated with a linear dependence on denaturant concentration (Shelton et al. Reference Shelton, Sosnick and Pan1999):

The K Mg, and hence ΔG values, obtained from the Mg2+ titrations at two urea concentrations are used to calculate the denaturant response parameter, the m value, according to

obtained by combining Eqs. (5) and (6). In a urea unfolding titration, ΔG and m values at a fixed Mg2+ concentration are obtained by fitting the observed signal, S, as the sum of the signal from the Ieq and N states according to:

Extraction of the free energy from urea titrations does not require knowledge of the Hill constant. However, the Mg2+-dependent change in stability obtained from urea titrations can be used to calculate the Hill constant upon a rearrangement of Eq. (7):

where ΔG 1 and ΔG 2 are the stabilities at Mg2+ concentrations [Mg2+]1 and [Mg2+]2, respectively.
Equations (2)–(9) are based on a Hill-style Mg2+-binding model. The Hill constant for the U-to-I transition is generally around unity but is slightly variable depending on the probes used to monitor folding. This variability suggests that n UI is a qualitative parameter which does not relate to the number of Mg2+ ions bound in this folding transition.
The Hill constant for the I-to-N transition generally is two or greater and the same n IN often is obtained using several different folding assays (Fang et al. Reference Fang, Pan and Sosnick1999b; Shelton et al. Reference Shelton, Sosnick and Pan1999; Baird et al. Reference Baird, Westhof, Qin, Pan and Sosnick2005, Reference Baird, Srividya, Krasilnikov, Mondragon, Sosnick and Pan2006). Furthermore, the same n IN can be obtained from urea denaturation at constant [Mg2+] [Eq. (6)] where no a priori assumptions about Mg2+ binding are made. The agreement of n IN between urea denaturation and Mg2+ titration holds at ∼30-fold range of [Mg2+] for two different RNAs (Fang et al. Reference Fang, Pan and Sosnick1999b; Shelton et al. Reference Shelton, Sosnick and Pan1999). These results are consistent with, although they do not mandate that n IN for some RNAs represents the number of Mg2+ ions cooperatively bound in their I-to-N transition. Recently, a mass spectrometry study of a group I ribozyme domain concluded that the n IN equates to the number of Mg2+ ions bound in this transition, albeit under very high monovalent ion conditions where non-specific Mg2+–RNA interactions are suppressed (Das et al. Reference Das, Travers, Bai and Herschlag2005).
The interpretation of the denaturant m value, for example obtained from urea titration at constant [Mg2+], is based on protein folding studies where the m value represents the amount of surface buried in a folding transition (Myers et al. Reference Myers, Pace and Scholtz1995). Urea denaturation of a series of RNA duplexes and a tRNA was measured and shown to confirm this same interpretation for RNA folding (Shelton et al. Reference Shelton, Sosnick and Pan1999). Furthermore, the relationship between the m value and surface area burial during folding, 0·1 cal mol−1 m−1 Å−2, is within 10% of the value observed for proteins.
The values for the three folding parameters describing the I-to-N transition, K Mg, n, and m, can be obtained by performing either a Mg2+ titration at constant urea concentration for a series of urea concentrations (e.g. Mg2+ titration at [urea]=0, 1, 2, 3 m), or a urea titration at constant Mg2+ concentration for a series of Mg2+ concentrations (e.g. urea titration [Mg2+]=0·1, 0·5, 1, 2 mm). For P RNA and in yeast tRNAPhe folding, these three values were the same (Fang et al. Reference Fang, Pan and Sosnick1999b; Shelton et al. Reference Shelton, Sosnick and Pan1999). Because the determination of the free energy from urea titration does not rely on the same assumptions as those used in Mg2+ titration, the agreement of K Mg, n and m, and hence ΔG, obtained from these two different ways supports the use of the empirical Hill-type analysis for determining RNA folding free energies.
3.2.2 Kinetic folding transitions
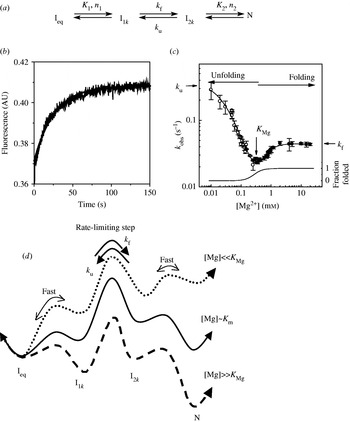
In kinetic folding studies of the C-domains, the Ieq-to-N transition is modeled with three microscopic transitions (Fang et al. Reference Fang, Pan and Sosnick1999a, Reference Fang, Thiyagarajan, Sosnick and Pan2002) (Fig. 3):

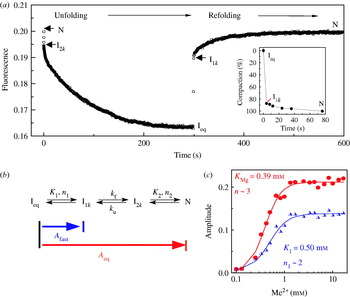
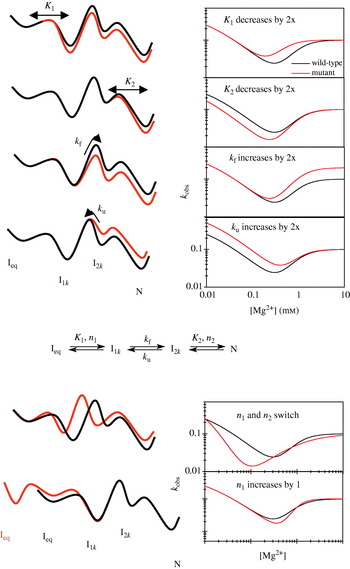
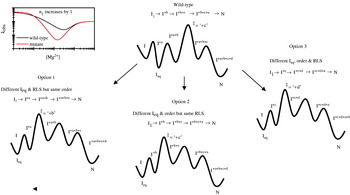
In this kinetic scheme, K 1, K 2 and n 1, n 2 are the Mg2+ midpoints and the Hill coefficients that define the relative populations of the Mg2+-dependent Ieq-to-I1k and the I2k-to-N transitions, respectively; k f and k u are the folding and unfolding rates of the Mg2+-independent I1k-to-I2k transition. Both the Ieq-to-I1k and I2k-to-N transitions are assumed to be in fast equilibrium relative to the I1k-to-I2k transition. The observed relaxation rate depends on [Mg2+] and is described by the sum of the forward and back rates according to:

In a refolding experiment at [Mg2+]>K Mg1, for example, k obs is the product of the population fraction of I1k times k f. At higher Mg2+ concentrations ([Mg2+]≫K Mg1), I1k rapidly becomes fully populated so that the observed rate plateaus at k f.
(a) Reaction scheme for the Ieq-to-N macroscopic transition with two kinetic intermediates and three microscopic transitions. (b) Illustrative Mg2+-induced folding monitoring fluorescence and a single exponential fit. (c) Observed relaxation rates plotted as a function of final [Mg2+] for folding (solid symbols) and unfolding measurements (open symbols) generate a Mg2+ chevron. The fraction of the N state determined from an equilibrium Mg2+ titration is shown at the lower portion of the graph (right axis). (d) Free energy surfaces change with [Mg2+]. At [Mg2+]≫K Mg (dashed line), folding rates saturate at k f due to the rapid formation of a folding intermediate, I1k, followed a Mg2+-independent barrier. At low [Mg2+]≪K Mg (dotted line), unfolding rates saturate at k u due to the formation of an unfolding intermediate, I2k. At [Mg2+]∼K Mg, the observed rate reflects the relative population of the kinetic intermediate times the rate of going over the Mg2+-independent barrier. In the chevron plot, the concentration where the unfolding and folding rate begins to saturate identifies K 2 and K 1 while the slopes to the left and right of the vertex reflect the Hill constants for the Ieq-to-I1k and the I2k-to-N transitions, respectively.

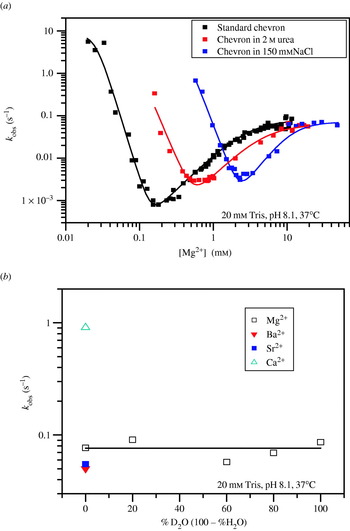
The Mg2+-dependence of k obs produces a V or ‘chevron’ shape with the vertex at the transition midpoint (K Mg) and flat regions at low and high [Mg2+]. Folding is faster than unfolding when [Mg2+]>K Mg (right side of chevron) whereas unfolding is faster than folding when [Mg2+]<K Mg (left side of chevron). The chevron shape is due to the folding rate increasing with higher [Mg2+] because of the increased stability of the I1k and the unfolding rate increasing with lower [Mg2+] because of the decreased stability of the I2k. The vertex, where k obs was the slowest, represents the condition when the forward rate equals the backward rate. In fact, for equilibrium transitions where neither of the two kinetic intermediates is significantly populated, the midpoint K Mg can be determined from the parameters obtained from the kinetic folding measurements according to:

4. Folding thermodynamics
4.1 RNA–metal ion interactions
Mg2+ is the predominant divalent metal ion that interacts with the RNA in the cell. The total [Mg2+] in the cell is on the order of tens of millimolar, most of which is associated with adenosine and other nucleotide triphosphates. As a result, the free [Mg2+] in the cell is on the order of 0·5–1 mm. Folding of a biologically derived RNA generally occurs below or at the free cellular [Mg2+].
When increasing amounts of Mg2+ ions are added to an RNA, structural changes occur as the counter-ions stabilize the various forms of the RNA (Treiber & Williamson, Reference Treiber and Williamson2001; Woodson, Reference Woodson2002, Reference Woodson2005; Misra et al. Reference Misra, Shiman and Draper2003; Sosnick & Pan, Reference Sosnick and Pan2003; Draper et al. Reference Draper, Grilley and Soto2005; Thirumalai & Hyeon, Reference Thirumalai and Hyeon2005). Diffuse and specific interactions are the two major classes of ion–RNA interactions. Diffuse (also known as delocalized or non-specific) interactions refer to fully hydrated Mg2+ ions forming an ionic cloud around the negatively charged RNA backbone. Even though the local Mg2+ concentration can be very high, on the order of 1 m, the ions within this layer are not localized to particular sites. Rather, they form a condensed cloud ‘counter-ion condensation’ (Manning, Reference Manning1978; Fenley et al. Reference Fenley, Manning and Olson1990; Chin et al. Reference Chin, Sharp, Honig and Pyle1999; Heilman-Miller et al. Reference Heilman-Miller, Thirumalai and Woodson2001) around the RNA which can be represented by a charge density profile (Chin et al. Reference Chin, Sharp, Honig and Pyle1999). The diffuse Mg2+–RNA interaction confers a high degree of stability to the RNA structure by largely neutralizing the repulsion of the negatively charged phosphate backbone.
In contrast, specific metal ion–RNA interactions occur at regions of high negative-charge density in tertiary RNAs (Cate et al. Reference Cate, Hanna and Doudna1997). In tertiary structures, RNA bases and the negatively charged backbone are in close proximity. These regions can form specific ion-binding sites where the partially dehydrated cation forms covalent interactions with up to five RNA ligands (Klein et al. Reference Klein, Moore and Steitz2004).
Other metal ions such as the monovalent Na+ and K+, divalent Ca2+, Sr2+, Ba2+, or even trivalent [Co(NH3)6]3+ also interact diffusely. However, the ion concentration required for the folding of tertiary is often orders of magnitude higher for monovalent cations and an order of magnitude lower for trivalent cations (Laing et al. Reference Laing, Gluick and Draper1994; Heilman-Miller et al. Reference Heilman-Miller, Thirumalai and Woodson2001). A hallmark of diffuse cation–RNA interaction is its non-specificity for the valency of cations. In contrast, specific cation–RNA interactions are generally sensitive to the type of metal ions.
4.2 Definition of stability
To obtain folding free energies, we take an empirical approach based on the measured populations of the native and the Ieq states, rather than separately considering the ion–RNA interactions to each state. When the folding transition is well described by the Hill-style analysis, the relative populations of two states, and therefore their relative free energy, are given as a function of [Mg2+] according to Eq. (4), irrespective of whether the Hill-style analysis accurately represents the underlying physics of RNA–ion interactions. This analysis is convenient as the stability is obtained using only the empirically determined K Mg and n values, and it avoids the need to directly determine RNA–ion interactions, which can be extremely difficult with systems which require Mg2+ ions to fold.
Specific interactions often are required for the transition from an intermediate to the native state. Nevertheless, when considering the entire folding reaction from an extended single-stranded chain to the compact native structure, the energetic contribution of diffuse interactions undoubtedly is larger than for specific interactions (Misra & Draper, Reference Misra and Draper2002). The diffuse ions take the form of a localized, condensed cloud around the RNA. Because the folding intermediate contains a near-native amount of secondary structure, the size of the ion cloud is unlikely to change significantly upon folding to the native structure. Hence, the stabilizing effect of diffuse interactions is likely to be similar for both the Ieq and the N state. As the interactions contribute similarly to both sides of the Ieq-to-N reaction, they may have only minimal effect on the relative equilibrium between these two states.
The free energy of the native, functional state of a RNA, relative to the free energy of the penultimately stable, non-functional structure determines the fraction of active molecules. Therefore, from the functional point of view, the stability of tertiary RNA is defined as the free energy difference between the native state and the penultimately stable state or reference state. This definition of stability is referred to as functional stability. The folding of large tertiary RNAs frequently occurs with partially structured intermediate states because RNA secondary structures often are independently stable. Consequently, for tertiary RNAs, a non-functional Ieq state, rather than a fully unfolded U state, is the defining reference state for functional stability.
4.3 Folding of the full-length P RNA
The minimal, three-state folding scheme [Section 3.2.1, Eq. (1)] was applied to the folding of the 409-nt P RNA from B. subtilis (Pan & Sosnick, Reference Pan and Sosnick1997). According to CD and UV absorbance measurements, the U-to-Ieq transition occurred between 0 and 0·1 mm Mg2+ and has a Hill constant of 1 at 37°C. The cooperative Ieq-to-N transition has K Mg of 0·8 mm, a Hill constant of 4 and a denaturant dependence of ΔG, or m value, of 1·7 kcal mol−1 m−1. The same K Mg and n for the Ieq-to-N transition was obtained when folding was monitored by catalytic activity. From the m value, the amount of surface burial in the I-to-N transition is estimated to be ∼17000 Å2. This amount corresponds to the surface burial of 22 bp, or 11% of the calculated surface burial from a completely unstructured chain to the native state.
The U-to-Ieq transition was interpreted as a series of overlapping folding transitions primarily derived from the formation of secondary structures of this RNA. This interpretation is consistent with the large decrease in UV absorbance during this folding transition. Most likely, multiple secondary-structure elements form independently of each other and the amount of Mg2+ required simply depends on the particular sequence and hence, the base-pairing strength of individual helices.
The Ieq-to-N transition has been interpreted as a defined transition with two well-defined endpoints, the Ieq and N states. There is negligible change in the near-UV absorbance in the Ieq-to-N transition, suggesting that this transition involves only minimal increase in base-stacking, and primarily reflects the formation of tertiary structures. The same Ieq state obtained from Mg2+ titration at equilibrium is present as a major species in the folding kinetics of full-length P RNA. We concluded from the kinetic studies discussed below that this Ieq state contains non-native interactions between residues on the S- and C-domains (Pan et al. Reference Pan, Fang and Sosnick1999b).
4.4 The catalytic domain or C-domain
When the isolated S- and C-domains are refolded, the non-native, inter-domain interactions found in the Ieq state of the full-length B. subtilis P RNA are eliminated. The folding kinetics of the C-domain is unencumbered by the formation of (detectable) non-native interactions, making it a good model system in studying the nature of the rate-limiting step (RLS) in RNA folding, as discussed below. For these reasons, folding thermodynamics of two C-domains has been extensively analyzed (Fang et al. Reference Fang, Pan and Sosnick1999b, Reference Fang, Golden, Littrell, Shelton, Thiyagarajan, Pan and Sosnick2001).
4.4.1 The B. subtilis C-domain
We applied several assays to monitor the thermodynamic folding of the B-type 255-residue C-domain from B. subtilis. The Ieq-to-N transition was monitored by CD at 260 nm and 287 nm. At 37°C, this transition had a K Mg of 1·2 mm, a Hill constant of 3 and an m value of 1·0 kcal mol−1 m−1. Identical values for K Mg and n were obtained when folding is monitored by fluorescence using a 5′-fluorescein-labeled RNA, or by hydroxyl radical protection (Fig. 2b).
The folding of the B. subtilis C-domain, as monitored by SAXS, also exhibited three-state behavior. In buffer alone (20 mm Tris–HCl), the U state had a R g∼80 Å (Fig. 2c). Upon the addition of 8 m urea and 4 mm EDTA, the R g increased from 80 to 180 Å. Under this extremely denaturing condition, the conformation of this 255-residue RNA probably was well represented as a single-stranded, random-coil. In the absence of urea, collapse to R g∼45 Å occurred at [Mg2+]∼0·9 mm with n∼1 in the U-to-Ieq transition. The last part of the collapse process leading to a final R g∼38 Å, occurred in the cooperative Ieq-to-N transition which was described with K Mg=2·2 mm and n=3.
The SAXS-determined K Mg value was higher than that observed in the spectroscopic assays. This difference was due to the higher RNA concentration used in the SAXS measurements (3·4 μmvs. <0·2 μm). The folding transition was remeasured using hydroxyl radical protection at the higher RNA concentration and the midpoint coincided with the SAXS-determined midpoint. The shift in the apparent midpoint is due to the RNA polyanion soaking up a significant fraction of Mg2+ ions through diffuse interactions, which reduced the free ion concentration (∼2–4 cations/nucleotide). Buffers such as Tris–HCl also can chelate Mg2+ ions and shift transition midpoints (Fang et al. Reference Fang, Pan and Sosnick1999b).
In summary, the Ieq-to-N transition for the B. subtilis C-domain was cooperative when probed by CD, fluorescence, hydroxyl radical protection, SAXS and catalytic activity. This transition exhibited identical n and m values over a range of temperatures (10–37°C), NaCl (0–150 mm) and urea concentration (0–3 m), indicating that the folding cooperativity was robust for this RNA. On the other hand, K Mg increased as the temperature, salt or urea concentration increased. That is, in order to fold the RNA under these destabilizing conditions, an increased amount of Mg2+ concentration was required.
4.4.2 The origin of thermostability of homologous C-domains
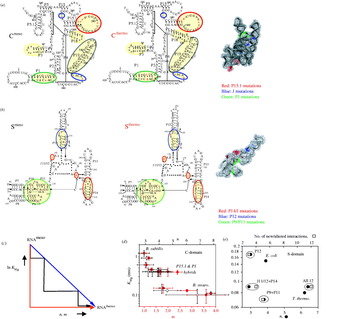
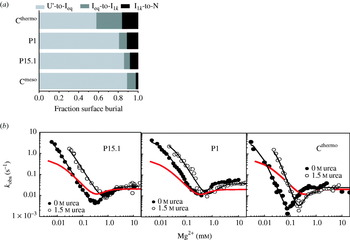
Bacillus stearothermophilus is the only known thermophilic bacteria containing the B-type P RNA. The optimal living temperature for the mesophile bacteria is 30–37°C, but it is 55°C for the thermophile. The catalytic domains of B. subtilis and B. stearothermophilus are similar in size (255–262 residues), and 85% identical in sequence (Fig. 4). Yet, these C-domains have very different folding behavior (Fang et al. Reference Fang, Golden, Littrell, Shelton, Thiyagarajan, Pan and Sosnick2001). At 37°C, B. stearothermophilus C-domain (Cthermo) has a folding midpoint of 0·1 mm, a Hill constant of 8 and a m value of 3·8 kcal mol−1 m−1. These values are in stark contrast to the folding of B. subtilis C-domain (Cmeso) under the same condition: K Mg∼1·2 mm, n∼3 and m∼1·0 kcal mol−1 m−1. At 55°C, Cthermo folds with K Mg of 0·24 mm, which is significantly lower than Cmeso which folds with a midpoint of 1·7 mm. Why is Cthermo so much more stable than Cmeso?
The relationship between stability and cooperativity upon the conversion from a mesophilic to a thermophilic RNA. (a) Differences between Cmeso and Cthermo sequences are shown in lowercase, and the minimalist set investigated in the triple substituted variants CP1/P15.1/J, is shown in red and highlighted on the crystal structure of the B. stearothermophilus C-domain (Kazantsev et al. Reference Kazantsev, Krivenko, Harrington, Holbrook, Adams and Pace2005). The hybrid constructs involve substitution of the corresponding secondary structure motif in Cmeso with that in Cthermo, as coded by differently colored circles (P3/P18, yellow; P15.1, red; P19, gray; P1, green; J, blue). (b) Sequence differences between Smeso and Sthermo are shown in lowercase, and the minimalist set found in P12, J11/12, P14, P9, P11 is in red. The hybrid constructs are coded with colored circles (P9/P11, green; P14/J11/12, red; P12, blue). The location of the mutants studied is highlighted on the crystal structure of T. thermophilus solved to 2·9 Å (Krasilnikov et al. Reference Krasilnikov, Xiao, Pan and Mondragon2004). (c) Three models of correlating stability (as represented by ln K Mg), and folding cooperativity (as represented by n, the Hill constant, or the urea m value). Model 1 (red): A significant increase in stability is possible without changes in cooperativity. Model 2 (black): Only a moderate change in stability is possible without changing cooperativity, and similarly only moderate change in cooperativity is possible without changing stability. Model 3 (blue): The change in stability is completely coupled to change in cooperativity. Plot of ln (K Mg) vs. n (black) and m values (red) for hybrids of the (d) C-domain and (e) S-domain. An increase in cooperativity is only achieved through mutations in multiple regions of the molecule.

Several mechanisms have been proposed for how a tertiary RNA achieves thermostability. The simplest explanations for the higher stability of thermophilic RNAs are increased G-C content and post-transcriptional modifications (Brown et al. Reference Brown, Haas and Pace1993; Kowalak et al. Reference Kowalak, Dalluge, McCloskey and Stetter1994; Galtier & Lobry, Reference Galtier and Lobry1997). In vitro selection on the Tetrahymena ribozyme identified that mutations leading to thermostability are largely involved in tertiary interactions and lead to improved packing in the core of the molecule (Guo & Cech, Reference Guo and Cech2002). These changes presumably strengthen interactions in the native structure.
The existence of Ieq offers another mechanism for the increased stability of a thermophilic RNA (Fig. 4). Stability is the energetic difference between the native and this Ieq state. This energetic height can be adjusted either by lowering free energy of the native state, or by increasing the free energy of the Ieq state. In our comparative Cthermo and Cmeso study, the native states of these two RNAs appear to have very similar structures as assayed by hydroxyl radical protection and SAXS (ΔR g∼0·4 Å). The Ieq state for Cthermo, on the other hand, is significantly less structured than the Ieq state of Cmeso as assayed by SAXS (ΔR g∼14 Å) and CD. A less-structured Ieq state implies that an increased amount of structure forms in the Ieq-to-N transition of the thermophilic RNA as evidenced by its larger n (8 vs. 3), m (3·8 vs. 1·0 kcal mol−1 m−1) and ΔC p (2·3 vs. 0·4 kcal mol−1 K−1). Conversely, more structure must be disrupted for the N state of the thermophilic RNA to unfold to the Ieq state.
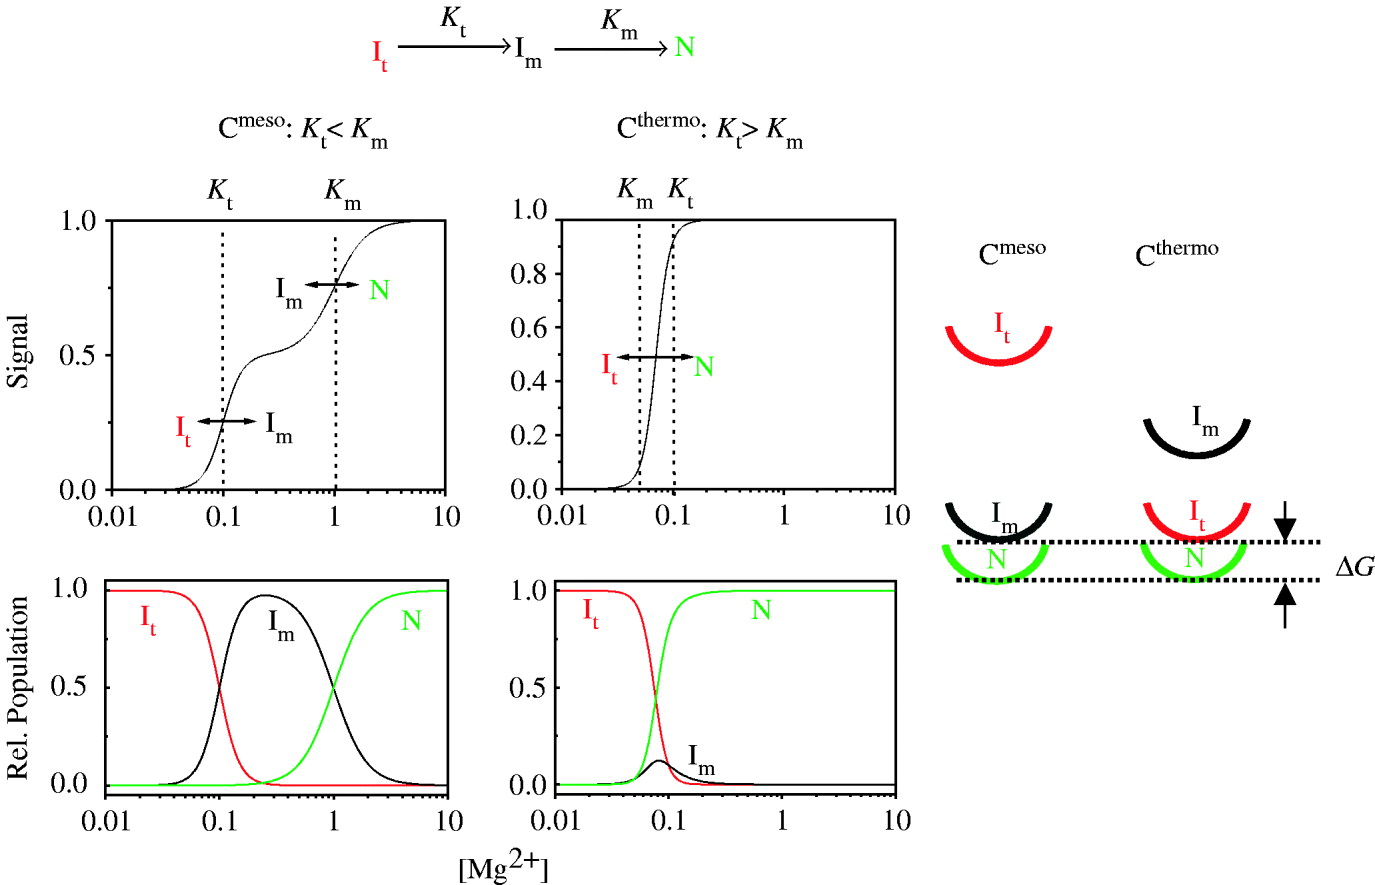
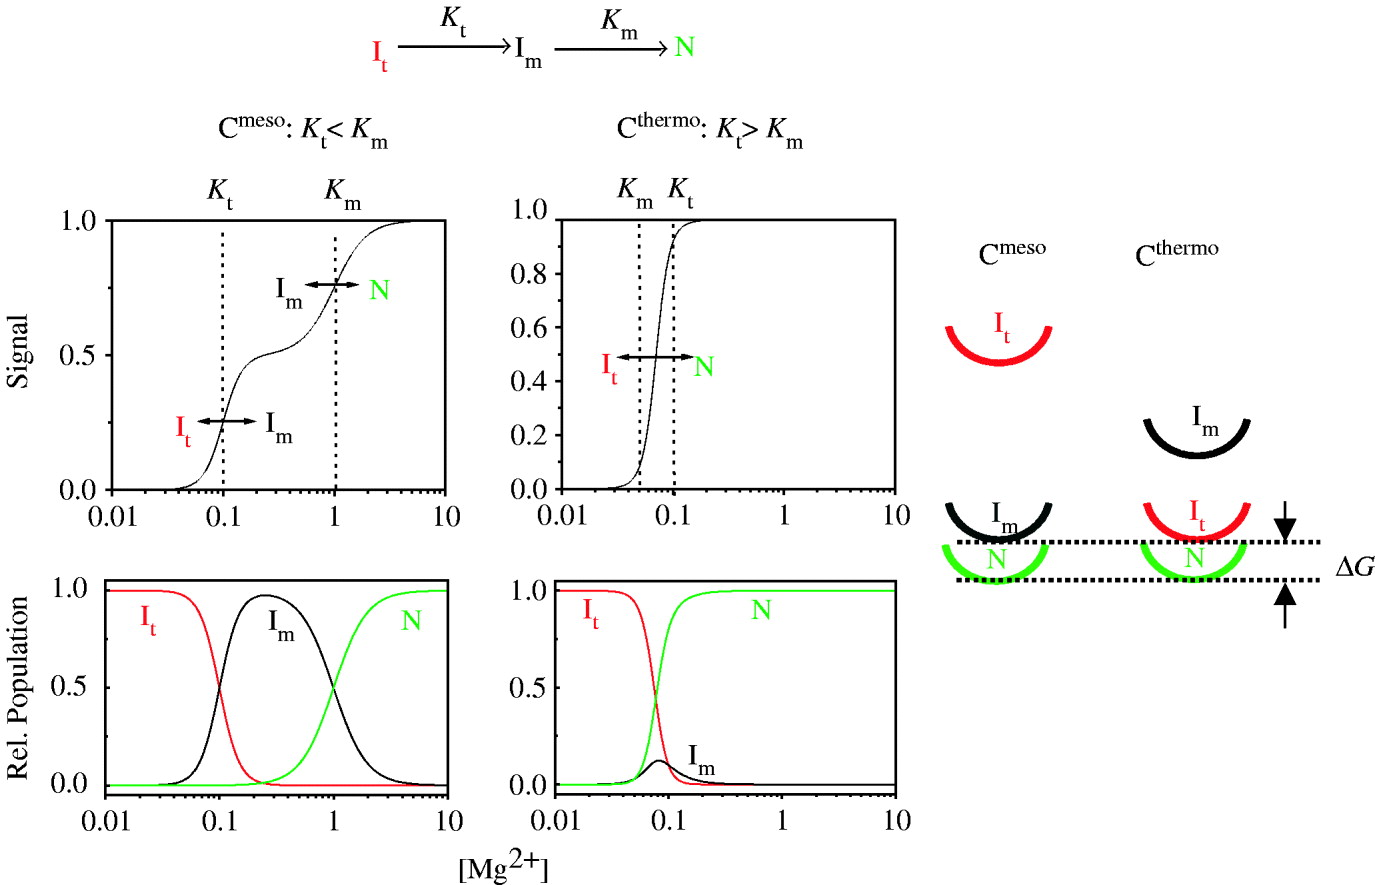
This ‘similar native structure, less-structured reference state’ mechanism can be accomplished by making the Ieq-to-N folding transition more facile in the thermophilic RNA (Fig. 5). In this scenario, the Ieq-to-N transition of Cthermo and Cmeso occurs with two Mg2+-dependent transitions, It-to-Im and Im-to-N. For Cmeso, the Mg2+ concentration required for the first transition is lower than for the second transition (K t<K m), so that folding occurs in two distinct steps and Im is the Ieq. For Cthermo, the Mg2+ concentration required for the first transition is higher than that for the second transition (K t>K m), so that folding occurs in one cooperative step and It is the de facto Ieq. Cthermo achieves this higher folding cooperativity by adjusting its structure that selectively lowers K m, the [Mg2+] requirement for the Im-to-N transition. Hence, once the Mg2+ concentration is high enough to drive the first transition, the second transition immediately occurs and thus, both transitions occur cooperatively.
For a reaction scheme with two intermediates (top), the stabilization of the second, Im↔N transition such that its midpoint is lower than the midpoint of the first, It↔Im transition (i.e. K t>K m) results in the two distinct transitions coalescing into a single transition with increased folding cooperativity. For this thermophilic RNA, the Im species is less stable than the It at the transition midpoint even though the functional stability is the same (energy diagrams at right). Hence, the less structured It species, rather than the Im species, serves as the reference state for the C-domain from the thermophilic organism.
4.5 Conversion of a mesophilic to a thermophilic ribozyme
C-domain. In order to understand the structural basis of how Cthermo achieves its greater stability, we examined the folding of a series of Cmeso mutants containing portions of Cthermo (Fig. 4). Starting from Cmeso, these hybrid mutants incorporated a subset of sequence changes that nature has selected for Cthermo. The ∼40-nt differences between Cmeso and Cthermo are located in five secondary structure regions, P3, P18, P15, P19 and P2, and in four regions involved in tertiary structure, P15.1, J15/15.1, J19/2 and P1.
Individual variants modulated the folding transition in different ways. Changes in the P1, P15.1, P19 and J motifs all resulted in more stability, with each also yielding some modest degree of increased cooperativity (Fig. 4a, e). Most double substitutions also exhibited modest to intermediate gains in cooperativity and stability. As revealed by the substitution mutants, double substitutions of key regions yielded more significant changes in stability and cooperativity. As expected, substitutions of three motifs (12 nt total) yielded even more dramatic changes in the stability and cooperativity, with the folding parameters of the P1/P15.1/J substitution mutant approximating those of the Cthermo.
The hybrid mutant study also illustrates a linkage between stability, as represented by K Mg, and folding cooperativity, as represented by the Hill constant n and the m value (Fig. 4d). Three models can be envisioned to relate stability and cooperativity. In Model 1, the RNA can increase its stability without a commensurate change in folding cooperativity. The RNA only becomes more cooperative upon reaching a threshold of stability. In Model 2, only a modest increase in stability can be achieved without a change in cooperativity. Upon a sufficient increase in stability, additional units of structure are subsumed into the transition, which moderately increases folding cooperativity. These structural units reflect the modular nature of tertiary RNA structure, e.g. a collective set of tertiary interactions or a Mg2+ ion-binding site. This process of altering stability and cooperativity repeats to produce the staircase pattern shown in Fig. 4d. At the other extreme is Model 3, where changes in stability and folding cooperativity are completely coupled producing a diagonal line in Fig. 4d.
Model 2, which considers a moderate coupling between stability and folding cooperativity, best describes the folding of Cthermo, Cmeso and their hybrid mutants. An increase in stability, but not in cooperativity can be explained by the addition of new or the strengthening of existing tertiary interactions. An increase in cooperativity can be achieved when substituting multiple motifs of the molecule; in this case the interactions between the various regions become more cooperative. Specifically, there are 12 nucleotide substitutions in the P1/P15.1/J mutant which suffice to mimic the behavior of the thermophile. The recent publication of the crystal structure of the thermophilic C-domain now allows us to interpret these mutational results in terms of structural characteristics.
The 12 mutations are involved in a variety of interactions ranging from simple Watson–Crick base pairs to complex, long-range tertiary interactions. For example, in P15.1 two wobble base pairs in the mesophile are mutated to Watson–Crick pairs in the thermophile. Presumably, these mutations stabilize the orientation of the helix such that the loop L15.1 can be properly oriented for its tertiary interaction with P5.1. The mutations in the L15.1 lead to additional H-bonds for this large 16-nt loop. Some of these H-bonds serve to stabilize the overall tertiary structure of this unusual loop, presenting key nucleotides at the tip of the loop for interactions with P5.1; other H-bonds within this loop directly improve the interaction with P5.1. Overall, the 12-nt mutations in the P1/P15.1/J loop are responsible for stabilizing the orientations of various motifs, improving packing interactions, and directly strengthening tertiary interactions with additional H-bonds.
S-domain. The crystal structure of the ∼160-nt S-domain from T. thermophilus was solved to 2·9 Å and motivated a series of folding and structural studies. This S-domain differs from B. subtilis on two levels. First, T. thermophilus is of the A-type RNase P RNAs and thus has different secondary structural elements. In fact, it is only in these peripheral secondary structural elements that the crystal structures differ; the core is remarkably similar in both RNAs. Second, this new structure comes from a thermophilic organism. Therefore, folding studies of this S-domain could yield structural insights into RNA thermostability.
Similar to the mesophile–thermophile studies on the C-domain, we performed a comparative folding study on E. coli S-domain, an A-type mesophile, and on T. thermophilus A-type thermophile (Fig. 4b). However, the added motivation with the S-domain studies was to utilize the newly available crystal structure to investigate what additional atomic-level insights into thermostability could be attained.
Folding monitored by CD revealed that the thermophilic S-domain bound Mg2+ tighter, with a lower transition midpoint, K Mg=0·08±0·01 mm, and a higher Hill coefficient, n=6·2±0·6, and m value (2·4 kcal mol−1 m−1) as compared to the mesophile (K Mg=0·15±0·01 mm, n=3·9±0·5, m=1·5 kcal mol−1 m−1).
The thermophile has 34 sequence differences and five additional bases relative to the mesophile. Our first step was to investigate the importance of individual interactions present in the crystal structure for these 39 nucleotides. A number of nucleotides were found to be a simple base-pair switches (G-C to C-G) or mutations in a loop region with no tertiary structural interactions. These changes were considered unimportant for achieving thermostability and this was confirmed by phylogenetic comparison, as discussed below. Other mutations involved correcting mismatches or converting an A-U pair to a G-C pair in the thermophile. The interactions of the remaining nucleotides observed in the T. thermophilus structure were used to infer which interactions would be absent in the mesophilic structure.
We next reviewed the phylogeny of mesophilic and thermophilic A-type S-domains. This phylogenetic comparison revealed 12 nucleotide differences which were highly conserved amongst thermophiles (96, 107, 119, 128, 138, 164, 175, 197, 201, 212, 216, 224). In the thermophilic structure, these nucleotides are involved in correction of mismatches, metal ion- binding interactions, and hydrogen-bond networks linking various regions of the molecule. This change provide a structural fine-tuning throughout the molecule.
We utilized these findings to design hybrid RNA mutants to compare against the original mesophilic and thermophilic RNAs. These new RNAs incorporated multiple mutations in three distinct regions of the molecule; P12 (G138, C164), P9+P11 core (C96-G107, C119, C224), and J11/12+P14 (G128, C175, C197-G216, C201-G212). The folding of these mutants was then monitored over a range of Mg2+ concentrations by CD. Folding of the P12 mutant was quite similar to the mesophilic RNA. Folding of P9+P11 and J11/12+P14 had a K Mg similar to the thermophile and an n similar to the mesophilic RNA. Upon mutating all 12 nucleotides at once, the K Mg and n values were identical to the thermophilic RNA (Fig. 5c). Mutation of one region alone could not be responsible for thermostability, rather coincident mutations across multiple motifs were required.
In summary, we found that only a modest increase in stability could be achieved without a change in cooperativity for both the C-domain and the S-domain. Upon a sufficient increase in stability, cooperativity increases due to the inclusion of additional, discrete elements into the folding transition, which reflects the modular nature of tertiary RNA architecture. As a result, it is difficult to achieve a significant change in tertiary RNA stability without changing the thermodynamic reference state and the folding cooperativity.
4.6 The B. subtilis S-domain folding intermediate
A major aim in RNA folding is to understand the structural processes involved in the folding pathway. A variety of issues arise: Which structural features are present in the populated intermediates? Are these elements native-like and productive or non-native kinetic traps? How valid is the generally accepted axiom is that secondary structure forms first and is present in the intermediate while the formation of tertiary structure occurs in the final transition.
The crystal structure of the S-domain provided detailed structural information and prompted questions regarding the nucleotide-level details of the folding process. The native structure of the S-domain (Krasilnikov et al. Reference Krasilnikov, Yang, Pan and Mondragon2003) is made up of four main structural features: a four-way junction, a core including an A-minor docking motif, a non-canonical tertiary module, and a TL–receptor interaction (Fig. 6). An intriguing aim became the unveiling of the structure of the populated equilibrium intermediate rather than simply measuring its thermodynamic parameters.
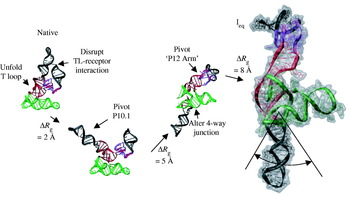
The model of Ieq was generated by progressively disrupting the structural elements which are absent according to footprinting studies to generate the observed change in R g. This model depicts the general properties of the intermediate, but is not unique. The Ieq species undoubtedly has structural heterogeneity; for example, the angle of P10.1 can vary by ∼50° with the R g changing by <1 Å, as illustrated.

Initial studies of the S-domain focused on the equilibrium folding properties over a range of Mg2+ concentrations. We employed CD at multiple wavelengths (260–287 nm) to obtain values for the Mg2+ midpoint, K Mg=0·23±0·03 mm, and Hill coefficient, n=4·8±0·3, for the cooperative Ieq-to-N transition at 37°C, 20 mm Tris–HCl (pH 8). UV absorbance followed the early U-to-I transition with K Mg and n depending on the wavelengths monitored. Multiple structural mapping probes were used to follow the folding transitions over a range of 0–10 mm Mg2+. Nucleases T1 and V1 along with DMS, kethoxal, and DEPC detailed the structural changes of various nucleotides occurring during the folding process. Values for K Mg and n determined with the structural probes agreed nicely with those determined by CD for the I-to-N transition.
SAXS experiments revealed a similar pattern of compaction for the S-domain as compared to the C-domain. In the absence of Mg2+, the R g=69 Å. Upon the addition of Mg2+, the intermediate forms with an R g∼40 Å. Upon the addition of 10 mm Mg2+, an amount sufficient to generate the native state, the S-domain compacted to 32 Å. Hence, the Ieq-to-N transition accounts for only ∼22% of the overall compaction.
To determine the amount of surface buried in this transition, multiple Mg2+ titrations tracking CD were conducted in background of different concentrations of urea. From a global fit to these data, we calculated an m value of 1·5 kcal mol−1 m−1. This value corresponded to the amount of surface area buried in a 22mer duplex. This amount of area was ∼28% of the total estimated surface area burial in the entire folding from the completed unfolded state. Both the SAXS R g and the urea m value indicated that the majority of the S-domain structure is present in the equilibrium intermediate.
With global and site-specific structural data, we worked backwards from the native structure to build a number of models consistent with the experimental information (Fig. 6). Site-specific probes revealed which structural features of the S-domain were formed in the U-to-Ieq transition. Not surprisingly, a number of helical regions, including the helices involved in the four-way junction (green region) and those involved in the TL receptor (black region), were largely native-like under conditions where the intermediate was populated. However, we did not anticipate that a non-canonical junction involving tertiary interactions between two irregular loop motifs would show complete protection from structural probes upon formation of the intermediate (purple region).
This site-specific information defined which elements of the native structure could or could not be adjusted in our efforts to model the dominant intermediate. The peripheral elements were largely pre-formed in the intermediate, irrespective of the type of structure (2° or 3°) involved, save for the formation of the long-range TL receptor interaction between P12 and P10.1 in the native structure. The dominant areas that showed protection in the Ieq-to-N transition were involved in the core of the molecule along with a few long-range tertiary interactions. The global information obtained from the SAXS experiments provided R g and P(r) data which were used as constraints against which various intermediate models are tested. For example, the change in size from the intermediate to the native state is ΔR g=8·8±1·2 Å.
In the modeling process, first the TL receptor interaction was disrupted from its native configuration in agreement with site-specific protection patterns. The P10.1 arm was then swiveled to various positions in an attempt to achieve a ΔR g close to 8·4 Å. However, movement of this helical motif resulted in a maximum change of only ∼5 Å in R g. The helices involved in the four-way junction were too small to effect any additional change in R g upon adjustments of their orientations. Only the arm containing P11-J11/12-P12 (P12 arm) could be moved to bring about additional extension to satisfy the global requirement of ΔR g≈9 Å. Various models incorporating adjustments in the orientation of the P12 arm were created. The maximal ΔR g was achieved when the P12 arm, containing the TL, was positioned ∼180° from P10.1, which contains the TL receptor.
In order for the P10.1 and P12 arms to be in such an extended position relative to their native conformations, it was necessary to disrupt the structure of regions linking these arms to the core. This disruption of the core altered the orientation of the helices in the four-way junction as well as key 5-nt linker region at the base of P10. Additionally, stacking interactions within the core were modified in the intermediate structure. The 5-nt linker region was extended in the intermediate structure and connected P10.1 to P11 (the base of the P12 arm). Upon folding to the native structure this linker region collapsed into a U-shaped turn, extending two adenosine nucleotides which then interacted with the four-way junction through an A-minor motif. Additionally, two non-native base pairs (G176-C134 and A135-U175) were implied from the structure of the intermediate and they may play a role in stabilizing the intermediate in the extended conformation.
Folding of the 5-nt loop permitted the P10.1 arm to move back into position to interact with the P12 TL. Additionally, folding to the native structure required a rearrangement of the four-way junction such that A130 (P9) and A230 (P11) could form a stacking interaction which stabilized the junction important for pre-tRNA binding. Lastly, the movements of the P10.1 and P12 arm to their native conformations involved the formation of the stacking interaction of G168 (P10.1) on A194 (J11/12) and the appropriate intercalation and H-bond interactions in P11 of the core.
Multiple models were created varying the orientations of these two extended P10.1 and P12 duplexes. A movement of the P10.1 arm by 25° only changed R g by <1 Å. Thus, the exact angle of these two arms was ambiguous but it was clear that they must be extended in nearly opposite directions in order for the intermediate to obtain the observed R g. In fact, our model should be viewed as a lower bound on the extended nature of the intermediate as the ΔR g of our model is 7·6 Å while the experimental value is 8·8±1·2 Å. The model in Fig. 6 is a consensus structure that illustrates the main features of this intermediate structure; it is not intended to imply that all molecules must adapt this precise structure.
4.7 Metal ion binding and folding
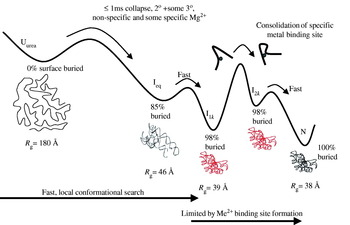
In the crystal structure of the S-domain, a number of metal ions are bound with inner sphere coordination to the RNA (Krasilnikov et al. Reference Krasilnikov, Yang, Pan and Mondragon2003). In the Ieq structure, metal ions are likely to remain in the native-like regions such as J11/12 junctions, P10.1 and P8 helical elements, but they are unlikely to remain in the unfolded regions (Fig. 7). A subset of metal ions that are absent in the intermediate, but present in the native state, likely play an important role in the Mg2+ dependence of the folding transition.
In the Ieq-to-N transition, the core of the S-domain folds forming the multiple metal ion-binding sites (depicted with single red sphere, upper pathway), as observed in the crystal structure. These binding sites are important in facilitating the Ieq-to-N folding transition by stabilizing the T loop, which in turn increases the local concentration of the TL and its receptor enhancing their association (black bars). This linkage between metal ion binding in the core and the association of distal structural elements provides an additional modality for metal-induced stabilization and helps rationalize the cooperativity observed in RNA folding. Alternatively, metal ion binding sites may directly stabilize the association of distal structural elements (lower pathway), although such sites are not observed in the S-domain crystal structure.

Three scenarios are plausible for how metal ions could facilitate the Ieq-to-N transition. First, metal ions may directly mediate long-range tertiary interactions through explicit RNA–metal–RNA contacts at an interface between structural elements. Second, metal ions may indirectly stabilize RNA structures involved in the tertiary interaction (Klein et al. Reference Klein, Moore and Steitz2004). We propose a third modality involving the folding of a binding site or pocket in concert with the formation of long-range interactions in distal regions of the molecule. For example, the metal-induced folding of the centrally located T loop region occurs along with the TL receptor docking and the base-stacking between P10.1 and J11/12. Metal ion binding in the S-domain core stabilizes the formation of the TL receptor by increasing the local concentration of its two constituents. Metal ion binding ‘acting at a distance’, linking local and non-local events, is likely to be a major part of the origin of the folding cooperativity observed for tertiary RNAs.
The action of metal ion binding in a core region and stabilizing a structural adjustment of other regions appears to be general, being observed in the folding of the hammerhead ribozyme and the four-way junction of the hairpin ribozymes (Bassi et al. Reference Bassi, Murchie, Walter, Clegg and Lilley1997; Walter et al. Reference Walter, Murchie and Lilley1998). In each of these ribozymes, a metal ion binds near the core junction of the helices, thereby promoting the correct orientation of the peripheral elements so that their apical loops are positioned for enzymatic activity.
The detailed structural model of the S-domain can serve as a foundation for investigating other questions of the Ieq-to-N transition. Folding kinetic studies from U to N indicate the appearance of the same Ieq state, followed by two additional intermediates (N. J. Baird, T. Sosnick & T. Pan, unpublished results). The most conspicuous structural elements that are absent in Ieq are the peripheral TL receptor and the T loop in the core. Modeling both kinetic intermediates that follow Ieq will provide structural insights into the movements involved in the RLS. One possibility is that the formation of the core folds and then is held in place by the TL receptor interaction.
5. Folding kinetics
5.1 Folding rates and RNA topology
For many proteins, a correlation exists between the folding rate and the relative contact order (CO), a measure of topological complexity (Plaxco et al. Reference Plaxco, Simons and Baker1998, Reference Plaxco, Simons, Ruczinski and Baker2000). This correlation is consistent with the proposal that the two-state folding reaction is limited by a large-scale conformational search for some threshold amount of native chain topology (Abkevich et al. Reference Abkevich, Gutin and Shakhnovich1994; Guo & Thirumalai, Reference Guo and Thirumalai1995; Sosnick et al. Reference Sosnick, Mayne and Englander1996). In analogy, some RNA folding studies have suggested a similar relationship holds between folding rates and RNA topology (Swisher et al. Reference Swisher, Su, Brenowitz, Anderson and Pyle2002; Heilman-Miller & Woodson, Reference Heilman-Miller and Woodson2003).
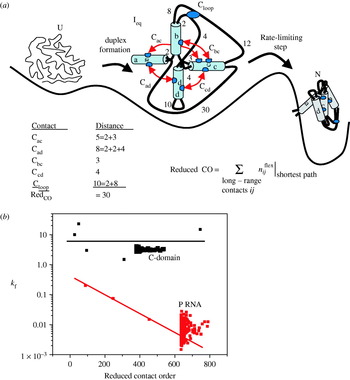
In an effort to provide a rigorous framework for the determinants of RNA folding rates, we considered the relationship between k f and the topological complexity of the native structure (Sosnick & Pan, Reference Sosnick and Pan2004). In contrast to two-state protein folding, RNA folding is multi-state with well-populated, structured intermediates. As a result, the CO metric, which is applicable to a conformational search involving the entire chain, is inappropriate for RNA folding. Hence, we introduced a new metric, reduced contact order (RedCO) (Sosnick & Pan, Reference Sosnick and Pan2004). RedCO is defined as the number of residues outside of Watson–Crick base-paired regions along the shortest path between each pair of long-range contact (Fig. 8a). For example, in Figure 8, most of the nucleotides between the residues making the long-range contact Cac are involved in the formation of helix b. Only the residues along the chain outside of the helices are used to calculate the RedCO: 2 nt between helix a and helix b, and 3 nt between helix b and helix c (RedCO=5). All such connections are calculated for the tertiary structure contacts to yield an overall RedCO for the molecule (RedCO=30 for the example in Fig. 8). A plot of RedCO vs. k f for ten RNAs suggested a separation into two distinct classes: A fast-folding class (six members) with little dependence on RedCO, and a slow class (four members) with some dependence on RedCO.
(a) RNA folding is multi-state with highly structured intermediates which accumulate prior to the rate-limiting step. A sample calculation of reduced CO (RedCO) is depicted for a model RNA with five tertiary contacts. RedCO is the sum of the length of the short paths between each contact. Numbers denote residue length of each unstructured segment. (b) Test of separation into fast (red) and slow (black) folding classes using CP libraries. Folding rate and RedCO of various RNAs and the circularly permutated libraries of P RNA and C-domain at a consensus condition (37°C and ∼10 mm Mg2+).

To test this separation, we measured the relative folding rates for circular permuted (CP) libraries of an RNA selected from the slow and fast classes. In these libraries, the wild-type 5′- and 3′-ends were covalently linked, followed by the generation of new 5′- and 3′-ends elsewhere (Pan, Reference Pan2000). The representatives of the slow and the fast class were the full-length B. subtilis P RNA and its C-domain, respectively. These RNAs were chosen because the folding of the full-length P RNA is limited by the disruption of misfolded structure whereas the limiting step for the C-domain folding is a small-scale event, the consolidation of a metal ion binding site, and not a kinetic trap (Fang et al. Reference Fang, Pan and Sosnick1999a), as discussed the following sections. Folding rates of the CP library of P RNA exhibited a 10-fold variation, consistent with the sensitivity of k f to RedCO for the slow class. Folding rates of the entire CP library of the C-domains were within 1.2-fold, in spite of their large variation in RedCO. This result correlates well with the null correlation between folding rate and RedCO conjectured for the fast class.
The separation of RNAs into different classes is not surprising as the RLS can be significantly different for various RNAs (Treiber & Williamson, Reference Treiber and Williamson2001; Sosnick & Pan, Reference Sosnick and Pan2003). The nature of the RLS ranges from disruption of non-native or prematurely formed native structures (Treiber & Williamson, Reference Treiber and Williamson2001) to subtle conformational changes leading to the formation of a metal ion-binding site (Sosnick & Pan, Reference Sosnick and Pan2003). When the RLS involves structural disruption, the folding rates can vary with chain connectivity, which also results in a change in RedCO. Hence, the correlation between slower folding and increased complexity probably reflects an increase in the probability for misfolding, rather than a more time-consuming conformational search involving the whole RNA. But, when the RLS involves small-scale conformational change, the folding rates are expected to be independent of the RedCO.
5.2 Folding of full-length P RNA
The first study of P RNA folding kinetics was carried out by Williamson and co-workers using an oligonucleotide hybridization assay (Zarrinkar et al. Reference Zarrinkar, Wang and Williamson1996). Folding of both B. subtilis (B-type) and E. coli (A-type) P RNA is on the order of minutes at 37°C. Both P RNAs folded with multi-step kinetics. The long-range P4 helix formed early and prior to the RLS. Folding was limited by a Mg2+-independent step, followed by the formation of the P7 helix which is located at the junction between the C- and S-domains.
Our study on B. subtilis P RNA using CD and catalytic activity demonstrated that the slow folding is limited by disruption of kinetic traps (Pan & Sosnick, Reference Pan and Sosnick1997). A kinetic trap reflects the need for an intermediate to undo either non-native interactions or prematurely formed native-like structures (Treiber et al. Reference Treiber, Rook, Zarrinkar and Williamson1998). Misfolded structures can be stable, and kinetically trapped species often transiently accumulate in refolding experiments. In these situations, the addition of denaturant can accelerate folding by destabilizing the misfolded species (Pan & Sosnick, Reference Pan and Sosnick1997).
The molecular nature of the kinetically trapped state in B. subtilis P RNA was deduced from an oligo-hybridization study (Zarrinkar et al. Reference Zarrinkar, Wang and Williamson1996) and a folding study of a circularly permuted P RNA. This circularly permuted P RNA (cpRNA) contained a break in the RNA backbone precisely at the junction of the S- and C-domains. This break had little effect on the stability, yet the folding rate was accelerated by 15-fold. In addition, the break at the junction was in close proximity to the P7 helix that forms only after the RLS (Zarrinkar et al. Reference Zarrinkar, Wang and Williamson1996). These results suggested that the kinetically trapped species in the wild-type P RNA folding contains non-native interactions between the S- and C-domains.
Macmillan and co-workers conducted a detailed structural characterization of the E. coli P RNA folding intermediate using hydroxyl radical protection (Kent et al. Reference Kent, Chaulk and MacMillan2000). They found that the folding of each domain proceeded through a discrete series of intermediates. Similar rates of folding were observed for regions that form the interface between the two domains. Hence, just as observed for B. subtilis P RNA, a kinetic trap occurs because of non-native interactions between the S- and C-domains.
In the study of the cpRNA, we found that folding of this large RNA was under kinetic control. Kinetic control refers to the situation where kinetic rates or initial conditions determine which pathways are traversed and folding does not always proceed through the same series of intermediates. When folding started from the Ieq state, cpRNA folded as slowly as P RNA. This result suggested that the non-native, inter-domain structure whose disruption was rate-limiting, was already present in the Ieq state. When folding started from the U state, however, cpRNA folded 15-fold faster than the native state. On this pathway, the intermediate prior to the RLS already contained the fully active C-domain, and the folding was limited by the formation of the S-domain rather than the disruption of the non-native inter-domain interaction. This result indicated that the rate of forming the non-native, inter-domain structure was slower than the formation of the native, intra-domain structures. The formation of native structure outpaced the formation of the metastable, non-native structure.
5.3 Rapid, error-free folding of the C-domain
In order to investigate the intrinsic RLS in RNA folding, we studied the folding of the C-domain from B. subtilis (Fang et al. Reference Fang, Pan and Sosnick1999a). Surprisingly, the folding of this 80 kDa RNA occurred on the ms time-scale and was not limited by the need to correct errors, the more typical RLS for large RNAs. This section details the equilibrium and kinetic steps in the folding pathway from the unfolded to the native state for this tertiary RNA (Fig. 9).
C-domain folding pathway. The amount of urea-sensitive surface area buried at each species is noted. The rate-limiting step is the interconversion between I1k and I2k, which represents a local consolidation of RNA structure about a pre-bound metal ion.

The equilibrium folding pathway of the C-domain consists of two major transitions: U-to-Ieq and Ieq-to-N (Fang et al. Reference Fang, Pan and Sosnick1999b, Reference Fang, Littrell, Yang, Henderson, Siefert, Thiyagarajan, Pan and Sosnick2000). The unfolded state contains varying amount of structure, depending on the solution condition and temperature. Prior to the addition of Mg2+, SAXS measurements (Fig. 2c) indicated that the R g of the unfolded state was ∼80 Å in the aqueous solvent (Uaq). For the unfolded state in 8 m urea (Uurea) where the residual structure was disrupted, the R g increased to 180 Å (Fang et al. Reference Fang, Littrell, Yang, Henderson, Siefert, Thiyagarajan, Pan and Sosnick2000). The addition of submillimolar amounts of Mg2+ resulted in the formation of Ieq and a dramatic collapse to a R g=46 Å (native value is 38 Å). The intermediate was highly structured, and formed at ∼5 times lower Mg2+ concentration than that required to fold the native structure (Fang et al. Reference Fang, Pan and Sosnick1999a, Reference Fang, Pan and Sosnickb, Reference Fang, Littrell, Yang, Henderson, Siefert, Thiyagarajan, Pan and Sosnick2000; Seifert et al. Reference Seifert, Winans, Tiede and Thiyagarajan2000). The Ieq species contained the native amount of secondary structure as well as some tertiary structure, according to absorbance measurements and an analysis of urea sensitivity. Regardless of the solution condition, however, Ieq had the same size, shape and structure suggesting that it was a defined thermodynamic state.
Folding to Ieq starting from Uaq and Uurea was investigated using stopped-flow absorbance spectroscopy. At 10°C and 37°C, the U-to-Ieq transition was over in <1 ms starting from either U state. Essentially, all the change in UV absorbance for the entire folding reaction to the native state occurred in this early step. Hence, an extensive conformational search occurred on the submillisecond time-scale and resulted in the formation of this highly structured, compact intermediate.
The Ieq-to-N transition was at least four orders of magnitude slower than the U-to-Ieq transition (Fig. 3). At high, saturating Mg2+ concentration (10 mm), the ribozyme folded with t ½∼23 s and 0·15 s at 10°C and 37°C, respectively. Folding was monitored by a change in fluorescence of a fluorescein attached to the 5′-end, which reported on the recovery of the native, catalytically active state. The C-domain folded at the same rate whether folding was initiated from either Uaq or Ieq, indicating that the Ieq-to-N transition was always rate-limiting.
The Ieq-to-N transition included the transient formation of two kinetic intermediates, I1k and I2k, with the RLS being the conversion between these two species (Section 3.2.2, Fig. 3). This kinetic folding pathway was deduced in part from the ‘Mg2+ chevron’ plot (Fang et al. Reference Fang, Pan and Sosnick1999a) which reported on the dependence of observed relaxation rate, k obs, on the Mg2+ concentration (Fig. 3c).
The flat ‘rollover’ regions at the extrema of the chevron plot provided evidence for the two kinetic intermediates (Matthews, Reference Matthews1987). On the folding side, k obs became saturated when the Mg2+ concentration was above 3 mm, indicating that a Mg2+-independent process became rate-limiting in the Ieq-to-N transition. Such a ‘rollover’ occurred because at high [Mg2+], the kinetic intermediate I1k was fully populated, as opposed to folding at intermediate [Mg2+] where the k obs was the product of k f times the (changing) population of I1k. Likewise, the rollover in unfolding rates at very low Mg2+ concentrations indicated that unfolding was limited by a Mg2+-independent step with the other kinetic intermediate, I2k, populating prior to the RLS in unfolding.
From the fit to the chevron data to Eq. (9), all six kinetic parameters were obtained. The relative equilibrium populations of the kinetic intermediates were calculated using the kinetic parameters obtained from the Mg2+ chevron. At all Mg2+ concentrations, the net population of I1k and I2k never exceeded 12% at equilibrium, consistent with our observation that no equilibrium intermediates are significantly populated in the Ieq-to-N transition.
Likewise, the equilibrium midpoint, K Mg, of the Ieq-to-N transition was calculated from the six kinetic parameters according to Eq. (11). The K Mg determined from the kinetic analysis (0·43±0·06 mm) was the same as the value determined from thermodynamic analysis (0·41±0·01 mm). In addition, the sum of the Hill constants from the Ieq-to-I1k and the I2k-to-N transitions (3·4±0·7) agreed with the Hill constant of the thermodynamic transition (n=2·7±0·5). Hence, the observed kinetic transitions completely account for all the free energy and the Mg2+ binding of the Ieq-to-N step. This equivalence indicated that no other intermediate species were significantly populated, and hence, provided strong support for the folding scheme with just two specific on-pathway intermediates.
Because k f and k u, the inter-conversion rates of the I1k-to-I2k transition, did not depend on the Mg2+ concentration, the RLS in C-domain folding did not involve a change in the net number of metal ions bound. Furthermore, the inter-conversion between these two intermediates was accompanied by minimal surface burial, as indicated by the identical folding rate at high Mg2+ concentration in the absence and presence of urea (Fang et al. Reference Fang, Pan and Sosnick1999a).
Rather than the formation of the kinetic intermediate I1k, one can consider that the rollover in the chevron plot was due to a change in the extent of ion interactions and the eventual saturation of both the native and intermediate forms at high ion concentrations. SAXS and fluorescent measurements, however, provided direct, independent evidence on the transient accumulation of I1k and I2k and the kinetic model Ieq↔I1k↔I2k↔N, without relying on chevron plots (Fang et al. Reference Fang, Thiyagarajan, Sosnick and Pan2002). Beginning from Ieq, folding occurred in two discrete steps according to SAXS (Fig. 10a, inset). Upon the addition of 10 mm Mg2+, the RNA rapidly collapsed to I1k, obtaining a R g that was only ∼1 Å larger than the native state. Subsequent acquisition of the native state occurred over five times slower. In fluorescence measurements (Fig. 10), two distinct kinetic phases were observed upon unfolding and refolding. The fast unfolding and folding phases corresponded to the formation of the I2k and I1k intermediates, respectively.
(a) Unfolding at low [Mg2+] occurs when folded RNA, initially at high [Mg2+], is diluted 10- to 200-fold with buffer alone. Then the unfolded RNA is refolded at high [Mg2+] upon addition of a concentrated Mg2+ solution. Two distinct kinetic phases are observed in both measurements. The fast unfolding phase corresponds to the formation of the I2k intermediate, followed by the slow phase leading to Ieq, whereas the fast folding phase corresponds to formation of the I1k intermediate, followed by the slow phase leading to the native state. Inset: This behavior is seen in refolding SAXS measurements where a rapid collapse phase to I1k is observed. (b) I1k and I2k are the only species incorporated into the kinetic scheme. (c) The amplitude of the fast refolding phase (A fast, blue) generates an equilibrium curve for the Ieq↔I1k transition with the same Mg2+ midpoint and Hill constant as those independently derived from a chevron analysis (see Fig. 3).

Additional support for the kinetic scheme comes from an analysis of the fluorescence amplitude for the fast phase in refolding measurements. The amplitude of this phase equates to the fractional population of the I1k, just as the signal amplitude in an equilibrium measurement equates to the fractional population of the equilibrium intermediate. The amplitude as a function of [Mg2+] can be fit with the same Hill-style analysis used to fit the chevron data. For the folding burst-phase amplitudes, the K Mg1 and n 1 match the values independently derived from the global analysis of the Mg2+ chevron using only the kinetic rates.
The Mg2+ dependence of the folding kinetics in the presence of 3 m urea also generated a chevron plot, but with a vertex shifted to higher Mg2+ concentration reflecting the destabilization of the ribozyme due to the urea. The same chevron-style analysis was applied to determine the kinetic parameters under this solvent condition. The dependence of these parameters on urea can be used to calculate the m values for each microscopic step of the reaction. The m values for the Ieq-to-I1k and I2k-to-I2k steps were 0·74±0·11 and 0·16±0·06 kcal mol−1 m−1, respectively. Their sum, 0·90±0·13 kcal mol−1 m−1, is equivalent to the m value for the entire equilibrium Ieq-to-N transition (1·0±0·1 kcal mol−1 m−1). Thus, these two steps accounted for all the surface burial in the Ieq-to-N transition, with Ieq-to-I1k transition accounting for ∼80% of the total burial.
Consistently, the m value is negligible for the RLS, the I1k-to-I2k transition. This result was based upon the observation that the folding rate, k f, at high Mg2+ concentration was independent of urea. As a result, Ieq-to-I1k and I2k-to-N transitions account for all the surface burial in the Ieq-to-N transition, again demonstrating that no other kinetic species were significantly populated and all the folding steps are accounted for in our folding scheme.
In summary, the kinetic pathway from the unfolded to the native state has four identifiable steps. The U-to-Ieq transition is very fast, occurring faster than a millisecond (Pan & Sosnick, Reference Pan and Sosnick1997; Fang et al. Reference Fang, Thiyagarajan, Sosnick and Pan2002). The formation of Ieq results in a dramatic collapse to a highly structured species with the native amount of secondary structure as well as some tertiary structure. The Ieq-to-N transition has three identifiable kinetic steps with an I1k folding and an I2k unfolding intermediate separated by a Mg2+-independent barrier. Importantly, these three kinetic steps account for all the free energy, the Mg2+ dependence (i.e. Hill constant), and surface burial of the equilibrium Ieq-to-N transition. This complete accounting strongly indicates that we have observed all the energetically significant and Mg2+-binding steps as well as all the surface burial events. Additionally, this result argues that both I1k and I2k species do not need to undo structure, and hence, are on-pathway intermediates. The same pathway is observed both for folding and unfolding. Therefore, the Ieq-to-N transition with its three obligatory steps is best described by a single, robust folding pathway. In the next section, we discuss the nature of the RLS between I1k and I2k.
5.4 The rate-limiting step in the folding of a large ribozyme without kinetic traps
In the absence of misfold/reorganization barriers, what process is rate-limiting in RNA folding? Local secondary structures can form in microseconds while long-range helices or loop–loop interactions may require an extensive conformational search and are likely to be slower. Alternatively, the limiting process may involve interactions between the RNA and the divalent metal ions. Metal ion-binding sites are crucial for maintaining the tertiary architecture of large RNAs (Cate et al. Reference Cate, Hanna and Doudna1997; Ferre-D'Amare et al. Reference Ferre-D'Amare, Zhou and Doudna1998; Ban et al. Reference Ban, Nissen, Hansen, Moore and Steitz2000; Jovine et al. Reference Jovine, Djordjevic and Rhodes2000; Shi & Moore, Reference Shi and Moore2000; Rupert & Ferre-D'Amare, Reference Rupert and Ferre-D'Amare2001). The formation of these sites is integral to the folding process as they are necessary to achieve the correct final structure.
Prior to the limiting step, as just discussed, the I1k species of the C-domain contains nearly all of the native structure. The high degree of compaction and structure formation in I1k is reflected in the SAXS data as well as in the surface burial measured previously by urea dependence (Fang et al. Reference Fang, Pan and Sosnick1999a). The urea m value, a valuable diagnostic of surface burial, for the I2k-to-N transition is only ∼0·2 kcal mol−1 m−1 whereas the total m value for the Uurea-to-N transition is estimated to be ∼9 kcal mol−1 m−1 (Shelton et al. Reference Shelton, Sosnick and Pan1999). Similarly, the difference in R g between I1k and N is only ∼1 Å, whereas the difference between Uurea and N is ∼140 Å (Fang et al. Reference Fang, Littrell, Yang, Henderson, Siefert, Thiyagarajan, Pan and Sosnick2000). Therefore, greater than 98% of the total surface burial and compaction has taken place upon the formation of I1k, relative to the fully unfolded state, Uurea. Furthermore, the folding rate of the limiting I1k-to-I2k transition is insensitive to urea, indicating that most of the remaining 2% of the structure forms after the limiting step, in the I2k-to-N transition (Fang et al. Reference Fang, Pan and Sosnick1999a). Because the inter-conversion rates between Ik-to-I2k do not depend on the Mg2+ concentration, the RLS in C-domain folding does not involve an uptake of additional metal ions for the bulk solution. These properties imply that the RLS is a small-scale event that involves only a minimal change in the RNA structure.
A comparison of the metal chevron analysis for four group IIA ions, Mg2+, Ca2+, Sr2+ and Ba2+ indicated that the RLS represents a small-scale consolidation of RNA structure around one or more pre-bound metal ions (Fang et al. Reference Fang, Thiyagarajan, Sosnick and Pan2002). The chevron plots for all four metal ions had a similar characteristic shape and could be analyzed according to the same kinetic scheme, Ieq-to-I1k-to-I2k-to-N. The chevron analysis for the four metal ions yielded the same Hill constant for the Ieq-to-I1k transition (n 1∼2, folding side) and for the I2k-to-N transition (n 2∼1, unfolding side). Folding and unfolding rates (k f and k u) saturated at high and low metal ion concentration, respectively. This behavior demonstrates that folding induced by all four metal ions goes through the same two kinetic intermediates (I1k and I2k) and has the same rate-limiting I1k-to-I2k transition.
For all metal ions, both k f and k u saturated at high and low ion concentrations, respectively. This result reaffirmed that the rate-limiting I1k-to-I2k step does not involve binding of a free metal ion to the RNA. Rather, the limiting step was a unimolecular event. On the other hand, k f and k u did depend on the particular divalent metal ion used to fold the RNA. Therefore, the RLS did involve at least one specific metal ion. But, these metal ions were already bound in the I1k intermediate, and did not represent binding or uptake of ions from the bulk solution. Because the RLS involved a metal ion, but was accompanied by little change in the RNA structure, we concluded that the RLS is a small-scale conformational change, or structural consolidation involving pre-bound metal ions.
This conclusion is in concert with crystallographic studies which indicate the divalent metal ions are present in the structure of all large RNAs. These metal ions are located in sites of high electrostatic potential which stabilize interactions between different structural motifs, and hence, are crucial for maintaining the tertiary architecture (Hermann & Westhof, Reference Hermann and Westhof1998; Chin et al. Reference Chin, Sharp, Honig and Pyle1999; Misra & Draper, Reference Misra and Draper2000; Klein et al. Reference Klein, Moore and Steitz2004). It is likely that the formation of one or more of these binding sites was rate-limiting in the folding of the C-domain, although concrete experimental evidence is still lacking.
The metal ion dependence of k f and k u has a linear dependence on the reciprocal of the ionic radius. As the ionic radius increases (Mg2+<Ca2+<Sr2+<Ba2+), the folding rate increases, while the unfolding rate decreases, by almost equal measures. Therefore, the consolidation step is more destabilizing for the smaller metal ion (ΔG=−RT ln (k f/k u)). For the smallest ion, Mg2+, the consolidation requires 1·9 kcal mol−1 of free energy, while for the largest ion, Ba2+, the consolidation is energetically neutral. However, the binding affinity of a metal ion to the RNA is stronger for the ion with smaller radius. This apparent contradiction is reconciled by smaller ions binding tighter in the initial, bimolecular binding event even though in the subsequent, unimolecular RLS, larger ions are favored.
The stronger the metal ion binds to the RNA, the slower is the folding rate and the faster is the unfolding rate. Potentially, the consolidation of the RNA around the smaller ions is more difficult because of steric and/or electrostatic crowding of the negatively charge RNA backbone. A more detailed model, based upon the crystallographic observation of multiple RNA ligands around a divalent ion, envisions the I1k-to-I2k transition to involve an increase in the number of RNA ligands around the pre-bound divalent metal ions. This model rationalizes the slower k f and the faster k u, as well as the free energy difference between I2k and I1k. Within an extremely constrained environment, a smaller ion shuns the bulkier and charged RNA ligand. The overall binding affinity for the particular metal ions in the RLS, however, may still be higher for the smaller ions. This increase in affinity is due to the more favorable metal ion binding for the smaller ions upon the formation of I1k (K 1). The overall binding affinity would represent the combined free energy of the favorable binding step and the unfavorable, increased electrostatic and steric crowding after the RLS.
Further indication that pre-bound metal ions are involved in the RLS is derived from the temperature dependence of the folding rate, k f. The activation enthalpy appears to correlate with the binding affinity of the metal ion to the RNA – the stronger the binding affinity, the higher is the activation enthalpy. A correlation also exists between the activation enthalpies and those of dehydration for these metal ions (Helm & Hertz, Reference Helm and Hertz1981), potentially indicative of a change in the hydration state of the metal ions at the limiting step.
5.5 Folding of the B. subtilis S-domain
5.5.1 Investigating kinetic barriers to folding
The folding of the S-domain followed a similar equilibrium U-to-Ieq-to-N pathway as the C-domain. However, the folding rate of the B. subtilis S-domain (0·075 s−1) was ∼100-fold slower than that of the C-domain. When folding was initiated from the U or Ieq state, the folding rate for the S-domain was unchanged, indicating that the Ieq-to-N transition was always rate-limiting. The burst phase amplitudes for the CD signal at 275 nm for both folding and unfolding experiments indicated the presence of a folding and an unfolding intermediate, as was observed in the folding of the C-domain (Fig. 10). In addition, SAXS studies on the S-domain indicated that the chain undergoes a major collapse phase within the dead time of the experiment (<1 s) when folding is initiated from Ieq, giving further credence to the presence of a distinct kinetic folding intermediate. Hence, the Mg chevron was analyzed with the same Ieq-to-I1k-to-I2k-N folding scheme as was done for the C-domain (Section 3.2.2, Fig. 3).
The folding arms of the chevron were obtained by varying the final Mg2+ concentration. The kinetic chevron plot saturated at high Mg2+ concentrations, where the rate became insensitive to bulk Mg2+ concentration. The unfolding arm also appeared to rollover at low Mg2+ concentrations, though the data began to approach the instrumental limit. A fit to the chevron incorporating two kinetic intermediates yielded a Hill coefficient, n 1, for the folding arm 1·7±0·1, and for the unfolding arm, n 2=5·7±0·2. The Hill coefficient from the equilibrium titration is n eq∼5, and hence, n 1+n 2>n eq. According to the kinetic scheme where the I1k-to-I2k step does not involve the uptake of addition ions, n 1+n 2 should equal n eq. The disparity may be due to the experimental uncertainty or a peculiarity of the S-domain.
The kinetic intermediate, I1k, is indicated by the rollover in the folding arm with a K 1=3·0±0·4 mm Mg2+. The presence of this kinetic intermediate is corroborated by a separate analysis of the amplitude of the folding rate which yielded K 1=2·7±0·4 mm Mg2+. In the Ieq-to-I1k transition which occurs prior to the RLS, there is limited structure formation as compared to the I2k-to-N transition which follows the RLS and a larger Hill constant (n 2). This difference is in accordance with the amount of surface area burial as measured by urea m value (see Section 5.5.2).
The relatively slow folding of the S-domain opened up the possibility that its folding pathway is limited by the breaking of non-native contacts. For kinetically trapped RNAs, an increase in urea concentration has been shown to prevent or destabilize non-productive structure formation, leading to an increase in folding rate (Pan et al. Reference Pan, Thirumalai and Woodson1997; Pan & Sosnick, Reference Pan and Sosnick1997). Hence, we performed chevron analysis in the presence of 2 m urea for the S-domain. If non-native contacts were limiting the folding process one would have expected faster folding and unfolding in the presence of urea. On the contrary, folding rates were slower under all conditions except at high, saturating Mg2+ concentrations where the rate was unchanged (Fig. 11a). These results suggested that the non-native base pairs modeled in the intermediate (Section 4.6) did not measurably affect the folding rate when probed with urea. The independence of k f to urea at saturating Mg2+ concentrations, which represents the rate of crossing the barrier between I1k and I2k, indicated that the RLS did not involve burial of significant amounts of surface area.
S-domain folding kinetics. (a) Chevron plots for the S-domain in standard conditions (black), 2 m urea (red), and 150 mm NaCl (blue). Rollover occurs in the folding arm with the final k f identical under all conditions (∼0·075 s−1). From the shift in the urea folding arm a m f value can be calculated and correlated to the amount of surface area buried in the Ieq-to-I1k transition. (b) The folding rate in D2O remains unchanged over the range of 0–100% D2O. Conversely, the folding rate in H2O for Mg2+ (black), Ca2+ (turquoise), Sr2+ (blue), and Ba2+ (red) depends on the metal ion identity.

If the breaking of non-native contacts were rate-limiting, one also may have expected folding rates to decrease in the presence monovalent cations. For example, NaCl could stabilize non-native base-pairing in I1k. Accordingly, we repeated the folding measurements in 150 mm NaCl but found the folding rate to be unchanged at saturating Mg2+ concentrations (Fig. 11a). In aggregate, the data did not indicate that the breaking of non-native contacts was the slow step in S-domain folding.
The insensitivity of the final folding rate to NaCl also implied that electrostatic repulsion of the phosphate backbone was unlikely to contribute to the height of the limiting barrier. If such repulsion contributed to the barrier, measurements in NaCl should yield faster folding and slower unfolding rates due to the charge neutralization provided by the monovalent cations. However, folding was slower or unchanged while unfolding was always faster in the presence of 150 mm NaCl. This data in conjunction with the insensitivity to the presence of urea indicated that the RLS most likely was a small-scale folding event.
We also investigated whether a reaction involving a hydrogen atom was involved in the limiting step (e.g. hydrogen bond formation, hydrogen transfer, or change in solvation). In protein folding studies, the change in folding rate of proteins with deuterated backbone amide protons was used to identify the fraction of hydrogen bonds formed in the transition state and the effect of solvent (Krantz et al. Reference Krantz, Moran, Kentsis and Sosnick2000, Reference Krantz, Srivastava, Nauli, Baker, Sauer and Sosnick2002). For the S-domain, we performed folding measurements in 0, 20, 40, 60, 80 and 100% D2O at saturating Mg2+ concentrations. Folding rates were identical under all conditions (Fig. 11b). Hence, the RLS does not involve a reaction sensitive to deuteration of either the exchangable imino and amino protons on the base, the 2′-OH on the sugar ring, or the solvent molecules.
The saturation of the folding rate at high [Mg2+] indicated that the RLS did not involve an uptake of an additional metal ion from the bulk solution. However, the RLS could still involve a pre-bound metal ion, as was observed in the folding of the C-domain. Hence, we measured k f for folding induced by four group IIA ions: Mg2+, Ca2+, Sr2+ and Ba2+. At saturating Me2+ concentrations, the folding rate exhibited a dependence on the identity of the metal ion with k Ba<k Sr<k Mg<k Ca (Fig 11b). This observation of ion-specificity corroborated the involvement of a specific, pre-bound ion in the RLS. In addition, the trend was similar to that found for the C-domain where the rate was slower for the smaller ions (k Ba<k Sr<k Ca<k Mg). For the C-domain, we postulated that the trend was because the rate-limiting bonding of additional ligands was more difficult around smaller ions due to electrostatic and/or steric repulsion of the ligands.
In total, the general folding properties of the S-domain, including the dependence on type of metal ion but the lack of dependence on urea, NaCl, D2O concentration, supported that view the RLS involves the consolidation about a specific metal ion-binding site. Nevertheless, the S-domain was grouped in the slow class based on evaluation of the RedCO parameter. Perhaps the consolidation about the specific metal ion was more difficult, for example, because the RNA ligand could not as readily chelate the metal ion.
5.5.2 Modeling kinetic intermediates
We were able to describe structural aspects of the Ieq-to-I1k-to-I2k-to-N transition using the Hill coefficient, m value, R g, and site-specific structural mapping data. For example, the fit to the kinetic chevron yielded n 1∼1·7 and n 2∼5·7, where n 1 and n 2 represent a lower bound on the number of ions involved in the transition. This indicated that more ion uptake occurred after the RLS, correlating with more structure formation. As mentioned above, the presence of 2 m urea did not affect the folding rate at saturating Mg2+ concentrations. However, at sub-saturating metal ion concentrations the folding rate was slowed while the unfolding rate quickened (Fig. 11a). These observations generated information regarding the surface area burial for the Ieq-to-I1k and the I2k-to-N transitions (see Section 3.2.1). In 2 m urea, the K 1 shifts to ∼4·9 mm. Using Equation (7), the m value for folding (m f) is ∼0·26 kcal mol−1 m−1. This is small relative to the equilibrium m value for the Ieq-to-N transition, m eq∼1·5 kcal mol−1 m−1. The kinetic data in 2 m urea did not exhibit rollover under the conditions monitored. Therefore, a direct measure of m u from a chevron fit of K 2 and n 2 was not feasible. Nevertheless, it was clear that more surface area was buried in the I2k-to-N transition than in the Ieq-to-I1k transition.
In the U-to-Ieq transition, about 75% of the total surface area was buried. Likewise, the majority of collapse had occurred, ΔR g∼26 Å (Fig. 12a). In comparison, the Ieq-to-N transition had an ΔR g∼8·8 Å. Kinetic measurements indicated that within the dead-time of the instrument (<1 s) the S-domain collapsed by ∼7·4 Å from the starting Ieq state. The resulting I1k intermediate was very compact with near-native dimensions. Relative to the entire Ieq-to-N transition, the Ieq-to-I1k portion has the majority of the ΔR g but the minority of the m value: 85% of the compaction but only 17% of the surface area burial occurred in this part of the Ieq-to-N transition. The apparent disparity between the two parameters can be rationalized by noting that structures with the same R g can have much different surface burial (Fig. 12b).
(a) A trace of SAXS R g over time includes a burst and slow phase when folding is initiated from Ieq. The burst phase involves a large degree of collapse to I1k. The slow phase has the same rate (∼0·075 s−1) as folding experiments monitored by CD. (b) A two-dimensional diagram illustrating how two structures can have the same radius of gyration (dashed red line) but different amounts of surface area buried. (c) Two I1k models have been created in agreement with the SAXS R g. The experimental ΔR gI1k→N∼1·4 Å while the models have ΔR gI1k→N∼1·2 Å (Model A) and ∼2·0 Å (Model B).

The native structure and the Ieq model provided a framework within which to build a model of I1k. The dominant unfolded elements in the Ieq model are the core and the TL–receptor interaction. Additional minor interactions are also missing in the Ieq model but are likely to serve as outer latches, forming after the dominant structural regions. Hence, the I1k intermediate is likely to begin with the structural arrangement of either the core or the TL receptor. Using T1 nuclease we found that protection of G205, which was involved in the TL–receptor interaction, occurred in the slow phase and has a rate of ∼0·08 s−1. This result provided evidence that the TL receptor was not formed in the Ieq-to-I1k transition. The delayed folding of the TL receptor was not surprising, as the formation of the TL receptor was expected to bury more surface area than negligible amount expected from the small observed m f value.
Two models of I1k were created with the structural elements having the observed R g but without the TL–receptor interaction (Fig. 12c). I1k must have a R g within ∼1·4 Å of the native structure. This necessitated that the P12 arm had a largely native-like orientation relative to the core. The P10.1 arm must have rotated around from its original position in the Ieq model. The difference in the orientation of P10.1 between the models can be attributed to the different core interactions present in each model. The two models exhibit some structural variability (ΔR gI1k→N ∼2·0 Å and ∼1·2 Å) yet fall within the error of the experimental data. Further modeling would require additional chemical mapping to determine which of the core nucleotides are present in I1k. Both of the models bury very little surface area relative to Ieq, in agreement with the small m f. The large m u value for the I2k-to-N transition would be rationalized by the formation of the final pieces of native structure: the TL receptor, a number of core interactions, and some tertiary stacking interactions.
5.6 Mutational studies to dissect folding pathways
A variety of strategies are available to characterize folding pathways and their transition state ensembles (TSE). These methods include the measurements as a function of temperature (ΔH ‡), ion concentration (Hill constant, n, and transition midpoint, K Me), denaturant concentrations (m value, surface area burial), mutations [φ value, energetic participation in the transition state (Matthews, Reference Matthews1987; Fersht et al. Reference Fersht, Matouschek and Serrano1992; Goldenberg, Reference Goldenberg and Creighton1992; Silverman & Cech, Reference Silverman and Cech2001; Bartley et al. Reference Bartley, Zhuang, Das, Chu and Herschlag2003; Bokinsky et al. Reference Bokinsky, Rueda, Misra, Rhodes, Gordus, Babcock, Walter and Zhuang2003)] or exogenous ligand binding [ψ value, metal ion-binding site formation (Krantz & Sosnick, Reference Krantz and Sosnick2001; Krantz et al. Reference Krantz, Dothager and Sosnick2004; Sosnick et al. Reference Sosnick, Dothager and Krantz2004)].
Of these, mutational φ analysis has been a major method for characterizing the structure of transition states (TS) in protein folding. The stabilization of the TS due to the mutation is determined relative to the change in the equilibrium stability of the individual mutant forms in order to normalize for the change in ground state free energy: φ=ΔΔG f‡/ΔΔG eq. Under the assumption that the mutation does not alter the TS structure or introduce in new pathways, the φ value represents the fractional energetic participation of the mutated residue in the TSE. Values of 0 and 1 are taken to indicate that the influence of the side-chain is either absent or fully present, respectively, in the TS.
Application of this method in protein folding can be relatively straightforward [although not necessarily the interpretation (Feng et al. Reference Feng, Vu, Zhou and Bai2004; Sosnick et al. Reference Sosnick, Dothager and Krantz2004)]. The folding reaction often is limited by a single barrier and intermediates do not accumulate under two-state conditions. Folding and unfolding rates as a function of denaturant concentration are readily measured for the wild-type and mutant proteins, generating denaturant chevron plots. From the relative shift of the folding and unfolding arms and the vertex of the mutant's chevron, the φ value can be determined.
In principle, this strategy can be applied to RNA folding. For RNA folding, however, the application is more challenging as folding is multi-state, with thermodynamic and kinetic intermediates populating as a function of [Mg2+]. Rates are governed by the relative stabilities of the intermediates and the kinetic barriers that separate them. Mutations can affect either the intermediates and/or the barriers, and do so in a Mg2+-dependent manner. As a result, the accurate identification of the particular kinetic step(s) affected by the mutations on the basis of changes in folding rates can be extremely challenging.
Before presenting our kinetic data on variants of the C-domain, it is useful to discuss the possible outcomes of mutational studies. The kinetic folding transition leading to the native state is well approximated with four microscopic states and a TS for the RLS: Ieq↔I1k↔TS↔I2k↔N. The effects of mutation on the microscopic transitions can be identified by comparing the chevron-derived parameters of the wild-type RNA to those of the mutant RNA. For example, the effects on the populations of I1k and I2k are identified by changes in K 1 and K 2, respectively, while the effect on the TS separating these two species is determined by changes in k f and k u. (Fig. 13). This strategy is applicable when the pathway of the mutant retains the same intermediates, TS, and their relative order.
Potential effects of mutations on Mg2+ chevrons. A mutation can change a microscopic parameter which results in a change in the free energy surface and the chevron plot (black to red traces). Wild-type trace was generated with K 1, K 2, k f, k u, n 1 and n 2=0·1 mm, 0·01 mm, 0·1 s−1, 0·5 s−1, 2 and 1, respectively. The possibility of n 2 increasing by 1 is more complicated and is illustrated in Fig. 14.

However, mutations can perturb the pathway either by changing the order of the intermediates or the relative heights of the kinetic barriers separating the intermediates (Figs 13, 14). Either of these two possibilities can alter which barrier is rate-limiting. A mutation could move the relative position of the RLS so that some structure which formed before the RLS in the wild-type RNA now forms afterwards in the mutant RNA. A signature of this shift would be an increase in the observed folding rate's sensitivity to denaturant (m 2wt≠m 2mutant or Mg2+ concentration (n 2wt≠n 2mutant). This scenario could occur even if the total amount of structure in the Ieq-to-N transition remains unchanged, e.g. m eqwt=m eqmutant and n eqwt=n eqmutant.
Three possible effects of a hotspot mutation that increases n 2, the effective Hill coefficient for unfolding, as determined from a Mg chevron. The I state represents an early folding intermediate which is the thermodynamic reference state, Ieq, for the mutant RNA. Each folding step is denoted by the additional structural element that folds: +a, +b, +c or +d. The Ia+b+c+d species with all four elements folded is the native state. For the wild-type, less structure forms in the Ieq↔N transition, and hence its Ieq is more structured than that of the mutant RNA. The structural element whose formation is rate-limiting is highlighted with a ‘‡’.

Likewise, the shift in the amount of structure formation prior to the RLS could occur either when the RLS is explicitly changed (e.g. associated with a different structural event:  becomes
 ), or an inversion in the order of structure formation of two components (e.g. wild-type: A→B→C, mutant: A→C→B) (Fig. 12).
In addition to these effects, mutations also can change the structure of the intermediates (Fig. 14). As discussed in Section 4.5, the C-domain has the thermodynamic hotspots which result in a less structure in the Ieq state. As a consequence, the total amount of structure which forms in the Ieq-to-N transition increases in the C-domain from the thermophile compared to the mesophile: m eqwt<m eqthermo; n eqwt<n eqthermo(Figs 4, 5) (where the thermophile is considered a mutant of the mesophile). There are differences, although to a lesser extent, in the amount of structure formed in the transition for the hybrid C-domains. As a result, some of the structure present in the Ieq of the wild-type Cmeso must be absent in the Ieq of the other C-domains. The folding of the structures missing from their Ieq becomes part of their particular Ieq-to-N transitions.
With these issues in mind, we investigated the folding of C-domain from the thermophile and two particular hybrids using Mg2+ chevron analysis. Our results indicate that the thermodynamic hotspots also are kinetically hot, having a significant impact on the folding pathway. These mutations likely alter the order of structure formation, but they still can be used to identify specific regions of RNA structure that form before the RLS in the folding of the wild-type Cmeso ribozyme.
The hotspot mutants altered the cooperativity of the folding transition to the native state as is indicated by changes in the Hill constant n (n eq) and the urea m value (m eq). Two general classes of behaviors were observed: mutations in the P3, P18, L15, P2 and P19 regions did not affect n eq and m eq, whereas mutations in the P1, P15.1 and multiple junctions (J) increased n eq and/or m eq. The P1 and P15.1 mutations increased n eq from 3 to 4, and m eq from 1·0 to 1·3–1·7 kcal mol−1 m−1. The J mutation did not change n eq, but increased m eq from 1·0 to 1·6 kcal mol−1 m−1. As the native structure of these mutants is very similar to the wild-type Cmeso, these results indicate that the amount of structure in the major Ieq for each these hotspot mutants has been reduced relative to the amount in the original Cmeso intermediate (see Table 1).
Kinetic and thermodynamic folding parameters for the mesophile, thermophile, and hybrid C-domainsFootnote *

* Units for urea m values are kcal mol−1 m−1.
We obtained Mg2+ chevrons for Cthermo and the two hydrids that contain hotspot substitutions either in P1 or P15.1, and compared them to the original chevron obtained for the wild-type Cmeso (Fig. 15). The folding kinetics of the three RNAs are measured using fluorescence of a 5′-fluorescein. The chevrons retain the characteristic shape with the rate saturating at high [Mg2+], indicative of a kinetic intermediate (I1k) populating prior to the RLS. The unfolding rates at very low [Mg2+] are significantly faster than Cmeso for all mutants and do not plateau within our experimental limits (>4 s−1). Despite the uncertainty in the saturation in the unfolding rate at very low [Mg2+], we interpret the data with the same, minimal three-transition scheme illustrated for Cmeso (Fig. 1b). Once again, this scheme recapitulates the equilibrium folding study for P15.1 and P1 mutants in that n 1+n 2=n eq and m 1+m 2=m eq (see Table 1). For Cthermo, however, this minimal three-transition scheme may no longer be adequate as n 1+n 2<n eq and m 1+m 2<m eq.
In addition to changes in the amount of structure in Ieq, the I1k structures are different for the four ribozymes. For the Ieq-to-I1k transition, the P15.1 and P1 mutants have the same n 1 and a similar m 1 compared to Cmeso. Nevertheless, the equilibrium studies indicate that the Ieq for each of these two mutants is less structured than that for Cmeso. As they start from a less structured Ieq species and a similar amount of structure is formed in their Ieq-to-I1k transitions, the I1k of the two mutants must be less structured than that for Cmeso.
For the Cthermo folding, the Ieq-to-I1k transition has a larger n 1 and m 1 compared to Cmeso. Because the Ieq of Cthermo started with less structure than the mesophile and hybrids, these increased values bring the amount of structure in I1k closer to the amount in the other I1k's. But, the value of m 1 is insufficient to allow I1k of Cthermo to ‘catch up’ completely, and hence it is less structured than the I1k's of the other three variants. In all cases, therefore, the amount of structure in the I1k species is different between the Cmeso, Cthermo, and the two hotspot mutants.
For all four variants, the folding rate saturates at high [Mg2+], indicating that the rate-limiting, I1k-to-I2k transition does not depend on bulk Mg2+ ion concentration. Likewise, the saturating rate is independent of urea concentration, indicating that this step buries a negligible amount of surface area. Hence, minimal structure is formed for this portion of the reaction for each the four variants suggesting that for each variant, its particular I1k and I2k species are similar to each other, even though the two species are different for the four ribozymes. In conjunction with the difference in the I1k structures, we conclude that the amount of structure in I2k species must also be different between the four ribozymes.
The observation that the Ieq, I1k and I2k states all have different structures for the four C-domains can be illustrated by plotting the fraction of surface burial for each kinetic folding step (Fig. 15a). The amount of burial is referenced to the difference between a completely unfolded state, U′, obtainable upon the addition of 8 m urea and 1 mm EDTA and the native state, N. This choice of reference condition is chosen as the amount of structure formed in the U′ state and the N state is nearly constant for all four variants.
(a) Fraction surface buried during folding (urea m value) as determined from Chevron analysis for Cmeso, Cthermo, and the P15.1 and P1 hybrids (see Fig. 4). (b) Chevron plots of two hotspot mutants and Cthermo superimposed with Cmeso (red line) in the absence (closed circles) and presence of 1·5 m urea (open circles).

The resulting graph shows that the amount of surface burial after each transition, U′-to-Ieq, Ieq-to-I1k, I1k-to-I2k, I2k-to-N, is different for each of these four C-domains. For all four ribozymes, the rate-limiting I1k-to-I2k transition does not depend on free Mg2+ concentration in solution, and is accompanied by negligible surface burial. The increased amount of structure formation after the RLS in the hotspot mutants and Cthermo comes at the expense of the amount of structure formed before the RLS.
The major experimental result is that the n 2 and m 2 values are bigger for the I2k-N transition for the three more stable RNAs, compared to Cmeso. This result indicates that the majority of structural changes induced by the hotspot mutation influence steps after the rate-limiting, I1k-to-I2k transition. That is, the last of the three microscopic transitions accounts for most of the increased amount of structure formed in the Ieq-to-N transition for the three more stable C-domains. Thus, the predominant difference between the folding pathway of Cmeso and that of the other three RNAs is that more structure is formed after the rate-limiting I1k↔I2k transition for these three RNAs.
Assuming a sequential, but not necessarily the same pathway for all four RNAs, the shift in structure formation from before to after the RLS indicates that in the more stable RNAs either (i) the RLS itself is unchanged, but it occurs earlier in the pathway with some structural elements which had folded before the RLS now fold afterwards; or (ii) the RLS itself has changed, for example, being associated with the formation of a different metal ion-binding site. These options are illustrated in Fig. 14.
Without identification of the structural event associated with the RLS, both options are viable. However, the similarity in the observed rate at saturating [Mg2+] (i.e. k f of the I1k→I2k transition) along with similar values ΔH ‡ in the presence of Mg2+, Ba2+, Sr2+, and Ca2+ (data not shown) suggests that the RLS is unchanged for the four RNAs. Hence, a shift in the order of structure formation along the pathway is likely to be operational for this set of hotspot mutations.
In summary, mutational analysis has the potential to delineate RNA folding pathways. Mutations used in such studies should perturb the stability of the RNA. However, these mutations often have significant effects on the folding pathway. For example, the interesting ‘hotspot’ mutations associated with the thermophilic RNA's enhanced stability altered the properties of the equilibrium and kinetic intermediates. In addition, these mutations appear to influence the order of structure formation along the folding pathway. As a result of such complications, the standard assumptions made in mutational studies may no longer hold. In these situations, deducing the order and properties of individual folding steps will be challenging even when complete Mg2+ chevrons are obtained.
6. Single-molecule studies
Single-molecule studies have come to RNA folding with a flourish. These studies generally come in two flavors, either observation using fluorescence resonance energy transfer (FRET) of equilibrium fluctuations (Ha et al. Reference Ha, Zhuang, Kim, Orr, Williamson and Chu1999; Zhuang et al. Reference Zhuang, Bartley, Babcock, Russell, Ha, Herschlag and Chu2000, Reference Zhuang, Kim, Pereira, Babcock, Walter and Chu2002; Kim et al. Reference Kim, Nienhaus, Ha, Orr, Williamson and Chu2002; Russell et al. Reference Russell, Zhuang, Babcock, Millett, Doniach, Chu and Herschlag2002) and folding-induced by Mg2+ injection (Ha et al. Reference Ha, Zhuang, Kim, Orr, Williamson and Chu1999), or force-induced unfolding measurements using optical trapping methods (Liphardt et al. Reference Liphardt, Onoa, Smith, Tinoco and Bustamante2001).
The equilibrium folding of the C-domain from B. subtilis was investigated by FRET by Scherer and co-workers (Xie et al. Reference Xie, Srividya, Sosnick, Pan and Scherer2004). Histogram analysis of the single-molecule FRET efficiency at five Mg2+ concentrations revealed the presence of the unfolded, Ieq and native states along with two previously undetected folding intermediates. The trajectories exhibited non-two-state and non-ergodic behaviors at intermediate Mg2+ concentrations on the seconds time-scale (Fig. 16a). The trajectories at intermediate Mg2+ concentrations were classified into five classes based on three FRET levels with very few molecules converting from one class into another during the measurement (Fig. 16b). This heterogeneity, together with the observation of ‘non-sudden jump’ FRET transitions, indicated that the early folding steps of this ribozyme involve a series of intermediates with different degrees of kinetic isolation and that folding is under kinetic control and involves many ‘local’ conformational switches.
Single-molecule folding studies of C-domain in 0·1 mm MgCl2. (a) Two representative FRET trajectories. (b) Histograms derived from 29 such FRET trajectories using the first 200 time-points of each trajectory. Solid curves are lognormal and Gaussian fits of the distributions with four population states. (c) Free energy contour plot for the 3′–5′ end proximity. The dotted gray boxes highlight three non-fluctuating classes with E FRET=0–0·2, 0·3–0·5, 0·8–1 corresponding to a distance of >6·3, 6·3–4·2 and <4·2 nm for the FRET pair. The two fluctuating classes, reflected by two pairs of closely connected basins, are indicated by arrows, one at E FRET=0–0·2 and 0·2–0·4, the other at E FRET=0·5–0·7 and 0·7–0·9. They correspond to low-to-medium and medium-to-high FRET conversion, respectively. The depth of each well is proportional to the logarithm of the area under each of the probability distributions in the histograms.

A minimalist analysis of the time trajectories implemented wherein the FRET signal was divided into low (⩽0·2), medium (0·2–0·8) and high (⩾0·8) ranges. Each single-molecule FRET trajectory was then classified as fluctuating or non-fluctuating depending on whether they underwent a conversion between the three FRET levels during the measurement time. Using this description, a total of five subpopulations was found: three non-fluctuating classes corresponding to low, medium and high FRET levels, and two dynamic classes with either low-to-medium or medium-to-high FRET fluctuations within the current trajectory durations. Direct low-to-high FRET fluctuation was very rare. Molecules with fluctuations ‘low-to-medium’ and ‘medium-to-high’ were observed to be mutually exclusive within the 10-s time-frame before bleaching occurs. This finding suggested that most molecules maintained a dynamic pattern for the time of the measurement. More ergodic behavior, however, may have occurred on longer time-scales. A two-dimensional energy contour plot of the folding landscape was generated to describe this complex behavior (Fig. 16c).
The complex dynamics with non-ergodic behavior presumably results from the large size of the C-domain and the distribution of secondary and tertiary structural motifs. Subpopulations undergo different structural interconversions on the seconds time-scale. Because the single- molecule buffer contains 50 mm Na+, it is likely that most secondary structures already existed and the kinetic heterogeneity arose from the slow interconversion between the native and non-native secondary structures.
7. Conclusion and perspectives
RNA folding studies aim to identify the principles and relationships between sequence, structure, dynamics and biological function. We have been conducting mechanistic studies of RNA folding for 9 years. The next step in making fundamental progress in RNA folding requires probing at the residue level. In the last 3 years, major advances in this field include the solution of four crystal structures of RNase P RNA and its domains (Krasilnikov et al. Reference Krasilnikov, Yang, Pan and Mondragon2003, Reference Krasilnikov, Xiao, Pan and Mondragon2004; Kazantsev et al. Reference Kazantsev, Krivenko, Harrington, Holbrook, Adams and Pace2005; Torres-Larios et al. Reference Torres-Larios, Swinger, Krasilnikov, Pan and Mondragon2005). These crystal structures enable one to make fundamental advances in understanding the folding of this large ribozyme and its subdomains. One is no longer limited to the identification of folding intermediates in qualitative terms. Using crystal structures as starting points, folding intermediates now can be modeled at the residue level through a combination of experimental data and molecular modeling to produce unprecedented insights on how folding takes place and address specific, residue-level questions in all aspects of RNA folding.
8. Acknowledgments
This work was supported by a grant from the NIH (GM57880; T.P., T.R.S.).