Introduction
In a description and classification of ganglion cells in rabbit retina with the largest cell bodies, large axons, and wide-spreading dendritic trees (Famiglietti, Reference Famiglietti2004a ), seven types were identified. These were grouped in two classes and were judged equivalent to the “brisk” (X and Y) ganglion cells of physiological studies (Caldwell & Daw, Reference Caldwell and Daw1978). In addition to the parameters of size and level of dendritic stratification in the inner plexiform layer (IPL), quantitative analysis of dendritic branching patterns was used to characterize and aid in the classification of these cells (Famiglietti, Reference Famiglietti2004b ).
Six of the seven types of ganglion cell were present in “paramorphic pairs”, i.e., present as both type a (OFF-center) and type b (ON-center) cells (Famiglietti & Kolb, Reference Famiglietti and Kolb1976). Class I cells of types Ia1, Ia2, Ib1, and Ib2 have the largest cell bodies and include ganglion cells termed “alpha cells” in other studies (Peichl et al., Reference Peichl, Ott and Boycott1987). They also include homotypically dye-coupled ganglion cells (cf. Bloomfield & Xin, Reference Bloomfield and Xin1997) and were judged to include the “Y” cells of physiological studies (Jensen, Reference Jensen1991). In comparison to class I cells, which they resemble closely, class II cells (IIa, IIb1, and IIb2) are slightly smaller than class I cells, significantly so outside the visual streak (Famiglietti, Reference Famiglietti2004a ). Two of these were judged equivalent to the ON- and OFF-center “X” cells of physiological studies.
Class IIb2 cells were found to co-stratify with and form intimate contacts with wide field cone bipolar cells in sublamina b (Famiglietti, Reference Famiglietti2008), and the latter were postulated to connect exclusively with blue cones (Famiglietti, Reference Famiglietti1981b ), a relationship subsequently confirmed (MacNeil & Gaul, Reference MacNeil and Gaul2008). Because most “ON-center X” ganglion cells were found to be blue-green color-coded (Caldwell & Daw, Reference Caldwell and Daw1978), IIb2 cells could be regarded as the morphological counterpart of ON-X cells (Famiglietti, Reference Famiglietti2008). Recently, this identity was confirmed; ganglion cells with the morphology and stratification of IIb2 cells were demonstrated to have blue-green color-coded responses (Marshak & Mills, Reference Marshak and Mills2014; Mills et al., Reference Mills, Tian, Hoshi, Whitaker and Massey2014). Caldwell and Daw (Reference Caldwell and Daw1978) found that OFF-center X cells in rabbit retina are similar to ON X cells, but not color coded. Thus class IIb2 cells were paired with class IIa cells, which they resembled closely in dendritic field size and branching pattern (Famiglietti, Reference Famiglietti2004a ,Reference Famiglietti b ), and the latter were regarded as OFF-center X or brisk-sustained ganglion cells (Jensen, Reference Jensen1991). Problematic was the functional equivalent of the unpaired class IIb1 ganglion cell.
Recent physiological studies of rabbit retina employing intracellular staining have subdivided ON-directional selective (DS) ganglion cells into two types, termed “transient” and “sustained”, with different responses to standing contrast, different morphology, and differences in dye coupling (Kanjhan & Sivyer, Reference Kanjhan and Sivyer2010; Hoshi et al., Reference Hoshi, Tian, Massey and Mills2011). In retrospect, comparing dendritic morphologies and coupling of intracellularly stained cells, those authors recognized that the transient type (ON DS-t) had also been studied by Bloomfield and collaborators (Ackert et al., Reference Ackert, Wu, Lee, Abrams, Hu, Perlman and Bloomfield2006, Reference Ackert, Farajian, Volgyi and Bloomfield2009). The responses of ON DS-t cells to standing contrast were also observed to be brisk and of short latency, in contrast to the more sluggish responses of ON DS-s cells (Hoshi et al., Reference Hoshi, Tian, Massey and Mills2011). Given the similarity in preferred directions and preference for low stimulus velocity of the two types, previous studies of ON DS ganglion cells using extracellular recording most likely included both types (Barlow et al., Reference Barlow, Hill and Levick1964; Levick, Reference Levick1967; Oyster, Reference Oyster1968; Caldwell & Daw, Reference Caldwell and Daw1978; Ariel & Daw, Reference Ariel and Daw1982b ). It is the morphology of ON DS-s ganglion cells; however, that was identified with ON DS cells in prior studies employing intracellular staining combined with physiological identification (Amthor et al., Reference Amthor, Takahashi and Oyster1989b ; He & Masland, Reference He and Masland1998). Ganglion cells projecting to the medial terminal nucleus of the accessory optic system (AOS) (MTNP cells) all had this same morphology of ON DS-s cells (Buhl & Peichl, Reference Buhl and Peichl1986), and the distinctive dendritic branching patterns and dendritic stratification of MTNP/class IVus1 ganglion cells have been analyzed quantitatively (Famiglietti, Reference Famiglietti1992a ).
In the present study, using quantitative morphometric analysis, I show that intracellularly stained examples of the recently characterized “transient” ON DS ganglion cell (ON DS-t), correspond to the previously identified, “orphan”, class IIb1 cell (Famiglietti, Reference Famiglietti2004a ), and observe that they share the morphological features of other “brisk” ganglion cells of rabbit retina, by comparison to intracellularly stained examples in other studies (Amthor et al., Reference Amthor, Takahashi and Oyster1989a ; Jensen, Reference Jensen1991; Mills et al., Reference Mills, Tian, Hoshi, Whitaker and Massey2014). This morphology is shown by previously developed quantitative methods to differ markedly from that exhibited by ON DS-s cells. The stratification of class IIb1/ON DS-t cells is reanalyzed and confirmed to differ from that of MTNP/ON DS-s ganglion cells. Particular attention is directed to the potential for input to class IIb1 (hereafter “IIb1”) cells from type b starburst amacrine (SAb) cells, which almost certainly innervate MTNP/class IVus1 (ON DS-s) ganglion cells (Famiglietti, Reference Famiglietti1992b , Reference Famiglietti2002; Dong et al., Reference Dong, Sun, Zhang, Chen and He2004; Sivyer et al., Reference Sivyer, van Wyk, Vaney and Taylor2010). In the discussion, unexpected OFF DS inputs to ON DS-t cells, revealed under pharmacological blockade of ON pathways and GABAA receptors, and dependent upon gap junctions with amacrine cells (Ackert et al., Reference Ackert, Farajian, Volgyi and Bloomfield2009), adumbrate an unusual, trans-sublaminar or columnar organization of synaptic input to IIb1 cells in the inner retina.
Materials and methods
The tissue preparation, Golgi impregnation, and analytical methods for studying retinal ganglion cell have been laid out in detail elsewhere (Famiglietti, Reference Famiglietti1992a ,Reference Famiglietti b ). The methods used conformed to institutional and NIH guidelines. A synopsis of these methods is presented below.
Golgi impregnation
Golgi-impregnated rabbit retinas were prepared according to a Golgi–Kopsch–Colonnier method described elsewhere (Famiglietti, Reference Famiglietti1985). Briefly, pigmented rabbits (Dutch-belted, New Zealand red or black, and indeterminate strains with brown or black iris) were surgically enucleated, painlessly, under deep halothane anesthesia, and were euthanized by halothane overdose, followed by thoracotomy and exsanguination. The retinas were isolated from the posterior half of the eye under dim light in buffer, and were flattened by making radial cuts from the periphery toward the center. They were then mounted in a sandwich of filter paper, which was held flat by a coverslip and rubber bands on a glass slide and were then fixed in aldehydes. The slide was immersed in an aldehyde-dichromate mixture, and then in 1% silver nitrate, for a few days each. Retinas were dehydrated and mounted whole on glass slides either in DPX or in sheets of Epon/Araldite.
Choline acetyltransferase immunocytochemistry
Eyes from anesthetized albino rabbits were surgically enucleated, and the rabbits euthanized as described above. Retinas were fixed by immersion in phosphate-buffered formaldehyde (pH 7.4), rinsed in phosphate buffered saline (PBS), and cryoprotected in 5% sucrose. Slide-mounted, transverse cryostat sections (6–12 µm) were rinsed in PBS and then incubated overnight in rabbit antisera produced against chick choline acetyltransferase (ChAT) (Johnson & Epstein, Reference Johnson and Epstein1986), diluted 1:1000, and containing 0.3% Triton X-100. Peroxidase-antiperoxidase (PAP) immunocytochemistry was used with diaminobenzidine as the chromogen, in a method described in more detail, elsewhere (Tumosa et al., Reference Tumosa, Stell, Johnson and Epstein1986). Control tissue was processed at the same time as the experimental tissue. Controls were performed by using serum preabsorbed overnight with monoclonal antibody to affinity-purified chicken ChAT (0.6 µg/ml in serum diluted 1:1000), or by omitting the primary antibody step, and incubating the tissue in secondary antibody and PAP. These control sections failed to show any specific staining. In addition, preabsorption of the antiserum with effluent from the affinity column used to purify a monoclonal ChAT antibody, to render it monospecific for ChAT, did not reduce the tissue staining.
Retinal location of ganglion cells
Details of the methods for determining the location of mid-visual streak in each Golgi-impregnated retina and for accurate mapping of the retinal location of each cell are given in a previous communication (Famiglietti, Reference Famiglietti1992a ). Most of the ganglion cells lay within 2 mm of mid-visual streak (DVS = 0.0). This distributional bias is a consequence of the concentration of ganglion cells in and near the visual streak, as well as of the Golgi–Kopsch–Colonnier impregnation method used here.
Measurement and analysis of cell body and dendritic field size
Camera lucida drawings of ganglion cells were made with a Zeiss drawing tube at magnifications ranging from 250× to 1,000×. Methods of determining cell body and dendritic field areas using best-fitting convex polygons are described elsewhere (Famiglietti, Reference Famiglietti1992a ). Areas were converted to “equivalent dendritic field diameters”, according to the equation d eq = 2√(A/π), where A = dendritic field area. Corrections were not made for tissue shrinkage in Golgi preparations due to fixation and dehydration, when the sizes of Golgi-impregnated cells were graphed. Shrinkage has been estimated in this material to range up to 30% in all dimensions (Famiglietti, Reference Famiglietti1985), and is typically 15–25%.
Graphic analysis
Cell body and dendritic field sizes were plotted as a function of distance from mid-visual streak (DVS). Curves were fitted to the distributions by the LOWESS (locally weighted statistical sampling) method (Cleveland, Reference Cleveland1979; Efron & Tibshirani, Reference Efron and Tibshirani1991) implemented in SYSTAT™. The F value (fraction of the total sample used to compute the curve locally) was adjusted to low values (F = 0.3 to 0.6) to reflect local variations, such as the sharp reduction of size in the visual streak.
Microscopic analysis of dendritic stratification
Analysis of dendritic stratification was performed for the most part in flattened, whole-mounted retinas, as described elsewhere in detail (Famiglietti, Reference Famiglietti1992b ), using high magnification, high numerical aperture oil-immersion lenses and an accurate, gear-driven (Zeiss WL) microscope stage elevator (Carl Zeiss, Oberkochen, West Germany). Dendritic stratification in the retina must be analyzed against a reference layer or layers. Depth of dendritic stratification in the Z-axis can be measured in 0.5 µm intervals, and the focal plane selected can be assumed to lie at the mid-level of dendritic processes ranging in thickness from 0.25 to 2.0 µm.
The most valuable material for the analysis of dendritic stratification, which can lead to a useful representation of stratification, substratification, and co-stratification of dendritic trees in the IPL of rabbit, is the whole, unsectioned, flat-mounted retina containing numerous instances of overlapping dendritic trees. In these instances, “marker” cells constitute fiducials against which other less well-known cells can be studied. Consistency of relationships in level of stratification can thus be represented against a standard (cf. Fig. 13). The most useful marker cells in the IPL of the rabbit for this study are SAb cells (Famiglietti, Reference Famiglietti1983), the class IV, type 1, bistratified (IVbs1/BS1) or ON–OFF DS ganglion cell (Famiglietti, Reference Famiglietti1981a , Reference Famiglietti1992a , Reference Famiglietti2009), class I and class II cells (Famiglietti, Reference Famiglietti2004b ) and the class IV, type 1 small tufted (IVst1/ST1) (local edge detector) (Famiglietti, Reference Famiglietti2005b ).
Camera lucida drawings, digital photography, and reproduction
Camera lucida drawing were traced using a Zeiss RA microscope (Carl Zeiss, Oberkochen, West Germany) fitted with a Zeiss drawing tube and one of the following microscope objective lenses: a Zeiss Plan Neofluar 25×, numerical aperture (NA) = 0.65, a 40× Zeiss PlanApo, a 50× Wild PlanFluotar (Wild-Heerbrugg, Switzerland), or a Zeiss Neofluar 100×, all long working distance, oil immersion objectives, and all NA = 1.0. Drawings were digitized at 600 dpi on a flat-bed scanner and imported into Adobe Photoshop 6, where contrast and brightness were adjusted, and layered images at various gray levels illustrating levels of stratification were constructed. Photographs were taken through one of the objective lenses described above in RAW format with a Canon G5 or G6 digital microscope camera, converted to TIFF files in Canon Zoombrowser software, and assembled and processed in Adobe Photoshop 6.0.
Computer-assisted logging and reproduction of dendritic trees in 3D
Slides of whole-mounted Golgi-impregnated retinas containing retinal ganglion cells of interest were mounted on the motorized stage of a Zeiss WL microscope with motorized Z-axis focus control, both computer-controlled, and the dendritic trees were logged in three dimensions, when viewed with a Zeiss Neofluar 100× oil immersion objective, NA 1.0, working distance (WD) = 600 microns, as described previously (Famiglietti, Reference Famiglietti1983, Reference Famiglietti1985).
In a second case, the IIb1 ganglion cell of interest was photographed, as described in the previous section above, on a Zeiss WL microscope with a flat-field Leitz NPL Fluotar 100× oil immersion objective lens, NA 1.32, WD = 220 microns (Leitz, Wetzlar, Germany), in a two-panel montage in a series of optical sections, effected manually, in 32 half-micron steps. A registered series of optical sections was created in Adobe Photoshop, and the series rendered in a stack using ImageJ (NIH Image) software. The stack was imported into a Neurolucida system (MBF Bioscience, Inc.), and dendrites were traced in three dimensions through the stack with concurrent logging of dendritic diameter. Resulting images of the reconstructed dendrites were rotated in Neurolucida to the desired perspective and saved as TIFF image files, further processed in Adobe Photoshop.
Quantitative analysis of dendritic trees
The “dendritic density” (D) for each cell studied was determined from the total dendritic length (L) and the dendritic field area (A), according the equation: D = L/A. For analysis of more characteristic dendritic branching patterns, “branch length distributions (BLDs)” were obtained and compared (cf. Famiglietti, Reference Famiglietti1992a ).
Branching data for class II cells and for class IVus1 (ON DS, also formerly called MTNP or MTN-projecting cells), in the form of BLDs, were the same as those analyzed and published previously (Famiglietti, Reference Famiglietti1992a , Reference Famiglietti2004b ). In most of these cases, computer logging of dendritic trees was performed on a computer-driven microscope system described elsewhere (Famiglietti, Reference Famiglietti1985). The values of terminal and preterminal branch length and “distance from soma” were calculated from the logged structure of the dendritic tree, and were exported into computer graphics and plotting systems. Shortest distances along the dendritic tree from the soma to the origins of each preterminal and terminal branch were extracted using the lengths of each preterminal branch and the stored branching topology. For “transient” ON DS cells, scaled camera lucida drawings were digitized, and each dendritic branch traced and measured in two dimensions, using (NIH) ImageJ software (Schneider et al., Reference Schneider, Rasband and Eliceiri2012). Distances from the soma of each dendritic branch origin were calculated by summing on-path, preterminal branch lengths. These distances along with the length of each preterminal and terminal branch were transferred to a file in the statistical and graphing program, SYSTAT™, and terminal-branch-length was plotted against distance from the soma. Straight lines were fitted to the distributions of preterminal and terminal branch lengths separately by the method of least squares. The slopes of these fitted lines are designated M p and M t, respectively. Because the set of preterminal branches originates at the soma, the straight lines fitted to their distributions meet the ordinates of each graph at zero, while those fitted to the terminal-branch-lengths do not, unless a primary dendrite does not branch. In addition, Gaussian bivariate ellipsoids (GBEs) were fitted to the data plotted. Only the ellipsoids fitted to terminal BLDs are illustrated in Fig. 2. The ellipsoids are centered upon the sample means of x and y variables. The lengths of their major and minor axes are determined by the unbiased standard deviations of x and y, and their orientation is determined by the sample covariance between x and y. The size of an ellipse is determined by a probability value between 0 and 1. This value has been set at 0.5 in Fig. 4. If the data were bivariate normal, then 50% of the data points would lie inside the ellipse. The principal justifications for plotting GBEs in these graphs of untransformed data are to mark the sample means, and to show, by the ellipsoid's axial deviation from the linear regression plot, the presence of marked heterogeneity in the sample covariance, an indicator of significant heterogeneity among the terminal branches.
Results
Morphology of dendritic branching
Class II cells and class IVus1 cells are illustrated in Fig. 1. By inspection, it is evident that they have very different branching patterns, previously documented by quantitative methods (Famiglietti, Reference Famiglietti1992a ). In the case of class II cells (Fig. 1A–1D), terminal dendritic branches are progressively shorter, the farther their origins are from the cell body, whereas class IVus1 cells (Fig. 1E and 1F) have short dendritic branches throughout their dendritic trees. Examples of intracellularly-stained, “transient” ON DS ganglion cells (Fig. 1G and 1H) more closely resemble class II than class IVus1 cells.
Camera lucida drawings (A–F), and tracings from a drawing (G) and a photomicrograph (H), respectively, published by others, of ganglion cells from whole-mount rabbit retinas. Ganglion cells in (A–D) belong to class II, and are of three types, which share relatively large size and simple dichotomous dendritic branching, but differ in level of dendritic stratification, and dendritic branching frequency. Ganglion cells in (E) and (F) belong to class IV, i.e. unpaired, lacking a paramorphic partner in the other sublamina (in this case sublamina a); they are further characterized as type 1, unistratified (IVus1). These have short terminal branches throughout the dendritic tree: a dendritic branching pattern characteristic of previously described ON directionally selective ganglion cells. Similar cells were shown to project to the MTN of the AOS, and in recent work were characterized by long latency or sluggish responses (ON DS-s). Ganglion cells in (G) and (H) are traced from Fig. 1 and 2 of Akert et al. (Reference Ackert, Farajian, Volgyi and Bloomfield2009) and Hoshi et al. (Reference Hoshi, Tian, Massey and Mills2011), respectively. In comparison to ON DS-s cells, these have relatively “transient” responses (ON DS-t). The close resemblance of class IIb1 cells and ON DS-t cells is evident. Examples are taken at various distances from the visual streak (DVS) to show that characteristic morphological features are relatively independent of retinal location.

Quantitative analysis of size and dendritic branching
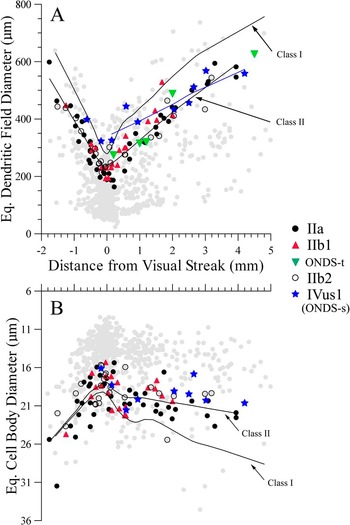
Quantitative analysis of cell body size (Fig. 2B) shows that clear distinctions cannot be made among the three class II cell types, class IVus1 cells, and ON DS-t cells. There is a noticeable tendency however, for both IIb1 and IVus1 cells to have slightly smaller cell bodies than IIa and IIb2 ganglion cells. The cell bodies of ON DS-t ganglion cells were penetrated to allow intracellular staining, with indeterminate amounts of tracer leakage around them. Consequently, no attempt was made to measure the size of their cell bodies. Based upon the best estimate of their retinal location; however, the dendritic field diameters of ON DS-t cells were comparable to those of IIb1 cells, which in turn were slightly larger on average than the paired, paramorphic IIa and IIb2 cells (Fig. 2A). At least in central retina, class II and ON DS-t cells are smaller than ON DS-s cells (Fig. 2A). The latter are nearly as large as class I cells, which are represented in Fig. 2 by a LOWESS curve fitted to the four types of class I cells, taken as a whole.
Graphs of ganglion cell body and dendritic field diameter, as they vary with distance from mid-visual streak. Examples of the five types of ganglion cell in Fig. 1 are plotted, together with more than 600 other ganglion cells of all types (gray) to show that, collectively, the five types are among the largest rabbit retinal ganglion cells. LOWESS curves are fitted to data from class II cells (all three types), class I cells (all four types; data points in gray only), and IVus1 cells. In comparison to class II cells, class IVus1 (ON DS-s) cells are larger in dendritic field size, centrally, but slightly smaller in cell body size. In comparison to class I cells, class IVus1 cells are similar in dendritic field size, but significantly smaller in cell body size. Class IIb1 cells and class IVus1 cells, the two types of ON DS cells, have about the same cell body size.

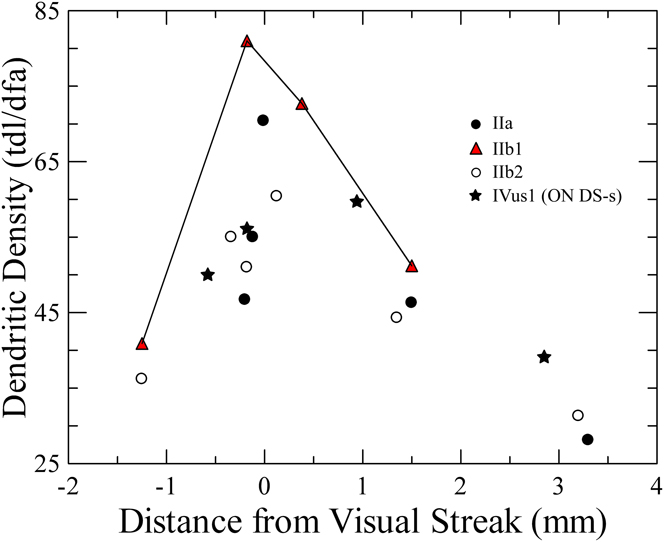
Close inspection of the branching of IIb1 compared to that of IIb2 cells shows that the density of their branching is greater at comparable distances from the visual streak (cf. Fig. 1B and 1C). This difference in density, defined as total dendritic length divided by dendritic field area, is shown quantitatively in Fig. 3 (continuous line connecting triangles).
Graph of variation in dendritic field density of ganglion cells with distance from mid-visual streak. Dendritic density is defined as total dendritic length (tdl), divided by dendritic field area (dfa). As expected, density is highest for the smallest cells in mid-visual streak. Class IIb1 cells exhibit the highest density of dendritic branches of all class II cells in central retina, and densities comparable to or greater than class IVus1 cells.

Methods previously developed in our laboratory to analyze dendritic branching patterns of retinal ganglion cells (Famiglietti, Reference Famiglietti1992a ) were employed to show the similarities among all three types of class II cell (Fig. 4A–4D), regardless of their retinal location, and the conspicuous difference between class II and IVus1 cells (Fig. 4E and 4F). Two examples of ON-DS-t cells (Fig. 4G and 4H) exhibit similarity to class II cells and not to IVus1 cells. Key parameters derived from the BLDs, illustrated in Fig. 4, are the slopes of lines fitted by the method of least squares, separately, to the distributions of preterminal (open circles) and terminal (closed circles) dendritic branch lengths. These slopes, M p and M t, respectively, can be used to illustrate quantitative similarities and differences among the ganglion cells under study.
Graphs of ganglion cell dendritic branch length distributions (BLDs), characterizing dendritic branching patterns. All class II cells have preterminal BLDs clustered near the cell body (distance from soma = 0), reflected in a left-shifted Gaussian bivariate ellipsoid (GBE). Linear least squares fit to the distributions give different values for the slopes of the lines fitted to the preterminal (M p) and terminal (M t) distributions. In the case of class II cells, M p is near zero, and M t is negative. In contrast, the preterminal distributions and GBEs of class IVus1 cells are right-shifted, and their linear fits exhibit values of M p and M t near zero or slightly positive. Moreover, there is more consistent alignment between M t and the major axis of the corresponding GBE, indicating greater uniformity in the length and distribution of terminal dendritic branches throughout the dendritic tree in the case of class IVus1 cells. The two ON DS-t cells, (G) and (H) here and in Fig. 1, have BLDs resembling class II cells, rather than class IVus1 cells.

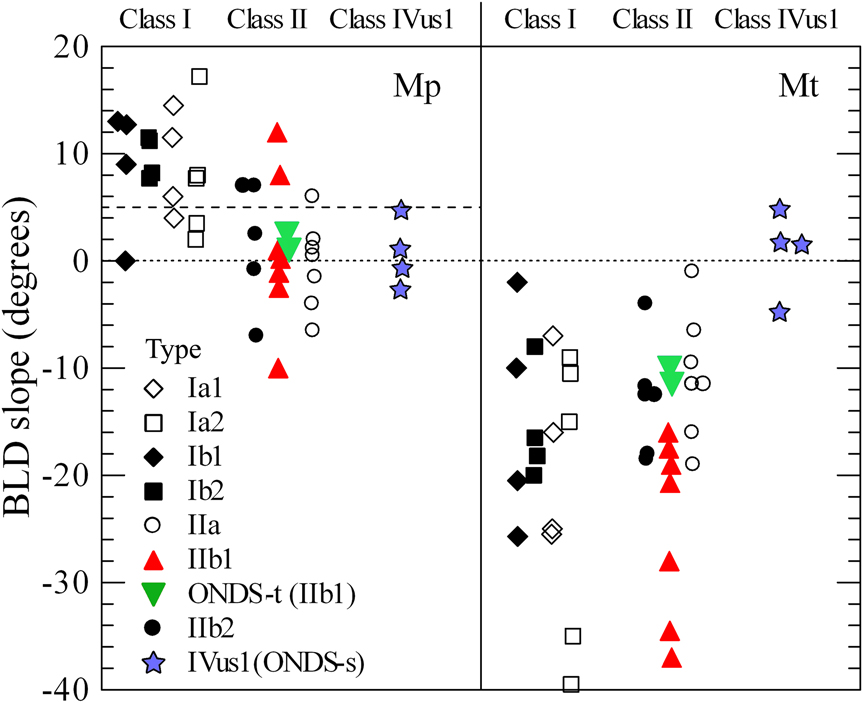
In Fig. 5, the BLD slopes, M p and M t, are graphed separately for each of the seven types of class I and class II cells, as well as for class IVus1 cells and two examples of ON DS-t cells. Class IVus1 cells have similar values of M p and M t that clusters around a slope of zero. Both class I and class II cells share significantly negative values of M t, attributable to longer terminal dendrites originating proximal to the cell body. Class I and class II cells differ, however, in values of M p. Most class I cells have values of M p larger than +5, whereas most class II cells have values of M p less than +5. The distributions of values of M p are very similar for paramorphic IIa and IIb2 cells, but IIb1 cells exhibit a broader range. Physiologically identified, ON DS-t cells (inverted triangles in Fig. 5) clearly fall within the ranges of M p and M t exhibited by class II cells.
Graphs of the slopes M p and M t of lines fitted to the preterminal and terminal BLDs of class I, II, IVus1, and ON DS-t ganglion cells. Class I and class II cells both have relatively large negative values of M t, but M p provides an aid in distinguishing between the two classes, particularly in the visual streak, where their sizes are similar (cf. Fig. 2). M p is greater than +5 for most class I cells and less than +5 for most class II cells, a difference that underlies distinction previously drawn between “radiate” and “tufted” branching patterns, respectively (Famiglietti, Reference Famiglietti1992a , Reference Famiglietti2004b ). Values of M p and M t for class IIb1 cells and ON DS-t cells conform to ranges exhibited by class II cells. In contrast, class IVus1 cells have similar values of M p and M t.

Quantitative analysis of dendritic stratification
From a functional standpoint, the most important aspect of the present morphological study is the analysis of dendritic stratification. The dendritic stratification of the three types of class II cell was previously analyzed (Famiglietti, Reference Famiglietti2004a ) and it was observed, as noted in the Introduction, that class IIb2 cells co-stratify with wide-field blue bipolar cells in the outer third of stratum (S) 5 (S5α) (Famiglietti, Reference Famiglietti2008). Class IIb1 cells exhibited more variability, and were usually found to stratify principally at the S3/S4 border, just above the branching of SAb cells (Famiglietti, Reference Famiglietti2004a ). Some cells were found to send a few branches to the inner third of S4, S4γ.
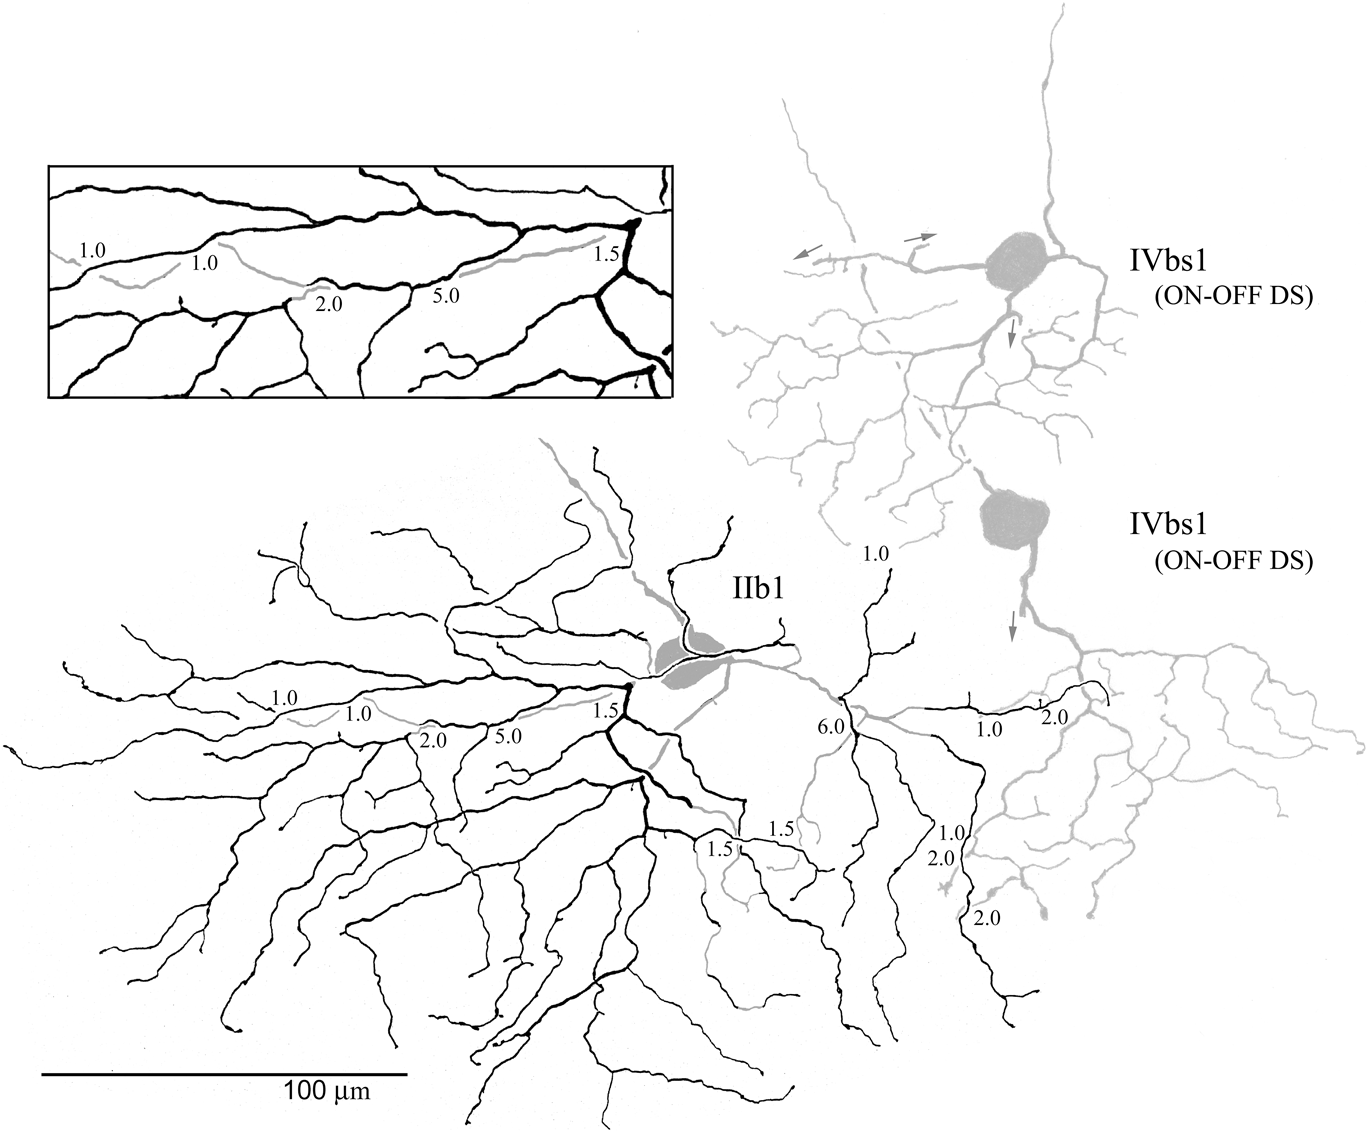
In the present study, the dendritic stratification of several IIb1 cells was studied in detail over the entire dendritic field area of each example. Three are illustrated here. One, located 1.5 mm ventral to mid-visual streak, was logged in three dimensions in a microscope-based computer system (Fig. 6A), rotated for study (not shown), and analyzed in optical sections (Fig. 6B). Two others, located near the middle of the visual streak, exhibited partial dendritic field overlap with fiducial cells critical to a functional perspective: (1) a class IVbs1 (ON–OFF DS) ganglion cell (Fig. 7), and (2) a SAb cell (Figs. 8–11).
Digital computer plot (A) and photomicrograph (B) of a class IIb1 ganglion cell (of Fig. 1d) from more peripheral retina (DVS = +1.5). The boxed area in (A) is displayed in (B), which represents an optical slice at the main level of branching. Most of the dendritic tree lies in a single plane, and typically dendrites are in contact at crossings (α), but may be separated by up to 2 µm (β), the width of the main substratum of class IIb1 cell dendritic branching. The dendrite nearer to the GCL could be in contact with the dendritic boutons of starburst amacrine cells. Some dendritic segments lie well outside the main substratum; however (arrows), as far as 4.5 µm nearer to the GCL (+) in stratum 5, and as far as 3.0 µm nearer to the INL (−), approaching the a/b sublaminar border in stratum 3. Asterisk indicates termination of the dendritic branch in outer stratum 3. Numbers = distance in microns out of the photographic plane.

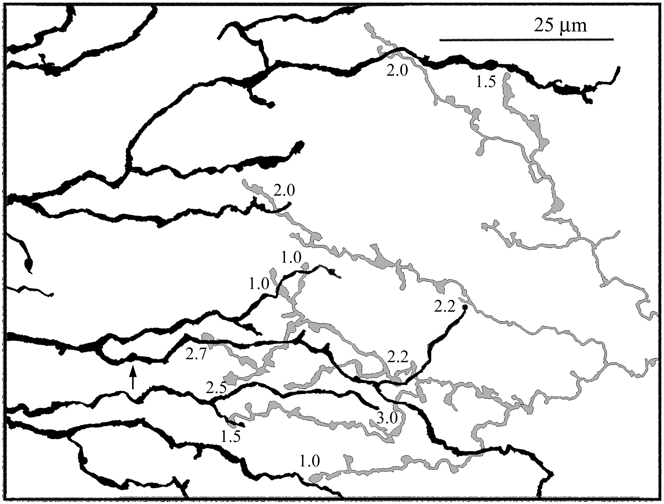
Camera lucida drawing of a class IIb1 and neighboring class IVbs1 (ON–OFF DS) ganglion cells at mid-visual streak. The sublamina b branching of the latter is shown (arrows indicate branches directed to sublamina a), and constitutes a fiducial for SAb cell branching. Most of the dendrites of the class IIb1 cell lie in S3, near the border between strata 3 and 4 of the IPL (filled in black). A few dendrites lie in a plane nearer to the GCL in stratum 4 (filled in gray). Numbers placed among the dendrites indicate distance in microns between crossing dendrites at two different levels. The inset shows an area of interest at greater magnification. There is little dendritic overlap between class IIb1 and class IVbs1. Where they do overlap, they are very close, but do not come into contact. Comparable distances between class IIb1 and class IVbs1 dendrites, and between the two (or more) levels of class IIb1 branching suggests; however, that, a some dendrites of the latter course within range of starburst amacrine cell boutons.

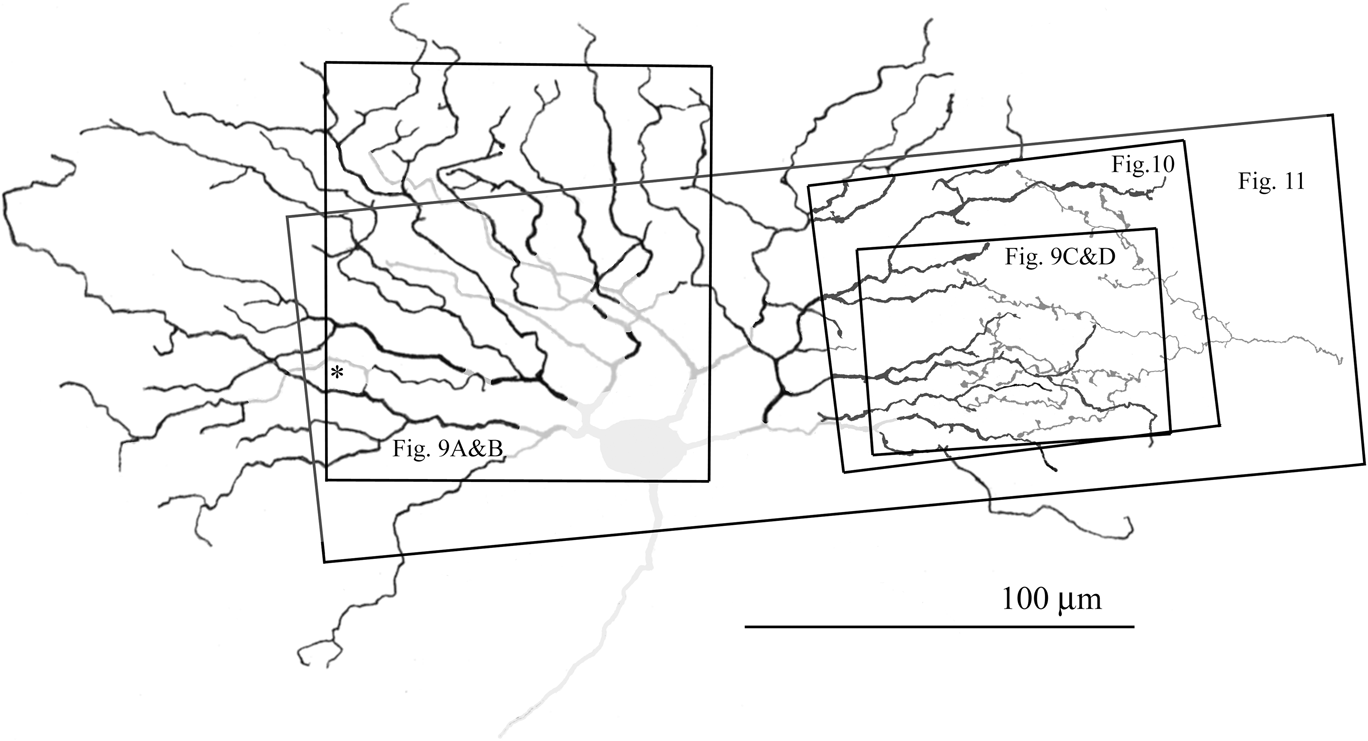
Camera lucida drawing (A) and photomicrographs (B and C) of a class IIb1 ganglion cell in the visual streak (cell of Fig. 1C) that partly overlaps a SAb cell (Fig. 8). Boxed areas were photographed (Fig. 9A and 9B, Fig. 9C and 9D), drawn in detail (Fig. 10), and logged in 3D with rotated views (Fig. 11). Similar to the class IIb1 cell of Fig. 7, this example has several dendritic branches that course 1.0–2.5 µm nearer the GCL (medium gray) than the main branching (black), which is in S3 near the S3/S4 border.

Photomicrographs of the class IIb1 cell of Figs. 1C and 8. The two optical sections illustrating the cell body and proximal dendritic field in (A) and (B) differ by about 1.5 µm in the Z-axis. Arrows in (A) and (B) indicate dendrites at different focal planes in the two optical sections. (C) and (D) show the region of dendritic field overlap between the class IIb1 ganglion cell of Fig. 8, and the distal dendritic zone of a SAb cell. The two optical sections in (C) and (D) differ by about 2 µm in the Z-axis. (C) Optical section in substratum S3γ at the main level of branching of the class IIb1 cell, the dendrites of which are indicated by arrowheads. The white asterisk in (C) and (D) marks the axon terminal of a type nb2 cone bipolar cell (Famiglietti, Reference Famiglietti1981b , Reference Famiglietti2002). The arrow in (C) and (D) points to a 5 µm segment of a class IIb1 cell dendrite that appears to reach the starburst substratum. (D) Optical section in S4β at the level of branching of the overlapping SAb cell, the distal, bouton-bearing dendrites indicated by arrowheads. Except for the short segment marked by the arrow, the dendrites of the ganglion cell are out of focus.

Detailed camera lucida drawing of the class IIb1 cell of Fig. 8, in the region of overlap with SAb cell dendrites. In the area of overlap with the starburst amacrine cell, none of the class IIb1 cell dendrites come into contact with starburst boutons. The distances between them are 1.0–3.0 µm, and average about 2 µm. Note that these distances are comparable to those internal to the class IIb1 cell dendritic tree (Fig. 8) that range from 1.0–2.5 µm, and average about 1.7 µm. Therefore some portions of the class IIb1 cell dendrites drawn in gray in Fig. 8 lie within range of type b starburst synaptic boutons (see Fig. 11).

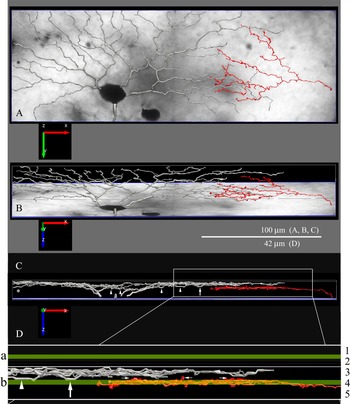
Class IIb1 ganglion cell of Fig. 8. This cell was reconstructed in three dimensions from a stack of 32 optical sections, taken at 0.5 µm intervals, with concurrent logging of dendritic diameter using Neurolucida software. (A) Flat view, as logged, with section #1 underlying the reconstruction of the ganglion cell dendrites (silver) and a branch of a SAb cell (red). (B). Reconstruction rotated by 72°. (C) Reconstruction rotated by 89.5° for optimal occlusion of starburst branches. (D) Magnification of area in C. with superposition of ChAT bands. Asterisk corresponds to similarly marked dendrite in Fig. 8. Arrowheads mark IIb1 ganglion cell dendrites descending to overlap ChAT band in sublamina b. Vertical arrows indicate loop similarly marked in Fig. 9c and d. Horizontal arrows indicate starburst boutons in laminar position to contact IIb1 dendrites (see text for further details.)

The first example is located ventrally in a well-flattened retina that lies parallel to the optical plane of the tissue slide. A single optical section, focused on the main level of branching brings most of the dendrites into sharp focus (Fig. 6B). Several overlapping amacrine and ganglion cells aid in determining the inner and outer borders of the IPL. The primary and initial portions of secondary dendrites rise to the main level of branching within 40 µm of the cell body (shaded ellipse, Fig. 6B). In some instances of dendritic crossing, dendrites are touching (α, Fig. 6B), but as often occurs in class IIb1 cells, at other locations crossing dendrites are not in contact (β, Fig. 6B). At several locations in the dendritic tree, segments of dendritic branches are out of the plane of focus. Several of these segments, indicated by arrows, some as long as 60 µm, deviate from the main level of branching, and the maximum distances from the main level are given numerically in microns, positive numbers signifying distances toward the ganglion cell layer (GCL) and negative numbers deflections toward the inner nuclear layer (INL). At this location, 1.5 mm from mid-visual streak, the IPL measures 19 µm in thickness. Note that the maximum extent of dendritic branching perpendicular to the retinal layers is 7.5 µm, about 40% of the thickness of the IPL that constitutes spread across the entirety of two strata: S3 and S4.
A second example of an IIb1 ganglion cell on which detailed analysis of dendritic stratification was performed lies at mid-visual streak next to two IVbs1 (BS1) ganglion cells, one of which overlaps its dendritic tree (Fig. 7). The differences between the branching patterns of these two ganglion cell types have been studied in detail (Famiglietti, Reference Famiglietti1992a , Reference Famiglietti2004b ). One salient point of difference is that the dendritic branches of individual BS1 cells almost never cross, and lie in a single plane. In contrast, the branches of the class IIb1 cell may cross many times. Moreover, unlike BS1 cells, the latter is not narrowly stratified, and its dendrites do not lie in a single plane. As noted for the first example above, at some dendritic crossings, the two dendrites of the IIb1 cell are in contact, but at other crossings there is a variable distance between them. These distances in microns are indicated by decimal numbers in Fig. 7. Most of the dendrites of this IIb1 cell branch in the inner half of S3 (black dendrites), while a few lie nearer to the GCL in S4 (gray dendrites). Note that, in the extreme, the distances between dendrites perpendicular to the retinal plane are comparable to those of the example in Fig. 6. In the limited region of dendritic field overlap, the dendrites of the fiducial BS1 cell lie nearer the GCL. While there are no points of contact with the class IIb1 cell dendrites in the region of overlap, the dendrites of the IIb1 cell come within 1 µm of the BS1 cell dendrites. Consequently, some of the IIb1 cell dendrites could be in range of the synaptic boutons of SAb cells.
A third example of a IIb1 ganglion cell found 180 microns dorsal to mid-visual streak (Figs. 8–11 and 1C) overlaps the dendritic field of a SAb cell (Fig. 8). The dendrites depicted in black (Fig. 8) lie in the inner half of S3, where most of the peripheral dendrites branch. There are exceptions; however, as is the branch marked with an asterisk. The latter, similarly marked, can be viewed optimally in Fig. 11. Like the two previous examples in Figs. 6 and 7, this IIb1 ganglion cell has dendritic branches in the middle of the dendritic field that lie 1.0–2.5 µm nearer to the GCL in S4 (medium-gray, Fig. 8). This difference in levels of stratification can be appreciated in two optical sections (arrows, Fig. 9A and 9B). In its dendritic field periphery, this IIb1 cell’s dendrites overlap the synaptic boutons in the distal dendritic zone of an SAb cell. In an optical section at the level of S3γ (inner third of S3), most of the ganglion cell dendrites are in focus (arrowheads, Fig. 9C), and the SAb dendrites are out of focus. An optical section through S4β (middle third of S4) shows most of the SAb dendrites in focus (arrowheads, Fig. 9D), and most of the ganglion cell dendrites out of focus. One exception is a 7 µm loop of a ganglion cell dendritic branch that appears to lie in the same plane as the nearby SAb dendrites (arrows, Fig. 9C and 9D). This loop is similarly marked in Fig. 10, and is seen to best advantage in Fig. 11D.
A detailed camera lucida drawing (Fig. 10) illustrates the region of dendritic field overlap between the IIb1 cell and the SAb cell of Fig. 8. At twelve points of intersection between the two, crossing in planes parallel to the retinal layers, the distance between them varies from 1 to 3 µm. At no point of intersection does contact occur that might mediate a synaptic connection. The mean distance between the two cells at those twelve points is 2.0 ± 0.65 µm.
In order to better appreciate the relative dendritic stratification of class IIb1 and starburst amacrine cells, the IIb1 cell of Figs. 1C and 8–10, and the overlapping SAb branch were logged in three dimensions from a stack of optical sections, using Neurolucida (MBF, Inc.) software, and rotated for optimal viewing of dendritic stratification (Fig. 11). In comparing the images of Figs. 1C and 8–11, note that in the latter images the orientation is reversed dorsoventrally (e.g., Fig. 11A and 11B) to accommodate a conventional side view with photoreceptors oriented up, despite the fact that the GCL side of the retina is up on the tissue slide. For greater verisimilitude in the reconstruction, dendritic thickness was logged together with the 3D location of points along the dendrites. Despite excellent flatness of the retinal preparation containing this example, the Y-dimension of the reconstructed area was limited to 90 µm, so that rotation about the X-axis would result in minimal deviations from laminar flatness in the Z-axis display of stratification. Optimal rotation for viewing was guided by the optimal occlusion (minimal spread in the Z-axis) of the SAb dendrites. This was achieved by a 3D rotation of 89.5° around the X-axis (Fig. 11C and 11D).
In order to relate the individual SAb dendrites to the starburst substratum formed by the entire array of SAb cells in the vicinity of the IIb1 cell, immunocytochemically labeled ChAT-immunoreactive material studied previously (Famiglietti & Tumosa, Reference Famiglietti and Tumosa1987) was reexamined and the widths of the two starburst substrata re-measured on camera lucida drawings of the bands, magnified 1,600×. Maximum width of the starburst substratum in sublamina b was determined by averaging 15 measurements over a linear extent of 180 µm, taken at intervals ranging from 5 to 15 µm. In sublamina a, nine measurements taken over a 90 µm extent were averaged. The maximum widths calculated in this manner were 1.4 ± 0.13 µm for sublamina a and 1.8 ± 0.5 for sublamina b, although the greatest thickness of the substratum in sublamina b among individual measurements was 2.5 µm. These data were combined with the 3D reconstruction illustrated in Fig. 11 by superimposing bands of 1.4 and 1.8 µm, for sublamina a and b, respectively, in the rotated and magnified image of Fig. 11D. The scale and positioning of the laminar and sublaminar boundaries were informed by the fact that the IPL measured 19 µm at this location, and by the convention of five equally thick strata. The “ChAT-band” in sublamina a was positioned over the S1/S2 border, and the ChAT band in sublamina b was positioned for maximal occlusion of the SAb distal dendritic zone of branches and boutons (green bands, Fig. 11D). This positioning results in a mid-band location in sublamina b of 68.5% of the IPL’s depth. This value is in accord with the value of 69%, determined previously (Famiglietti & Tumosa, Reference Famiglietti and Tumosa1987). The great majority of SAb branches are coincident with the ChAT band (yellow color of superimposed red dendrites and green band), although a few boutons rise above (small arrows, Fig. 11D), and also descend below the band. In view of an overlap factor for SAb cells at this central location of about 30× (Tauchi & Masland, Reference Tauchi and Masland1984; Famiglietti, Reference Famiglietti1985), note that the three boutons marked above the ChAT band stand in for a total of 90 such boutons in this small area, and about 1500 boutons over the whole field of the IIb1 cell’s dendritic tree.
The branching of the IIb1 cells dendrites is compact along the Z-axis at the optimum rotation for the SAb dendrites. The main level of branching measures 2.1–2.5 µm wide, and the center-to-center distance between the middle of the Z-axis spread of the main level of IIb1 branching and the middle of the ChAT band is 3.2–3.5 µm. Nevertheless, several dendritic segments of the IIb1 cell dendrites overlap the ChAT band (arrows and arrowheads, Fig. 11C and 11D). The arrows in Fig. 11C and 11D point to the loop observed in optical sections (arrows, Fig. 9C and 9D). The asterisks in Fig. 11A and 11C, corresponding to the same symbol in Fig. 8, marks a dendrites that descends to the mid-level of the ChAT band. The forgoing analysis suggests that there is ample opportunity for synaptic contact between SAb cells and class IIb1 ganglion cells.
Amacrine cells reportedly dye-coupled to transient ON DS ganglion cells
Ackert et al. (Reference Ackert, Farajian, Volgyi and Bloomfield2009) and Hoshi et al. (Reference Hoshi, Tian, Massey and Mills2011) illustrate intracellularly stained amacrine cells that are dye-coupled to ON DS-t ganglion cells. These include cells with long axon-like processes (Ackert et al., Reference Ackert, Farajian, Volgyi and Bloomfield2009; Hoshi et al., Reference Hoshi, Tian, Massey and Mills2011), and a medium-wide field “multistratified” amacrine cell with an irregular distribution of beaded processes that appear to be somewhat concentrated in three strata, roughly correlated with S1, S2, and S3, extending from outer S1 to outer S4 (Hoshi et al., Reference Hoshi, Tian, Massey and Mills2011). It appears that Ackert et al. (Reference Ackert, Farajian, Volgyi and Bloomfield2009) and Hoshi et al. (Reference Hoshi, Tian, Massey and Mills2011) have identified two different coupled axon-bearing amacrine cells. In the former case, a cell is depicted with a small dendritic tree of branching, wavy dendrites, and multiple, unbranched axons emerging from proximal branches of the dendritic tree (Ackert et al., Reference Ackert, Farajian, Volgyi and Bloomfield2009). Such amacrine cells have not been observed in our preparations, but resemble “type IV” polyaxonal amacrine cells, as described by Volgyi et al. (Reference Volgyi, Xin, Amarillo and Bloomfield2001). In previous work (Famiglietti, Reference Famiglietti1990), I distinguished among three classed of very-wide-field amacrine cells: (1) polyaxonal amacrine cells with discrete dendritic and axonal trees, axons that emerged proximally in the dendritic field and that branched at right angles near the cell body (Famiglietti, Reference Famiglietti1992c ,Reference Famiglietti d ,Reference Famiglietti e ), like the axons of the brain's Golgi type II cells, (2) unistratified amacrine cells with very long and very straight dendrite-like processes, called long-range amacrine cells by Vaney (Reference Vaney, Osborne and Chader1990), and (3) HLPα amacrine cells, a very heterogeneous class of perhaps thirteen types, based upon morphology and stratification, a group constituted of cells with heterogeneous (H), long (L), processes (P) that included cells with indistinct dendritic trees and unbranched axons that emerge typically from the ends of thicker dendrite-like processes. The very wide-field amacrine cells stained by Hoshi et al. (Reference Hoshi, Tian, Massey and Mills2011) appear to be of this kind. An example with appropriate stratification, extending broadly between S2α and S4α, is illustrated in the camera lucida drawings of Fig. 12A and 12B. The proximal tree bears numerous complex dendritic appendages (Fig. 12B) and the more distal axons exhibit beaded swellings and cupped appendages with the appearance of synaptic boutons.
Amacrine cells representing types coupled to ON DS-t ganglion cells. (A and B) Axon-bearing, very-wide-field, HLPαII amacrine cells. Dendrite-like processes in black. Axon-like processes (red) emerge in a fairly distinct transition from dendrites. (B) Detail of cell in (A). Dendrites bear numerous and varied, complex appendages. The axonal portion is slightly thinner and consists of a linear string of boutons. (C) Multistratified amacrine cell of Hoshi et al. (Reference Hoshi, Tian, Massey and Mills2011). This is a multiplied image of seven optical sections generated in Photoshop. (D) Sublamina b starburst substratum, marked by the axon terminal of an nb1 cone bipolar cell. (E) Characteristic dendritic branchiing of the nb1 cone bipolar cell. Calibration bar in (C) applies to (C), (D), and (E).

The second type of dye-coupled amacrine cell, stained by Hoshi et al. (Reference Hoshi, Tian, Massey and Mills2011) is illustrated in Fig. 12C and 12D. It bears numerous beaded processes of irregular lengths (Fig. 12C), extending horizontally at several levels in the IPL, from outer S1 to outer S4, with a small number of terminal processes distributed closer to the cell body in S4β, marked by the axon terminal of an nb1 cone bipolar cell (Fig. 12D and 12E) that co-stratifies with the starburst substratum in sublamina b. It is this “multistratified”, medium-wide-field amacrine cell that most likely conveys the paradoxical, reversed OFF DS response of ON DS-t ganglion cells under pharmacological GABAA receptor blockade by picrotoxin, modeled in the diagram of Fig. 14, below.
Discussion
Morphological identity of transient ON DS ganglion cells and a speculation about their origin
In the present study, it is established by the morphological criteria of dendritic field size, dendritic branching pattern, and level of dendritic stratification, that the recently identified “transient” ON DS (ON DS-t) ganglion cells of rabbit retina are identical in morphology to a previously described “orphan” class II ganglion cell (Famiglietti, Reference Famiglietti2004a ), which is judged to be a member of a family of brisk-concentric ganglion cells (cf. Amthor et al., Reference Amthor, Takahashi and Oyster1989a ; Jensen, Reference Jensen1991, Fig. 6). Prior to studies characterizing the ON DS-t cell (Ackert et al., Reference Ackert, Wu, Lee, Abrams, Hu, Perlman and Bloomfield2006, Reference Ackert, Farajian, Volgyi and Bloomfield2009; Kanjhan & Sivyer, Reference Kanjhan and Sivyer2010; Hoshi et al., Reference Hoshi, Tian, Massey and Mills2011), the only morphology associated with ON DS ganglion cells was that of ganglion cells projecting to the medial terminal nucleus (MTN) of the AOS (Buhl & Peichl, Reference Buhl and Peichl1986), mediating optokinetic visual responses (Simpson et al., Reference Simpson, Leonard and Soodak1988). In two studies combining physiological identification with intracellular staining (Amthor et al., Reference Amthor, Takahashi and Oyster1989b ; He & Masland, Reference He and Masland1998), ON DS-t cells were not encountered. This absence is surprising, in view of the cell body sizes of IIb1 and IVus1 cells which are the same and relatively large (Fig. 2B). The two types appear different in intravitally stained preparations in vitro (Hoshi et al., Reference Hoshi, Tian, Massey and Mills2011), and those with a crescentic nuclear appearance were targeted exclusively by Ackert et al. (Reference Ackert, Farajian, Volgyi and Bloomfield2009), yielding the morphology of class IIb1 cells. The many prior physiological studies of ON DS cells employing extracellular recording with tungsten electrodes (Barlow et al., Reference Barlow, Hill and Levick1964; Levick, Reference Levick1967; Oyster, Reference Oyster1968; Caldwell & Daw, Reference Caldwell and Daw1978; Ariel & Daw, Reference Ariel and Daw1982a ,Reference Ariel and Daw b ), likely recorded from both types. For instance, the response of an ON DS ganglion cell to a standing contrast stimulus of duration greater than 2 seconds in the pharmacological study of Ariel and Daw (Reference Ariel and Daw1982a , Fig. 9) clearly represents that of an ON DS-t cell, when compared to the responses obtained by Kanjhan and Sivyer (Reference Kanjhan and Sivyer2010).
The large-bodied class I and class II ganglion cells of rabbit retina have similar but distinguishable branching patterns (Famiglietti, Reference Famiglietti2004b ), clearly different from those of class IVus1 (ON DS-s) ganglion cells (Figs. 4 and 5; Famiglietti, Reference Famiglietti1992a ). Ganglion cells with the morphology of class I and class II cells have the physiological properties of “brisk” ganglion cells (Jensen, Reference Jensen1991), and are the “brisk” “Y” and “X” cells, respectively, studied by Caldwell and Daw (Reference Caldwell and Daw1978). Roska and Werblin (Reference Roska and Werblin2001) stained a ganglion cell with dendritic branching and stratification in the middle of the IPL similar to that of class Ib1 or class IIb1 cells, and classified it as “brisk transient nonlinear”, calling it “type 5”, but they did not test it for directional selectivity. ON DS-t (IIb1) cells produce short latency responses to a standing contrast stimulus, in comparison to the “sluggish” responses of ON DS-s cells: 75 ms versus 350 ms on average (Hoshi et al., Reference Hoshi, Tian, Massey and Mills2011). This short latency is a significant, probably intrinsic, distinguishing functional property of ON DS-t cells, shared with “brisk” (X and Y) ganglion cells, in addition to the relative transience of their responses. The preferred velocities of both ON DS types are similar (Hoshi et al., Reference Hoshi, Tian, Massey and Mills2011), however, as might be expected from prior studies employing extracellular recording. This similarity likely reflects similar input (see below).
The similarities in morphology and physiology between ON DS-t/IIb1 cells and other class II and class I cells suggests an affinity that points to common evolutionary and developmental origins, in a lineage different from ON DS-s cells. It has been proposed that the “trigger feature” of directional selectivity in retinal ganglion cells be regarded as a property, rather than a defining characteristic of a ganglion cell “type” (Rowe & Stone, Reference Rowe and Stone1977; Rodieck & Brening, Reference Rodieck and Brening1983). From that point of view, class IIb1 cells might be regarded as co-opted by the AOS in need of a shorter latency response than afforded by ON DS-s cells. Thus directional selectivity would be an adventitious rather than a fundamental property of ON DS-t cells. Salient in this regard is the description by Caldwell and Daw (Reference Caldwell and Daw1978) of their “hybrid units”, as “like ‘on’ directionally sensitive units without the directional sensitivity”. In respect to speed of axonal conduction, it is useful to compare rabbit with cat retina, as highlighted in the work of Caldwell and Daw (Reference Caldwell and Daw1978), who noted that DS ganglion cells in rabbit had faster axonal conduction velocities than those of cat retina. Thus DS cells in cat, of which there are presently no intracellularly stained examples, likely have slender axons and small cell bodies (Cleland & Levick, Reference Cleland and Levick1974; Stone & Fukuda, Reference Stone and Fukuda1974; Famiglietti, Reference Famiglietti1987), perhaps sufficient for a frontal-eyed predator.
Possible targets of transient ON DS ganglion cells in the visual brain
Presently, the axonal destination(s) of ON DS-t cells is (are) unknown. It has been supposed that ON DS ganglion cells project to all the nuclei of the AOS to mediate the control of retinal slip along three axes of self-motion (Simpson, Reference Simpson1984). If the AOS requires the short latency input of ON DS-t cells, and no ON DS-t cells project to the MTN (Buhl & Peichl, Reference Buhl and Peichl1986), an imbalance in AOS input might be expected to occur. It has been suggested that ON DS-t cells project to the nucleus of the optic tract (NOT) of the AOS (Kanjhan & Sivyer, Reference Kanjhan and Sivyer2010), based in part on the morphology of ganglion cells labeled by HRP injections into the NOT (Pu & Amthor, Reference Pu and Amthor1990). Fibers of passage are likely to be labeled by that method; however, it appears that only a method relying upon uptake of a marker by synaptic terminals, such as that employing a rabies viral vector (Dhande et al., Reference Dhande, Estevez, Quattrochi, El-Danaf, Nguyen, Berson and Huberman2013), will be definitive. Meanwhile, from a comparative viewpoint in regard to axonal projections, it may be instructive to consider contemporary studies of mouse retinal ganglion cells, fueled as they are by the power of transgenic mutants, in which morphologically similar populations may be distinctively marked throughout their extent from dendrites to axon terminals (Sanes & Masland, Reference Sanes and Masland2015).
As noted above, rabbit retina provides the model system for analysis of directional selectivity in other mammalian retinas, and for the assessment of DS ganglion cell types. Early studies showed that ON–OFF DS cells are selective for direction of motion in four cardinal directions: up, down, anterior, and posterior, whereas ON DS cells are selective for three directions of motion, aligned with the semicircular canals (Barlow et al., Reference Barlow, Hill and Levick1964; Oyster, Reference Oyster1968). The former project to the dorsal lateral geniculate nucleus (dLGN) (Levick et al., Reference Levick, Oyster and Takahashi1969), and presumably to the superior colliculus (SC) (Vaney et al., Reference Vaney, Peichl, Wässle and Illing1981), while the latter project to MTN (Buhl & Peichl, Reference Buhl and Peichl1986), and presumably to the other nuclei of the AOS (Simpson, Reference Simpson1984). Consequently, the evidence in rabbit has suggested a clear cut functional distinction between ON and ON–OFF DS ganglion cells (Simpson, Reference Simpson1984; Vaney et al., Reference Vaney, He, Taylor, Levick, Zanker and Zeil2001).
In mouse, ON–OFF DS ganglion cells representing all four cardinal directions of motion have been identified (Weng et al., Reference Weng, Sun and He2005; Huberman et al., Reference Huberman, Wei, Elstrott, Stafford, Feller and Barres2009; Kay et al., Reference Kay, De la Huerta, Kim, Zhang, Yamagata, Chu, Meister and Sanes2011; Rivlin-Etzion et al., Reference Rivlin-Etzion, Zhou, Wei, Elstrott, Nguyen, Barres, Huberman and Feller2011; Trenholm et al., Reference Trenholm, Johnson, Li, Smith and Awatramani2011; Dhande et al., Reference Dhande, Estevez, Quattrochi, El-Danaf, Nguyen, Berson and Huberman2013). All project to SC, and to dLGN, although for those preferring anterior motion, the latter projection is minimal (Dhande et al., Reference Dhande, Estevez, Quattrochi, El-Danaf, Nguyen, Berson and Huberman2013). In mouse, ON DS cells representing all three directions of motion have also been identified (Sun et al., Reference Sun, Deng, Levick and He2006; Yonehara et al., Reference Yonehara, Ishikane, Sakuta, Shintani, Nakamura-Yonehara, Kamiji, Usui and Noda2009; Dhande et al., Reference Dhande, Estevez, Quattrochi, El-Danaf, Nguyen, Berson and Huberman2013). ON DS cells preferring upward motion project to dorsal MTN, and those preferring downward motion project to ventral MTN (Yonehara et al., Reference Yonehara, Ishikane, Sakuta, Shintani, Nakamura-Yonehara, Kamiji, Usui and Noda2009), believed to correspond to the lateral terminal nucleus of rabbit (Dhande et al., Reference Dhande, Estevez, Quattrochi, El-Danaf, Nguyen, Berson and Huberman2013). ON DS cells preferring anterior motion project to NOT and the dorsal terminal nucleus (DTN) (Dhande et al., Reference Dhande, Estevez, Quattrochi, El-Danaf, Nguyen, Berson and Huberman2013).
Unexpectedly, ON–OFF DS ganglion cells preferring anterior motion, morphologically similar to other ON–OFF DS cells, also project to NOT (Dhande et al., Reference Dhande, Estevez, Quattrochi, El-Danaf, Nguyen, Berson and Huberman2013). It is not clear at present that this fact differentiates them from rabbit ON–OFF DS ganglion cells with similar directional preference, although the directional selectivity in mouse is relatively weak. It has also been reported that ON–OFF DS cells preferring superior motion project to NOT and to MTN as well (Kay et al., Reference Kay, De la Huerta, Kim, Zhang, Yamagata, Chu, Meister and Sanes2011). It has been suggested that such overlapping projections representing different directions could aid in sharpening directional responses generated through inhibition in AOS nuclei (Simpson, Reference Simpson1984; Dhande et al., Reference Dhande, Estevez, Quattrochi, El-Danaf, Nguyen, Berson and Huberman2013), as proposed for ON–OFF DS cells in rabbit dLGN (Levick et al., Reference Levick, Oyster and Takahashi1969).
Two other unexpected findings have been made in mouse ON–OFF DS ganglion cells. The first is that there are two types of ON–OFF DS cells preferring posterior motion (Rivlin-Etzion et al., Reference Rivlin-Etzion, Zhou, Wei, Elstrott, Nguyen, Barres, Huberman and Feller2011). They look similar morphologically, but differ in the amount of dendritic field overlap, in the sharpness of DS tuning, and in their projections, one innervating ventral LGN and the Zona Incerta, in addition to dLGN and SC. This finding prompted speculation that there might be a second set of ON–OFF DS ganglion cells, for a total of eight types, rather than the lagomorphic four (Rivlin-Etzion et al., Reference Rivlin-Etzion, Zhou, Wei, Elstrott, Nguyen, Barres, Huberman and Feller2011).
The second unexpected finding is that ON–OFF DS cells preferring superior motion tend to have asymmetrical dendritic trees aligned with the preferred direction of motion (Kay et al., Reference Kay, De la Huerta, Kim, Zhang, Yamagata, Chu, Meister and Sanes2011; Trenholm et al., Reference Trenholm, Johnson, Li, Smith and Awatramani2011). Furthermore, their directional selectivity persists in the presence of pharmacological blockers of GABAA receptors, demonstrating the importance of intrinsic properties of DS ganglion cell dendrites in forming DS responses (see also Kim et al., Reference Kim, Zhang, Yamagata, Meister and Sanes2008). This finding of functional asymmetry in the dendritic trees of DS ganglion cells runs counter to the evidence obtained in rabbit retina (Oyster et al., Reference Oyster, Amthor and Takahashi1993; He et al., Reference He, Jin and Masland1999). Nevertheless, ON–OFF DS cells preferring superior motion are also unique in rabbit, as the only ones showing tracer and electrical coupling (Kanjhan & Vaney, Reference Kanjhan and Vaney2008).
A third unexpected finding in mouse is the discovery of a second type of ON DS ganglion cell projecting to SC, rather than MTN, that includes cells preferring at least three different directions of motion (Gauvain & Murphy, Reference Gauvain and Murphy2015). This new type of ON DS cell in mouse, like ON DS projecting to MTN, is partly bistratified. Its dendritic tree is intermediate in size between the larger MTN-projecting ON DS cells and the smaller ON–OFF DS cells. Moreover, its branching pattern resembles the latter more than the former. In a comparison of these three cell types, the SC-projecting ON DS cell is also intermediate in the magnitude of its sustained firing rate and its velocity tuning, which peaks at about 13°/s (Gauvain & Murphy, Reference Gauvain and Murphy2015). In regard to this last feature of velocity tuning, it is instructive to consider that the anterior-preferring ON–OFF DS ganglion cell projecting to NOT has a relatively slow preferred velocity peaking at about 8°/s, in contrast to the typical ON–OFF DS cells in mouse which respond well to speeds up to 100°/s. Is this new, somewhat more “transient” ON DS ganglion cell in mouse homologous with the ON DS-t cell of rabbit, despite its size and partial bistratification?
Despite all their differences, ON DS-s and ON DS-t ganglion cells in rabbit retina have similar preferred velocities of about 5 degrees/sec. (Hoshi et al., Reference Hoshi, Tian, Massey and Mills2011). The results in mouse, described above, show the primary importance of velocity tuning in shaping the responses of DS ganglion cells projecting to the AOS. Consequently, ON DS-t cells are more likely to project to the AOS than to SC. Nevertheless, it remains a puzzle how all three preferred directions of motion of ON DS-t cells are accommodated in the AOS in the absence of MTN projections.
Dendritic stratification of transient ON DS ganglion cells in relationship to starburst amacrine cells
Starburst amacrine cells have been shown convincingly to have directionally selective properties (see also Euler et al., Reference Euler, Detwiler and Denk2002; Lee & Zhou, Reference Lee and Zhou2006), and are regarded as essential for the production of directional selectivity in ganglion cells (Yoshida et al., Reference Yoshida, Watanabe, Ishikane, Tachibana, Pastan and Nakanishi2001). Starburst amacrine cells are the only amacrine cells that contain the enzyme required to synthesize ACh (Famiglietti & Tumosa, Reference Famiglietti, Tumosa, Agardh and Ehinger1986; Brandon, Reference Brandon1987; Famiglietti & Tumosa, Reference Famiglietti and Tumosa1987), and make releasable ACh from choline (Masland & Mills, Reference Masland and Mills1979; O'Malley & Masland, Reference O’Malley and Masland1989). They also contain γ-amino-butyric acid (GABA) (Brecha et al., Reference Brecha, Johnson, Peichl and Wässle1988; Vaney & Young, Reference Vaney and Young1988), and the GABA synthetic enzyme GAD67 (Famiglietti & Sharpe, Reference Famiglietti and Sharpe1994; Brandon & Criswell, Reference Brandon and Criswell1995; Famiglietti & Sundquist, Reference Famiglietti and Sundquist2010). Both excitation and inhibition are important in generating DS responses (Barlow & Levick, Reference Barlow and Levick1965; Levick, Reference Levick1967; Oyster, Reference Oyster1968; Wyatt & Daw, Reference Wyatt and Daw1976; Ariel & Daw, Reference Ariel and Daw1982b ). Starburst amacrine cells co-stratify with ON DS-s and ON–OFF DS ganglion cells (Famiglietti, Reference Famiglietti1981a , Reference Famiglietti1983; Vaney, Reference Vaney, Osborne and Chader1990; Famiglietti, Reference Famiglietti1992b ; He & Masland, Reference He and Masland1998; Famiglietti, Reference Famiglietti2002), and dual recordings have provided convincing evidence (Lee et al., Reference Lee, Kim and Zhou2010) that starburst amacrine cells provide excitatory and inhibitory input to ON–OFF DS ganglion cells. Both ON DS-s and ON DS-t ganglion cells have relatively slow velocity preferences, and the same three sets of preferred directions (Oyster, Reference Oyster1968; Kanjhan & Sivyer, Reference Kanjhan and Sivyer2010; Hoshi et al., Reference Hoshi, Tian, Massey and Mills2011), aligned with the semicircular canals of the vestibular system (Simpson, Reference Simpson1984). Starburst amacrine cells appear to be necessary but perhaps not sufficient to every aspect of the DS response (Famiglietti, Reference Famiglietti2002), particularly as regards the GABA-dependent, low velocity tuning characteristic of ON DS cells (Wyatt & Daw, Reference Wyatt and Daw1976; Ariel & Daw, Reference Ariel and Daw1982b ; Sivyer et al., Reference Sivyer, van Wyk, Vaney and Taylor2010).
Brisk-concentric ganglion cells in rabbit retina respond to cholinergic agonists with an increase in spontaneous activity, but light-driven effects of agonists are uncommon (Ariel & Daw, Reference Ariel and Daw1982a ). Similarly, ON DS-t ganglion cells are relatively unresponsive to nicotine (Hoshi et al., Reference Hoshi, Tian, Massey and Mills2011). The broader dendritic stratification of class IIb1 cells is another feature they have in common with other class I and class II cells, none of which are as narrowly stratified as ON–OFF DS cells or ON DS-s cells (Famiglietti, Reference Famiglietti1992b , Reference Famiglietti2002, Reference Famiglietti2009). It has been noted previously, for example, in 3D computer-logged and rotated dendritic trees of class IIa cells, that some distal dendrites dip to the level of type a starburst amacrine (SAa) cell dendrites (Fig. 10 in Famiglietti, Reference Famiglietti2004a ). At the same time, these morphological counterparts of OFF-center, brisk-sustained cells (Jensen, Reference Jensen1991) should have no light-driven cholinergic responses (Ariel & Daw, Reference Ariel and Daw1982b ). In contrast to brisk-concentric ganglion cells, ON DS-s (and ON–OFF DS) ganglion cells are driven by cholinergic agonists to high rates of firing and even to depolarization block (Masland & Ames, Reference Masland and Ames1976; Hoshi et al., Reference Hoshi, Tian, Massey and Mills2011). The lack of responsiveness to nicotine of ON DS-t cells suggests that their dendrites bear only a small number of nicotinic receptors, consistent with their morphological affinity to class I and class II (brisk-concentric) cells, but does not rule out selective synaptic contact with starburst amacrine cells (Fig. 11).
Hoshi et al. (Reference Hoshi, Tian, Massey and Mills2011) performed choline acetyltransferase immunocytochemistry with a fluorescent marker on retinas containing intracellularly stained ON CS-t cells, showing that most of their dendrites branch in a substratum just above the substratum of SAb cell dendrites. These authors calculated the distance between the dendritic substrata of overlapping ON DS-s and ON DS-t cells to be 3 µm. The present study, using Golgi-impregnated material that affords somewhat better visualization in comparison to confocal fluorescence microscopy, indicates that the distance between the main branching of class IIb1 ganglion cells and SAb cells, center-to-center, is 3.2 to 3.5 µm (Fig. 11). Because class IVus1 cells branch 0.5 to 1.0 µm deeper than ON–OFF DS cells (Famiglietti, Reference Famiglietti1992b , Reference Famiglietti2002), calculation of the distance between the middle of the main branching level of IIb1 and IVus1 cells would yield values of 3.7 to 4.5 µm in our material. Part of the discrepancy between the two studies can be accounted for by the difference in total thickness of the IPL: 15 µm in their material and 19–20 µm at the visual streak in ours. The latter difference is likely due to the fact that the samples in the study of Hoshi et al. (Reference Hoshi, Tian, Massey and Mills2011) were taken from ventral retina, 2–8 mm ventral to the visual streak, where the retina and IPL are thinner, and where the substrata may shift in relative distances from the IPL borders (Famiglietti & Vaughn, Reference Famiglietti and Vaughn1981). This difference in retinal location could also explain most of the discrepancies between our percentage-of-depth measurements, which are all in the same direction: (1) ON DS-t cells: 50% versus 57%, (2) sublamina b ChAT band: 68.5% versus 74%, and (3) ON DS-s substratum: 72–74% versus 77%. Note that in my previous work, and in the “standard diagram” of IPL stratification (e.g. Famiglietti, Reference Famiglietti1992b ), ON-OFF DS ganglion cell dendritic stratification and ChAT stratification in sublamina b are placed at 70%, not at 75%, as misstated in the paper of Hoshi et al. (Reference Hoshi, Tian, Massey and Mills2011).
Based upon their determination of a 3 µm difference between the levels of stratification of ON DS-t and ON–OFF-s ganglion cells, Hoshi et al. (Reference Hoshi, Tian, Massey and Mills2011) realized that ON DS-t and “starburst amacrine cells clearly occupy different substrata and …lack opportunity for much synaptic contact”. They concluded therefore that “there may be additional mechanism to generate directional selectivity” other than starburst amacrine cells in ON DS-t ganglion cells. Ackert et al. (Reference Ackert, Farajian, Volgyi and Bloomfield2009) described the stratification of ON DS cells they studied as running “along the ChAT band in sublamina b”. As in previous pharmacological studies (Ariel & Daw, Reference Ariel and Daw1982a ,Reference Ariel and Daw b ), they assume that the pharmacological effects of the nonselective GABA blocker, picrotoxin, eliminating directional selectivity in the ON DS ganglion cells they studied, as well as their use of the nicotinic blocker hexamethonium, were interrupting the action of starburst amacrine cells. In the present study, despite general agreement with Hoshi et al. (Reference Hoshi, Tian, Massey and Mills2011) on the separation of ON DS-t dendritic branching from the ChAT band in sublamina b, I show ample opportunity for synaptic contact between the two, because of divergent dendritic branches of the ganglion cell (Figs. 6–11). Given the similar DS properties of ON DS-s and ON DS-t, parsimony favors the view that the two are innervated by common inputs, mediated mainly by starburst amacrine cells (Fig. 13), and perhaps supplemented by another inhibitory amacrine cell and/or a bipolar cell with slow kinetics, responsible for their slow velocity preference (see Famiglietti, Reference Famiglietti2002). At present, however, there is no unequivocal evidence either in rabbit or in mouse for direct, functional connections driving directional selectivity between starburst amacrine cells and either of the two types of ON DS ganglion cell.
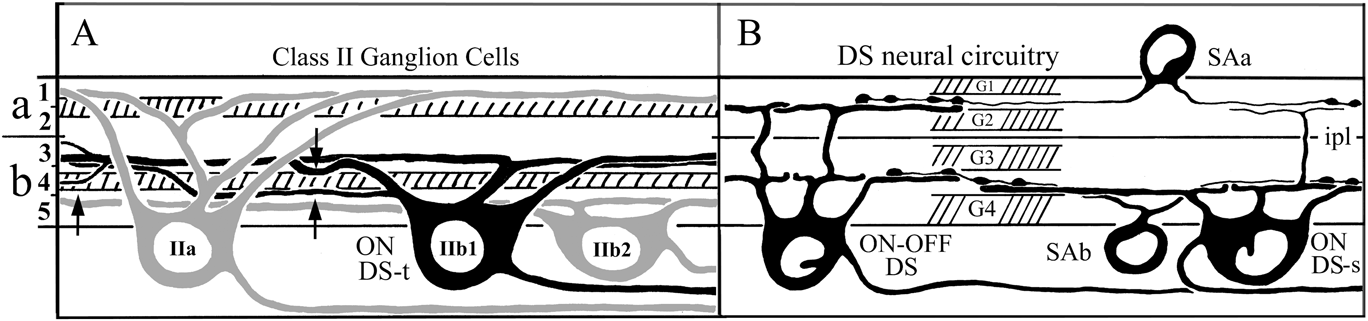
Summary drawing of the dendritic stratification of class II ganglion cells (A), and of starburst amacrine cells (B) with ON–OFF and ON DS-s ganglion cells. In (A), the paramorphic pair of class II cells is illustrated (gray), and the “orphan” class IIb1 cell (black), which is shown in the present study to correspond to the “transient” ON DS ganglion cell (ON DS-t) of recent physiological studies. The branching of starburst amacrine cells is indicated by crosshatching in (A). Class IIa and IIb2 cells are unistratified, but class IIb1 cells are partly bistratified, with their main branching in S3, near the S3/S4 border, and portions of a subset of branches in S4 that may come in contact with starburst boutons in sublamina b (arrows in (A)). Short terminal dendritic branches may also be present on class IIb1 cells in outer S3. In (B), the previously identified ON–OFF DS and ON DS-s cells, now regarded as “sustained”, are illustrated, together with the two types of starburst amacrine cells, as well as the bands marked by GAD65-like immunoreactivity (G1–G4). It is assumed that the IIb1 cell in (A) receives starburst amacrine cell input comparable to that depicted in (B). for IVus1/ON DS-s and ON–OFF ganglion cells.

Other amacrine cell candidates for DS input to transient ON DS ganglion cells
Ackert et al. (Reference Ackert, Wu, Lee, Abrams, Hu, Perlman and Bloomfield2006) have shown that ON DS-t cells exhibit synchronous spike discharge among neighboring ON DS-t ganglion cells that is blocked both by null directions stimulus movement and by gap junctional blockers for stimulus movement in all directions. In blocking GABAA receptors, picrotoxin restores synchrony in the null direction. Gap junctional coupling, supported by evidence of dye-coupling does not occur homotypically among ganglion cells but heterotypically with amacrine cells, including axon-bearing, wide-field amacrine cells (see Fig. 12). The latter presumably account for the fact that synchronized ganglion cells are nearby, but nonoverlapping. The particular effects of picrotoxin and GABA with respect to synchonization are explained by the juxtaposition of gap junctions and GABAergic synapses that act to shunt the gap junctional signal in the null direction (Ackert et al., Reference Ackert, Wu, Lee, Abrams, Hu, Perlman and Bloomfield2006).
Hoshi et al. (Reference Hoshi, Tian, Massey and Mills2011) have found a second, coupled amacrine cell with a much smaller dendritic field of a kind shown in Fig. 12C and 12D, and an axon-bearing, HLPα cell (Fig. 12A and 12B) different from that illustrated by Ackert et al. (Reference Ackert, Farajian, Volgyi and Bloomfield2009). It may be that different conditions of illumination or adaptation, which can affect gap junctional coupling (Mangel & Dowling, Reference Mangel and Dowling1985; Bloomfield et al., Reference Bloomfield, Xin and Osborne1997), explain the differences in the cells that exhibit dye coupling in the two studies. The smaller “multistratified” cell (Hoshi et al., Reference Hoshi, Tian, Massey and Mills2011) very likely has a different functional role from that of the axon-bearing cell.
In a second study, Ackert and colleagues (Ackert et al., Reference Ackert, Farajian, Volgyi and Bloomfield2009) found that high concentrations of picrotoxin unmasked an OFF DS response in ON DS-t ganglion cells. Small excitatory and large inhibitory OFF currents are also observed in MTN-projecting ON DS cells of mouse, which commonly have a few dendrites in sublamina a, but these are not directional (Sun et al., Reference Sun, Deng, Levick and He2006). The unmasked OFF responses in ON DS-t cells of rabbit, which have no dendrites in sublamina a, are “paradoxical” in the sense that they are reversed in direction from the blocked ON response. Additionally, these OFF responses can be eliminated by gap junctional blockers. Such paradoxical, picrotoxin-induced reversals of direction have also been observed in ON–OFF DS ganglion cells of rabbit (Grzywacz et al., Reference Grzywacz, Tootle and Amthor1997). Thus reversal of direction in DS cells may reflect a fundamental organization of directionally selective circuits involving complex interactions between ON and OFF pathways that might be characterized as “crossover inhibition” (Werblin, Reference Werblin2010), and in which amacrine cells and gap junctions may play an important role. The coupled, multistratified amacrine (mA) cell described by Hoshi et al. (Reference Hoshi, Tian, Massey and Mills2011) may be an agent for such crosstalk, and a circuit diagram incorporating this cell is presented in Fig. 14. The diagram attempts to account for the pharmacologically induced alterations in the DS responses of ON DS-t ganglion cells reported by Ackert et al. (Reference Ackert, Farajian, Volgyi and Bloomfield2009).
Circuit diagram depicting DS input to the ON DS-t ganglion cell, representing the pharmacological analysis of Ackert et al. (Reference Ackert, Farajian, Volgyi and Bloomfield2009). (A) Control condition. Sublamina a input from the mA cells is shunted by adjacent GABAergic synapses. (B) Cocktail of L-AP4, blocking the ON pathway, picrotoxin at high concentration, blocking GABA inputs and inducing paradoxical OFF directionally selective response in the reverse direction. The addition of hexamethonium, which eliminates the paradoxical reversed null direction (diminished) response requires the introduction of an unknown inhibitory amacrine cell, presumably glycinergic (gly?), that inhibits the mA cell under control conditions. The addition of the gap junctional blocker 18β-GA eliminates responses in all directions. CBa, CBb = type a and type b cone bipolar cells; SAa and SAb = type a and type b starburst amacrine cells. gj = gap junction.

In the diagram, control conditions are depicted in Fig. 14A, in which the inputs to the ON DS-t ganglion cell are confined to the ON circuitry in sublamina b (colored cells in Fig. 14A). The transsublaminar mA cell is silent in sublamina b, because its gap junctional inputs to the ON DS-t cell are shunted by adjacent GABAergic synapses.
Under experimental conditions (Fig. 14B), subject to a cocktail of agents, including L-AP4 to block ON pathways, a high concentration of picrotoxin blocks GABA inputs and enables the paradoxical, reversed OFF response in the ON DS-t cell, mediated by SAa cells and conveyed in translaminar fashion by the mA cell to the ON DS-t ganglion cell. In order to explain the loss of the directional response in the OFF null direction with the addition of hexamethonium to block nicotinic cholinergic output from SAa cells, another (non-GABAergic) inhibitory amacrine cell is introduced in the circuit. The postulated amacrine might use glycine, the second most common inhibitory neurotransmitter in the retina, more highly concentrated in sublamina a, and participate in a serial polysynaptic array so commonly observed in electron microscopic studies (Dowling & Werblin, Reference Dowling and Werblin1969; Famiglietti & Kolb, Reference Famiglietti and Kolb1975; Famiglietti, Reference Famiglietti1991; Marc & Liu, Reference Marc and Liu2000; Dacheux et al., Reference Dacheux, Chimento and Amthor2003; Famiglietti, Reference Famiglietti2005a ; Anderson et al., Reference Anderson, Jones, Watt, Shaw, Yang, Demill, Lauritzen, Lin, Rapp, Mastronarde, Koshevoy, Grimm, Tasdizen, Whitaker and Marc2011). Finally, the addition of a gap junctional blocker, 18β-glycyrrhetinic acid, results in no response to moving stimuli. Note that his diagram does not account for the null direction desynchronization of coupled ON DS-t (Ackert et al., Reference Ackert, Wu, Lee, Abrams, Hu, Perlman and Bloomfield2006), which I assume to be mediated by coupled HLPα amacrine cells, nor does it account for other known trans-sublaminar amacrine cell influences on DS ganglion cells, such as the glutamaturgic vGlut3 amacrine cell (Lee et al., Reference Lee, Chen, Chen, Ye, Seal and Zhou2014), which might be expected to circumvent L-AP4 blockade of the ON pathway, or even the glycinergic and gap junction-coupled AII/rod amacrine cell (Famiglietti & Kolb, Reference Famiglietti and Kolb1975). Interestingly, in their study of “type 5” (possible IIb1) ganglion cells, Roska and Werblin (Reference Roska and Werblin2001) showed the persistence of OFF excitation in the presence of APB, strychnine, and GABA blockers, consistent with a pathway from sublamina a to sublamina b via mA cells and gap junctions.
Acknowledgment
I thank E.C. Siegfried, D. McGlone, and B.R. Ferguson for technical assistance, and R. Miller and T. Shaw for assistance in the development and maintenance of the microscope-based 3D computer logging system. I am grateful to Michael Crair and Yidong Li for use of and assistance with their Neurolucida system. Stephen Mills and two anonymous reviewers provided helpful suggestions for an earlier version of this report. This research was supported in part by P.H.S. Award R01EY03547, the Alfred P. Sloan Foundation, the Alberta Heritage Foundation for Medical Research, the Medical Research Council of Canada, and the Natural Sciences and Engineering Research Council of Canada.