I. INTRODUCTION
Excessive consumption of fossil fuels has triggered a series of worldwide problems, such as resource shortage and environmental pollution. The study of replacing traditional fossil with friendly renewable energy, such as geothermal, solar, biomass, and ocean, has become an important topic. How to better apply these renewable and cleaner energies to large-scale energy storage systems (ESS) is a considerable challenge.Reference Liu, Li, Hu, Li, Chen and Huang1 In the early 1900s, the lithium ion batteries (LIBs) have been first commercialized by Sony. Meanwhile, LIBs possess intrinsic performance such as high energy density, long cycle stability, and environmentally friendly so that LIBs have become the primary candidates for ESS.Reference Nishi2 Nevertheless, the shortage of lithium resource with the raising cost highly limits the industrial development of future LIBs. Therefore, exploiting new materials to replace lithium becomes the inevitable tendency for ESS.
Sodium is the fourth most abundant element on the earth, belongs to the same main group of lithium, and adjacent to lithium in the periodic. As a result, sodium exhibits some similar chemicals and physical properties with lithium. There may be some similarities between sodium ion batteries (SIBs) and LIBs.Reference Qin and Chen3 In fact, as early as the 1980s, SIBs have been developed roughly the same period as LIBs.Reference Fan, Li, Yan, Feng, Xiong, Li, Gu, Wen, Lawes and Sun4,Reference Li, Li, Fan, Yu, Yan, Xiong, Song, Li, Adair, Li and Sun5 However, compared to Li+ (r = 0.076 nm), Na+ (r = 0.102 nm) shows a larger radius, and the electrode materials endure huge volume variation during Na+ insertion/extraction, strongly limiting the rate capability and cycling life of SIBs.Reference Song, Li, Bai, Yan, Li and Sun6 The standard electrode potential of Na/Na+ is −2.71 V [versus standard hydrogen electrode (SHE)], which is higher than the standard electrode potential of Li/Li+ (−3.04 V versus SHE). Hence, for the conventional electrode materials, the capacity of SIBs is lower than that of LIBs.Reference Palomares, Serras, Villaluenga, Hueso, Gonzalez and Rojo7 These factors dramatically hamper the development of SIBs at the side of the LIBs. And in consequence, exploring high capacity, high stability, and environmentally friendly electrode materials is imperative to better develop SIBs.
Carbonaceous materials with abundance, nontoxicity, and chemical stability are one of the most potential electrode materials for energy storage and conversion. Over the years, a great diversity of carbon composite materials have been exploited, containing carbon nanospheres (CNSs), carbon nanotubes (CNTs), carbon nanofibers (CNFs), carbon derivatives, graphene, etc.Reference Zhang, Zhang, Wu, Lv, Kang and Yuan8 However, these carbonaceous materials were usually prepared by using nano-casting technique and using graphite, carbonaceous organic material as the carbon precursors was costly, tedious, and environmentally hazardous. Hence, different types of carbonaceous materials, derived from biomass materials with the advantages of enrich, low cost, clean, and renewable, have attracted extensive attention.Reference Gaddam, Yang, Narayan, Raju, Kumar and Zhao9,Reference Kalyani and Anitha10 Among various biomass-based materials, porous carbon, with gratifying physicochemical properties of super conductivity, satisfactory absorption capacity, high surface area, and excellent chemical stability, is extensively used in energy storage, greenhouse gas capture, and catalyst supports.Reference Rana, Subramani, Sathish and Gautam11–Reference Varma, Avinesh, Narasimman and Prabhakaran14 For instance, fish scales as the initial raw materials have been applied to Li–S batteries, supercapacitors, and electrocatalysts for the oxygen reduction reaction.Reference Zhao, Li, Wang, Zhang, Gao, Xiong, Wang, Yuan, Huang and Wang15–Reference Guo, Hu, Liao, Li, Sun, Shi, Li and Chen17 Soya derived porous carbon was used as multifunction materials for the oxygen reduction reaction, CO2 capture, and supercapacitors,Reference Rana, Subramani, Sathish and Gautam11 and bean-dreg-derived porous carbon was used as multifunction materials for LIBs.Reference Ru, Xiang, Zhou, Zhu, Zhao and Chen18 Petals, due to their flexible performance, have been employed as the electrode materials for flexible supercapacitors.Reference Yu, Wang, Li, Li and Shang19
The porous carbon materials of using biomass materials as precursors are usually prepared by direct carbonization of biomass or various activation methods. The activation methods include physical activation (e.g., the expansion of carbon lattice) and chemical activation by common activators (e.g., KOH, NaOH, K2FeO4, ZnCl2, CO2).Reference Rana, Subramani, Sathish and Gautam11,Reference Cai, Luo, Dong, Zhao, Xiao, Liang, Hu, Liu and Zheng20–Reference Ke, Yang, Liu, Liu and Dong23 The chemical activation method is effective to acquire a high surface area. Compared to other agents, KOH as the most used activating agent can manufacture porous carbons with higher output, higher specific surface area, and more micropores at lower temperatures.Reference Imtiaz, Zhang, Zafar, Ji, Huang, Anderson, Zhang and Huang24 In 1978, some well-known commercially activated carbon materials with high specific surface area, such as ACs, AX21, and Maxsorb, were fabricated by KOH activation with fossil fuels as carbon sources. Since then, the method of KOH activation has become very prevalent to fabricate porous carbon.Reference Wang and Kaskel25
We selected KOH as the activator to establish porous carbon (PC) which employed fruit shells of the paulownia tomentosa (denoted as FSPT) as the precursor. The porous carbon materials derived from biomass possess specific surface area and abundant interconnected pores owing to the connatural structure of biomass, and as a result, the porous carbon can shorten the distance of sodium ion diffusion, facilitate the permeation and transmission of electrolytes, and provide the favorable storage and adsorption sites for Na+, thereby improving the electrochemical capability of SIBs. Moreover, doping of heteroatoms (e.g., O, N, S, and B) strengthens the polarity of porous carbon, contributing to the excellent performance in terms of high reversible capacity and superior rate capacity.Reference Ru, Xiang, Zhou, Zhu, Zhao and Chen18
II. EXPERIMENTAL SECTION
A. Materials
FSPT were collected from the tree at our school (Tianjin, China). All chemicals with reagent grade were directly used without further purification. Deionized water was used in the entire experiment.
B. Synthesis of the PTPC
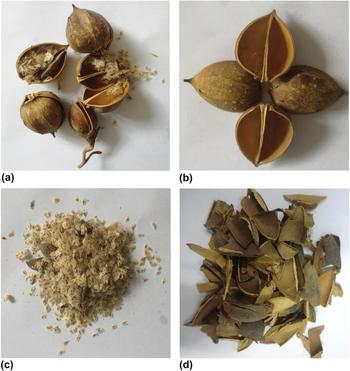
First, the collected FSPT [Fig. 1(a)] were separated into shells [Fig. 1(b)] and seeds [Fig. 1(c)], and then shells were cut into small pieces. These pieces were extensively washed [Fig. 1(d)] under water, ethanol, and H2SO4 and then pre-carbonized at 350 °C in the air atmosphere for 3 h. Next, they were ground into powder and then mixed with KOH with a mass ratio of 1:4, 1:5, and 1:7, and 40 mL water was added. The mixture was sealed in 50 mL Teflon-lined autoclaves at 180 °C for 6 h and then froze for about 12 h in the refrigerator until it turned into ice; next, it was freeze-dried for about 12 h. The obtained product was placed into the nickel boat and annealed at 800 °C for 2 h in a horizontal tubular furnace under Ar atmosphere with a heating rate of 5 °C/min and then cooled to room temperature naturally. Excess KOH was neutralized by 1.0 M HCl and ultrasonic oscillations for about 30 min, followed by repeatedly washing with water until neutral pH and dried in a vacuum oven at 80 °C. The resultant materials were marked as PTPC-X. PTPC and X represented the porous carbon obtained from paulownia tomentosa and X related to the mass ratio of KOH to FSPT via precarbonization of 4:1, 5:1, and 7:1, respectively.
(a) Fruits of Paulowina tomentosa, (b) fruit shells of Paulowina tomentosa, (c) fruit seeds of Paulowina tomentosa, and (d) after pretreatment of FSPT.

The PTPC-5h sample was prepared by direct heat drying at 80 °C after hydrothermal reaction at 180 °C for 6 h, with the other procedure identical to the PTPC-5 sample.
C. Characterization
Scanning emission microscope (SEM; Hitachi SU8010, Hitachi, Ltd., Tokyo, Japan) and transmission electron microscope (TEM; JEOL JEM-3000F, JEOL Ltd., Tokyo, Japan) were engaged to observe the microstructure and morphology of the ultimate PTPC materials. Nitrogen adsorption measurements at 77 K (ASIQ2, Quantachrome, Instruments, Shanghai, China) were performed to measure the specific surface areas and pore size and deduce the pore shapes of the porous materials. Prior to measurement, all porous materials under test were dealt with vacuum conditions at 300 °C for 15 h to the surface of materials and pores utterly without adsorbates. The specific surface areas and the total volume of the PTPC sample were calculated by the Brunauer–Emmett–Teller (BET) theory. The mesoporous surface areas and pore volumes were calculated by the Barrett–Joyner–Halenda (BJH) method. The pore size distributions (PSDs) were based on the nonlocal density function theory (NLDFT). X-ray diffraction spectrometer (XRD; Bruker AXS D8Advance, Bruker Corp., Beijing, China) and LabRAM HR800 spectrometer (Horiba, Edison, New Jersey) for Raman spectra were used to analyze the structure of samples. X-ray photoelectron spectroscopy (XPS; VG ESCALAB MK II, VG Scienta, St Leonards-on-Sea, United Kingdom) was used to determine the amount of functional groups and the O content of samples.
D. Electrochemical evaluation
Electrochemical performance was tested using CR2032 type coin cells, assembled in a dry glove box filled with pure argon. The working electrodes were prepared by coating the mixture of active materials (80 wt%), acetylene black (10 wt%), and carboxymethylcellulose sodium (10 wt%) dissolved in water onto a Cu foil, and sodium sheets were used for the counter and reference electrodes. The electrolyte was 1 M NaClO4 in a mixture solution of ethylene carbonate (EC) and propylene carbonate (PC) in a 1:1 volume ratio with 5.0% fluoroethylene carbonate (FEC). Cyclic voltammetry (CV) tests were performed on a Princeton Applied Research VersaSTAT 4 electrochemical workstation (AMETEK, Shanghai, China) at a scan rate of 0.1 mV/s at a potential range between 0.01 and 3.0 V (versus Na/Na+). Galvanostatic sodiation-desodiation cycling was performed on the LAND CT2001A test system (Wuhan LAND electronics Co. LTD., Wuhan, China) at room temperature with a potential range of 0.01–3.0 V. The alternating current (AC) impedance spectra were obtained over the frequency ranging from 100 KHz to 0.01 Hz with an amplitude of 5.0 mV.
III. RESULTS AND DISCUSSION
As well known, KOH serves as the activation agent to trigger the carbon structure to form the pore; however, the activation mechanism has not been absolutely clarified due to the activation process referring to many reactions. In a generally accepted view, the probable reactions of carbon and KOH are concluded by several equations as followsReference Wang and Kaskel25:
 $$2{\rm{KOH}} \to {{\rm{K}}_2}{\rm{O}} + {{\rm{H}}_2}{\rm{O}}\quad {\rm{,}}$$
 $$6{\rm{KOH}} + 2{\rm{C}} \to 2{\rm{K}} + 3{{\rm{H}}_2} + 2{{\rm{K}}_2}{\rm{C}}{{\rm{O}}_3}\quad ,$$
 $${\rm{C}} + {{\rm{H}}_2}{\rm{O}} \to {\rm{CO}} + {{\rm{H}}_2}\quad ,$$
 $${\rm{CO}} + {{\rm{H}}_2}{\rm{O}} \to {\rm{C}}{{\rm{O}}_2} + {{\rm{H}}_2}\quad ,$$
 $${\rm{C}}{{\rm{O}}_2} + {{\rm{K}}_2}{\rm{O}} \to {{\rm{K}}_2}{\rm{C}}{{\rm{O}}_3}\quad ,$$
 $${{\rm{K}}_2}{\rm{C}}{{\rm{O}}_3} \to {{\rm{K}}_2}{\rm{O}} + {\rm{C}}{{\rm{O}}_2}\quad ,$$
 $${\rm{C}}{{\rm{O}}_2} + {\rm{C}} \to 2{\rm{CO}}\quad {\rm{,}}$$
 $${{\rm{K}}_2}{\rm{C}}{{\rm{O}}_3} + 2{\rm{C}} \to 2{\rm{K}} + 3{\rm{CO}}\quad {\rm{,}}$$
 $${\rm{C}} + {{\rm{K}}_2}{\rm{O}} \to 2{\rm{K}} + {\rm{CO}}\quad {\rm{.}}$$
As a matter of fact, the KOH activation mechanism is far more complex than these equations embodied. Linares-Solano and co-workersReference Lozano-Castelló, Calo, Cazorla-Amorós and Linares-Solano26 studied the KOH activation process via monitoring the change of CO, CO2, H2O, and H2 by temperature-programmed reaction (TPR) experiments and then combined the theoretical calculation to particularly explain the reactions at different temperatures and stages. As reflected in Eqs. (2) and (5), potassium carbonate (K2CO3) is the important intermediate formed at about 400 °C for the activation of carbon materials. Along with the temperature up to 600 °C, KOH will be completely vanished, as shown in Eqs. (1) and (2). The decomposition reaction of the as-formed K2CO3 will happen once the temperature is increased to 700 °C in Eqs. (6) and (8). When the temperature increases to 800 °C, K2CO3 will be exhausted. At the same time, when the temperature is increased to 700 °C, the generated CO2 in Eqs. (4) and (6) and the intermediate potassium oxide (K2O) in Eqs. (1) and (6) can further react with carbon and produce CO and metallic K, conveyed by Eqs. (7) and (9).
According to the reaction in different activation stages, three activation mechanisms of building the pore network of carbon matrix by KOH activation are concluded as followsReference Gong, Li, Luo, Fu and Pan21,Reference Wang and Kaskel25–Reference Otowa, Tanibata and Itoh27 : (i) KOH and multiple potassium compounds (K2O, K2CO3) with good chemical activity work as the chemical activating agent to etch the carbon skeleton, as revealed by Eqs. (2), (8), and (9), which is defined as the chemical activation; (ii) the gas of H2O and CO2 produced in Eqs. (1), (4), and (6) can further react with carbon to create more pores, as exhibited in Eqs. (2) and (8), which is named as physical activation [Eqs. (2) and (7)]; (iii) the carbon can be further activated by the insertion of metallic K and K compounds [Eqs. (5), (8), and (9)] within carbon layers, resulting in enlarged carbon layers. After acid treatment, the intercalated metallic K and K compounds will be eliminated, and the inflated carbon lattices with a porous structure of the activated carbon will remain, demonstrating the formation of porous carbon from KOH activation.
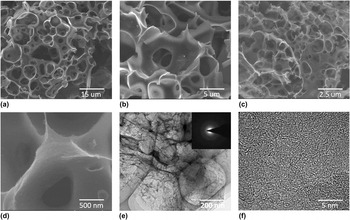
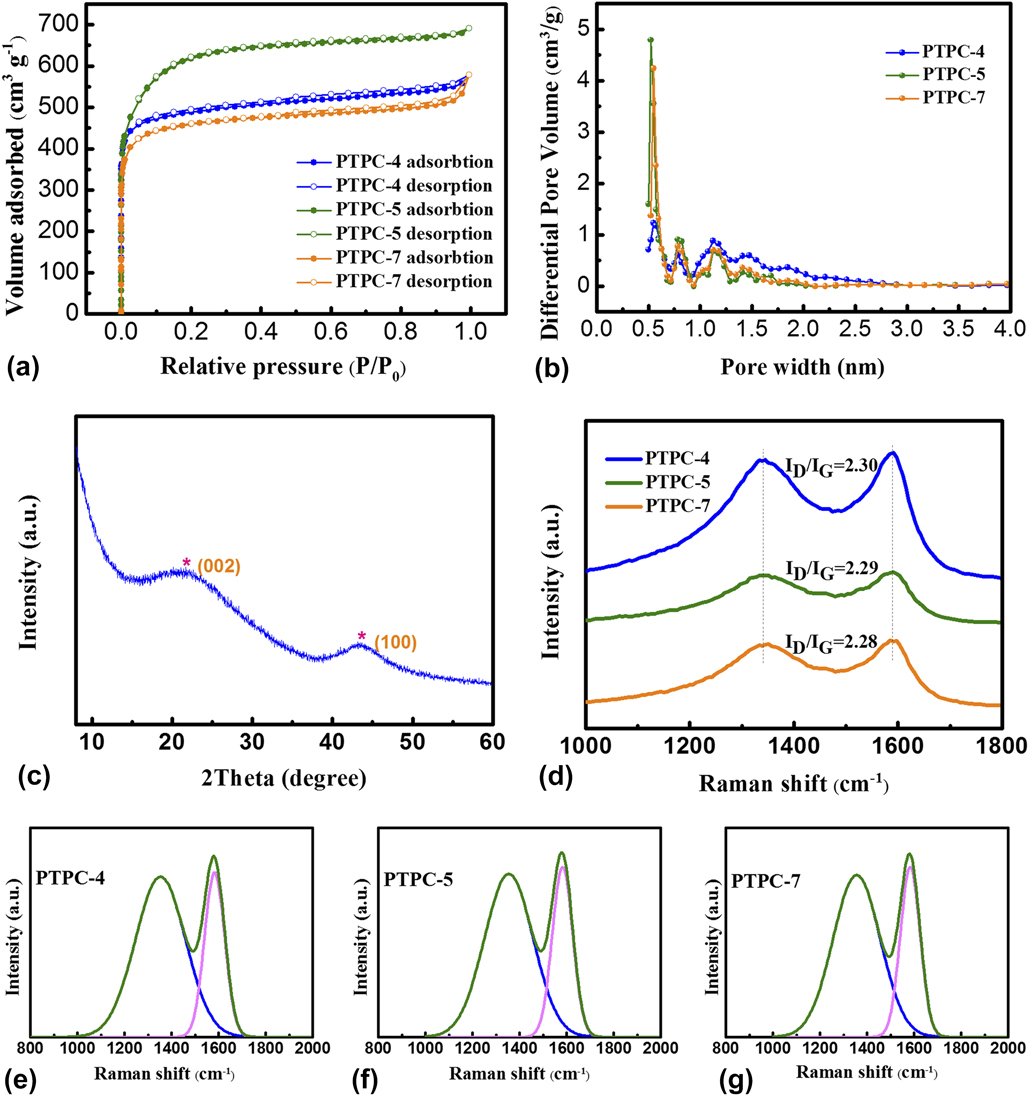
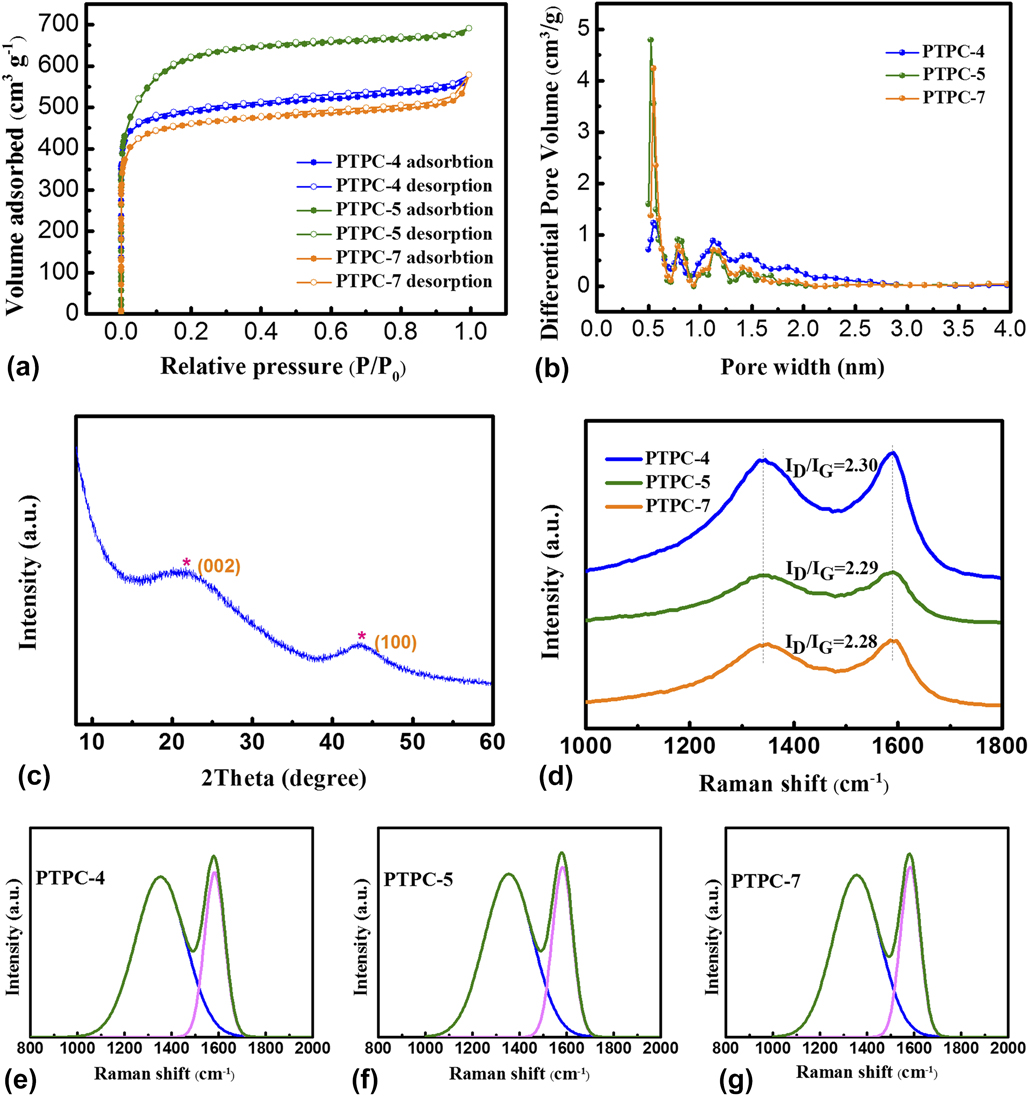
The morphological features of PTPC samples were unfolded by SEM and TEM. As shown in the SEM images of PTPC-5h [Figs. S1(a) and S1(b), in Supplementary Material], the sample displays some macropores due to KOH activation. However, these SEM images in Figs. S1(a), S1(c), and S1(d) exhibited the as-obtained asymmetrical porous carbon, and some distinct porous carbon established well can be detected (Fig. S2), but a number of carbons without activation as shown in Fig. S1(d) also can be found. It indicates that the activation process of PTPC-5h is asymmetric resulting from the direct heat drying, which causes KOH to be separated out and deposited to a certain extent, leading to KOH uneven distribution around the carbon matrix. The porous carbon prepared by freeze-drying is shown in Figs. 2(a)–2(d). In view of these SEM and TEM images in Figs. 2(a)–2(e), some macropores are clearly observed. According to the SEM images in Figs. 2(a)–2(c), the interconnected framework of PTPC-4, PTPC-5, and PTPC-7 can be certified. As shown in Fig. 2(d), the surface of PTPC is rough, with plenty of small pores. Some similar graphene lamella structure is also found at the edge of fracture in the TEM images [Fig. 2(e)]. The selected electron area diffraction (SAED) pattern [inset in Fig. 2(e)] reveals legible diffraction due to the defect of carbon structure. The porous carbon materials with a homogeneous distribution of plenty micropores can be testified by the HRTEM image in Fig. 2(f). Moreover, some mesopore channel walls are formed owing to the high content of KOH breaking the carbon bones between the micro/mesopores.Reference Wang, Yu, Shi, Mao, Chen and Liu13 The N2 adsorption/desorption measurement was used to comprehensively analyze the pore structure. As shown in the isotherms of PTPC [Fig. 3(a)], the amount of adsorbate rapidly increases at low p/p 0 (<0.05) and then approaches a limitation, and the isotherm is parallel to the p/p 0 axis. Therefore, one can deduce that the adsorption type of PTPC belongs to the typical type-I [Fig. 3(b)] of Langmuir adsorption.Reference Thommes, Kaneko, Neimark, Olivier, Rodriguez-Reinoso, Rouquerol and Sing28 It indicates that the PTPC samples contain a great quantity of micropores and some narrow mesopores, coinciding with the result of HRTEM. It should be noticed that the adsorption amount of PTPC-7 distinctly increases at high p/p 0 (>0.9) owing to the condensation of adsorbate at saturated pressure. The hysteresis loops of PTPC-4 were not obvious in Fig. 3(a) but more expansive along with the mass fraction of KOH increased, which showed an emblematical type-H4 owing to capillary condensation in the layer stacked micropores and slits.Reference Thommes, Kaneko, Neimark, Olivier, Rodriguez-Reinoso, Rouquerol and Sing28 The PSD of all PTPC is obtained in Fig. 3(b) by the NLDFT based on the adsorption data. From the PSD [Fig. 3(b)] of PTPC-4, PTPC-5, and PTPC-7, all exhibit similar hierarchical porosity, with the content of pores up to the maximum at 0.5 nm, and all the pore diameters are below 3 nm. Meanwhile, the PSD are more intuitionistic reflecting that all PTPC samples show abundant micropores and bits of narrow mesopores on account of the chemical activation of KOH.Reference Kierzek, Frackowiak, Lota, Gryglewicz and Machnikowski29 Furthermore, according to the BET results, the specific surface areas of PTPC-4, PTPC-5 and PTPC-7 are calculated as 2275.8, 1914.4, and 1775.3 m2/g, respectively. Moreover, the total pore volume of PTPC-4, PTPC-5, and PTPC-7 calculated is 1.07, 0.90, and 0.89 cm3/g, respectively. It was accounted by pertinent literature that the specific surface area of porous carbon by KOH activation can be augmented as the concentrate of KOH at low content, and then it reached the maximum. Further increase of the KOH concentrate leads to the decrease of specific surface area.Reference Ye, Yin, Xin and Guo30 Superabundant concentration of KOH can cause more carbon loss with the ruptured carbon bone and reduce the specific surface area. The average pore diameters of PTPC-4, PTPC-5, and PTPC-7 are 1.88, 1.87, and 2.02 nm, respectively. The mesopore volume of PTPC-4, PTPC-5, and PTPC-7 computed by the BJH method is 0.10, 0.15, and 0.19 cm3/g, respectively. The ratios of the micropore volume to the total volume are 0.90, 0.83, and 0.78 cm3/g for PTPC-4, PTPC-5, and PTPC-7, respectively. Based on the above discussion, one can see that the concentrate of KOH reveals a significant impact on the pore size, and the pore becomes larger with the increase of KOH concentration, resulting in reducing the content of micropores. The micropores are formed in the initial process of KOH activation, and then, the adjacent micropores with the carbon skeleton will be transformed into the mesopores and/or mesopore walls with the increase of the KOH content. With the increased content of KOH, the mesopores and/or mesopore walls increased, leading to the capillary condensation phenomenon by N2 took off more remarkable, and as a result, the hysteresis loops of the isotherms of porous carbon samples expanded along with the increased mass fraction of KOH.Reference Thommes, Kaneko, Neimark, Olivier, Rodriguez-Reinoso, Rouquerol and Sing28 All porous properties of PTPC-4, PTPC-5, and PTPC-7 samples are listed in Table I. Clearly, the PTPC samples reveal hierarchical porous, mesopore walls, interconnected structures, and larger specific surface areas.
SEM images of the as-obtained (a) PTPC-4, (b) PTPC-5, and (c, d) PTPC-7; (e) TEM and (f) HRTEM images of PTPC-5 (the inset for SAED).

(a) N2 adsorption–desorption isotherm and (b) porosity distribution by the density functional theory model of the materials of PTPC; (c) XRD patterns of the PTPC-2; (d) Raman spectra of PTPC-4, PTPC-5, and PTPC-7; fitting result of the Raman spectra of (e) PTPC-4, (f) PTPC-5, and (g) PTPC-7.
The specific surface area, pore size, and pore volume of PTPC activated with various KOH concentrations.

a The specific area (S BET) was calculated by the BET method.
b V T represented the total pore volume calculated by NLDFT analysis.
c The volume of micropore (V micro) was obtained by subtracting the mesoporous volume from the total pore volume.
d The volume of mesopore (V mes) calculated by the BJH method.
Figure 3(c) depicts the XRD pattern of the PTPC-5. It displays two significant peaks at 2θ = 22.3° and 43.3°, corresponding to the (0 0 2) and (1 0 0) diffractions of graphite, respectively. The porous carbon consists of a plenty of defect structures by KOH activation. The interlayer distance (d-spacing) of the graphite layer can be computed by the Bragg equation with the (0 0 2) diffraction peak. The d-spacing of PTPC is 0.398 nm, which is larger than that of graphite with 0.335 nm. As the widely accepted KOH activation mechanism,Reference Wang and Kaskel25 additional metallic K and K compounds produced by the activation process could insert into carbon layers and function in the PTPC materials, and thus d-spacing may be expanded. The large distance can function as cushioning for volume expansion during insertion/extraction of sodium ions.Reference Wang, Yu, Shi, Mao, Chen and Liu13 As shown in Fig. 3(d), Raman spectra of all samples have two strong peaks. The one is the D-bond of Raman characteristic absorption band at 1350 cm−1, attributing to the disorder or defects of the carbon structure. The other is the G-bond at 1600 cm−1 due to the vibration of the sp 2 hybridized carbon framework.Reference Qin and Chen3 The fitting result of the Raman spectra of PTPC-4, PTPC-5, and PTPC-7 is displayed in Figs. 3(d)–3(f), respectively. The ratio of the D band to the G band (I D/I G) is a significant parameter to judge the crystal degree of the carbon materials that I D/I G is susceptible to the change of microstructure, such as lattice defects, amorphous degrees, and heteroatom doping.Reference Ou, Yang, Zhang and Xi31 The I D/I G of PTPC-4, PTPC-5, and PTPC-7 are 2.42, 2.39, and 2.41, respectively, agreeing with the result of XRD and SAED. The as-achieved pores in carbon materials are largely at the expense of losing the carbon in the carbon matrix with the reaction of C and activator (e.g., KOH, K2CO3, K2O, and CO) proceeding, leading to the larger disorder degree of PTPC.
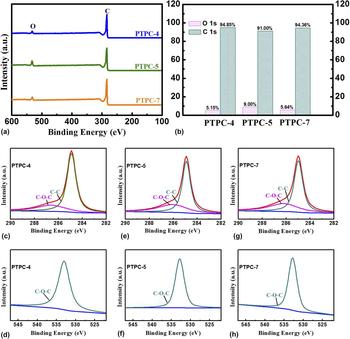
XPS was performed to ascertain their bonding configurations and the elements of carbon materials. As shown in the survey spectrum [Fig. 4(a)], there are two peaks of all samples. One is located at 284.3 eV corresponding to C 1s. The other is centered at 533 eV corresponding to O 1s.Reference Cai, Luo, Dong, Zhao, Xiao, Liang, Hu, Liu and Zheng20,Reference Gong, Li, Luo, Fu and Pan21 The O contents of PTPC-4, PTPC-5, and PTPC-7 are 5.15%, 9.00%, and 5.64%, respectively, as depicted in Fig. 4(b). It can be easily found that the highest O content of all samples is from PTPC-5, indicating that the content of O is not directly proportional to the concentration of KOH. The source of the O atom is introduced through the KOH activation process, but the O atom will be enormously lost at high temperatures. As a consequence, adding the concentrate of KOH properly introduces the O atom, and luxuriant KOH leads to the larger extent of activation proportional to the O atom losses because the activation reaction occurs in carbon rings.Reference Wang and Kaskel25 The high-resolution C 1s and O 1s spectra of PTPC-4, PTPC-5, and PTPC-7 are graphically depicted in Figs. 4(b)–4(j). The C 1s XPS spectra of all samples have been split into two peaks: sp 3 C–C and sp 2 C=C bond graphitic carbon at 284.3 eV and C–O bonds at 286.5 eV [Figs. 4(c), 4(e), and 4(h)].Reference Xiong, Li, Bai, Shan, Fan, Wu, Li and Lu32 From the results of fitting the O 1s spectra of all samples in Figs. 4(d), 4(f), and 4(j), only one peak located at 533 eV can be seen, corresponding to C–O.Reference Shi, Zhang, Fu and Gan33 The carbon structure only exists in C–O bonds, which is easy to fracture than the C=O bond at high temperature annealing, resulting in the low content of O atom. These oxygen-containing functional groups will introduce more active sites to the electrochemical reaction and enhance the polarity of PTPC to boost the transmit and storage of electrolytes, contributing to advance the electrochemical property of SIBs.Reference Deheryan, Cott, Mertens, Heyns and Vereecken34
(a) XPS survey spectra of PTPC-4, PTPC-5, and PTPC-7; (b) atomic percentages of O and C of PTPC-4, PTPC-5, and PTPC-7; high-resolution C 1s spectra of (c) PTPC-4, (e) PTPC-5, and (g) PTPC-7; and high-resolution O 1s spectra of (d) PTPC-4, (f) PTPC-5, and (h) PTPC-7.

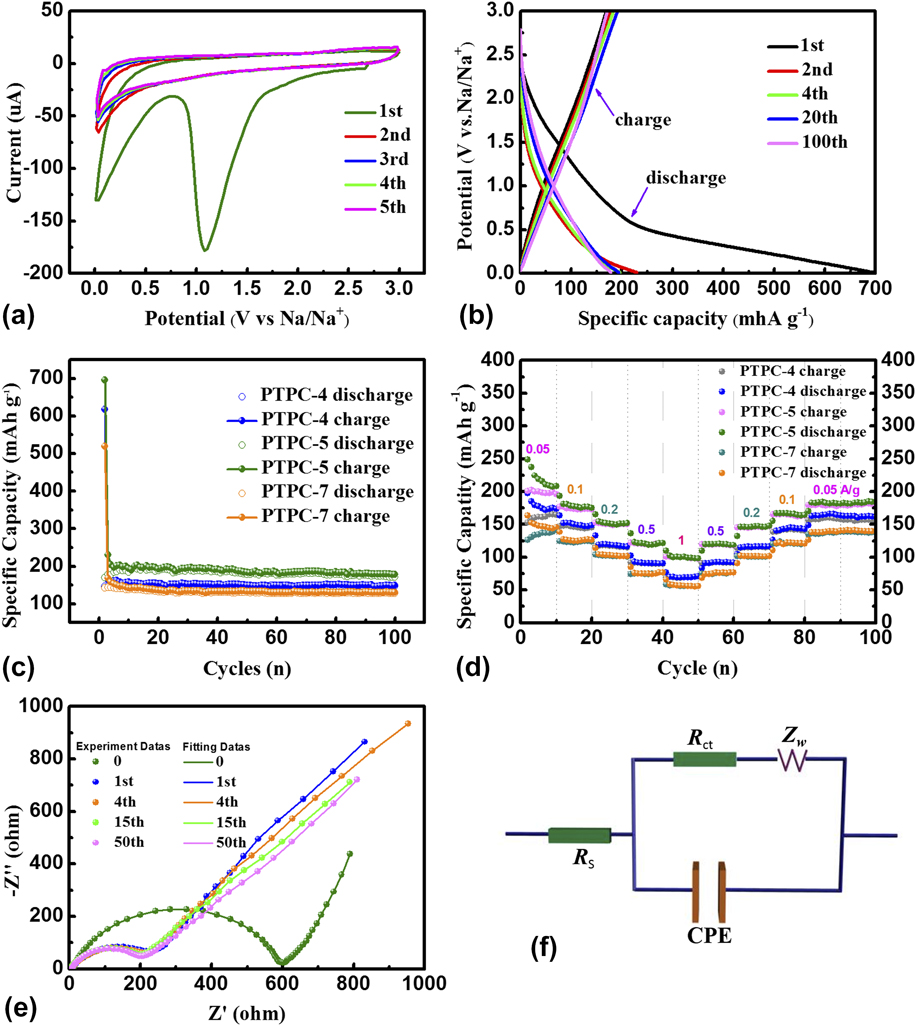
CR-2032 typed coin cells of all PTPC samples were assembled to test their electrochemical performance in the voltage of 0.01–3 V versus Na/Na+. In Fig. 5(a), the CV curves of PTPC-5 was acquired at a scanning rate of 0.1 mV/s to analyze the electrochemical reaction during charge/discharge cycles. In the first cycle, a shape peak at 1.1 V can be observed, owing to the irreversible reaction between the electrolyte and surface active functional groups and then forming the irreversible solid electrolyte interface (SEI).Reference Ou, Yang and Xi35 It is obvious that the reduction peak at 1.1 V only appears in the first cycle, implying the PTPC electrode with a low initial Coulombic efficiency. Moreover, a pair of redox peaks at a lower potential (about 0.1 V versus Na/Na+) can be discerned, in accordance with the insertion/extraction of Na+ into/from the porous carbon materials, analogous to the behavior of Li+ for carbon-based materials. As shown in Fig. 5(a), the reduction peak at 0.1 V is weak in the 2nd cycle related to that in the first cycle. The grievous irreversible insertion of Na+ results in high capacity fading in the first charge/discharge cycle. After the first cycle, the CV curves approximate to the rectangular shape in a wide voltage range, which also appears in porous carbon materials as the anode for LIBs. It can be seen that the PTPC electrode showed the approximate rectangular shape in a wide voltage range, revealing the existence of abundant pores associated with the high specific surface area. It promotes the electron transport and sodium ion diffusion in SIBs. This capacitance effect of porous carbon materials is similar to its CV curves for the supercapacitor.Reference Simon and Gogotsi36 Apart from the first cycle, the CV curves of PTPC-5 almost overlap, illustrating the stable electrochemical reaction of the PTPC electrode. The 1st, 2nd, 4th, 20th, and 100th charge/discharge profiles of the KOH-activated carbon electrode at a constant current density of 50 mA/g is reflected in Fig. 5(b). PTPC-5 reveals a high initial discharge specific capacity of 696 mA/g originating from high surface area, large carbon layer spacing, and oxygen-containing functional group. Sodium ion can be inserted into the interspaces between parallel carbon interlamination as well as the micropores. However, it should not be ignored that the initial charge specific capacity of the PTPC electrode decreases to 169 mA h/g, with the initial Coulombic efficiency of only 24%. It is a normal weakness that high-surface-area carbon materials deliver a low initial Coulombic efficiency, whether used for sodium storage, lithium storage, or other energy storage appliance. The reason can be due to the irreversible side reaction, irreversible Na+ insertion into the carbon network, and the SEI formed on the surface of the carbon electrode in the first cycle.Reference Wang, Yu, Shi, Mao, Chen and Liu13 In the next cycle, the increase of the Coulombic efficiency is extremely significant. In the 5th cycle, the charge and discharge capacity is 184 and 197 mA/g, respectively, delivering the Coulombic efficiency of 93.4%. The reversible specific capacity can be maintained at 179 mA h/g after 100 cycles, with the Coulombic efficiency of 96%, testifying that the PTPC electrode offers good reaction reversibility and structural stability for sodium storage. It is in good coincidence with the conclusions of CV curves mirrored. Figure 5(c) compares the cycle performance of PTPC-4, PTPC-5, and PTPC-7 at the current density of 50 mA/g for 100 cycles. Figure 5(c) reveals that the initial discharge capacities of PTPC-4 (618 mA h/g), PTPC-5 (696 mA h/g), and PTPC-7 (520 mA h/g) suffer high irreversible behavior with the charge capacity of only 147, 169, and 142 mA h/g, respectively. In the first 5 cycles, the capacity fade of all samples by the different concentration of KOH activation is obvious, particularly, the specific capacities of PTPC-4, PTPC-5, and PTPC-7 are only 185.9, 152.5, and 140.6 mA/g after 5 cycles, respectively. It indicates that all PTPC materials reveal larger capacity fading in the initial cycles, due to the larger irreversible reaction and SEI formation, which is consistent with the CV results with keen-edged irreversible reduce peaks in the first cycle. Fortunately, the capacity fading is puny after the 5th cycle, proving that the PTPC materials possess good stability. After 100 cycles, the reversible specific capacities of PTPC-4, PTPC-5, and PTPC-7 can be maintained at 149, 179, and 132 mA h/g, respectively, which exhibit high capacity retention. To demonstrate the remarkable structure stability of the PTPC, the rate capability of cells was tested at diverse current densities from 0.05 to 1 A/g. The rate capability of PTPC-4, PTPC-5, and PTPC-7 is exhibited in Fig. 5(d). The charge/discharge capacities of PTPC-5 under varied current densities, successively at 0.05, 0.1, 0.2, 0.5, and 1 A/g, deliver 197, 174, 148, 118, and 100 mA h/g, respectively. At the higher current density of 1 A/g, PTPC-4, PTPC-5, and PTPC-7 can be maintained at 70, 100, and 57 mA h/g. Meanwhile, when current density recovered to 0.05 A/g after cycling at high current densities, the reversible specific capacity of PTPC-4, PTPC-5, and PTPC-7 can be stabilized at 154, 181, and 137 mA h/g, compliant with the result of long cycles at 0.05 A/g. As a result, the PTPC-5 samples exhibit the bestrate capability, compared with the commercial activated carbon of high-surface-area (2050 m2/g) with only a capacity of 40 mA h/g at a high current density of 1 A/g.Reference Wang, Yu, Shi, Mao, Chen and Liu13 The storage Na performance improvement can be attributed to high specific surface areas, pore shapes, and PSDs, large interlayer distances, and interconnected structures.
(a) CV of PTPC-5 electrodes in various cycles at a scan rate of 0.1 mV/s, (b) galvanostatic charge/discharge profiles, and (c) cycle performance of PTPC-4, PTPC-5, and PTPC-7 electrodes at a current density of 0.05 A/g; (d) rate capability of PTPC-4, PTPC-5, and PTPC-7 electrodes at various current densities in the current density range of 0.05–1.00 A/g in a voltage range of 0.01–3.0 V (versus Na/Na+). (e) Nyquist plots and fitting data of PTPC-5 electrodes with an amplitude of 5.0 mV over the frequency ranging from 100 KHz to 0.01 Hz; (f) equivalent circuit used to fit EIS curves.

To understand improved cycling performance, the electrochemical impedance spectra (EIS) of the PTPC-5 sample was measured. As Fig. 5(e) reflected, the impedance spectra during various cycles consist of two portions, in which one is a semicircle in the middle–high frequency range and the other is a sloping straight line in the low frequency. The equivalent circuit in Fig. 5(f) was utilized to fit the Nyquist plots of PTPC-5. Normally, R s, representing the inherent resistance of the electrolyte and the active substances, and the contact resistance at the interface between the active electrode and the current collector, is described by the intercept with the X-axis in high frequency. R ct represents the charge transfer resistance, reflected by the semicircle in the middle frequency range. CPE represents the capacitance of the double layer and passivation film. The Warburg impedance (Z w), reflected by the sloping line in high to medium frequency, is dependent on the Na+ diffusion in the electrodes.Reference Liu, Jia, Sun, Cao, Chen, Zhu, Wu, Qiao and Xu37 The values of the R s, R ct, and Z w during various cycles are listed in Table S1. Before cycling, R ct is 585.9 Ω. The value of R ct decreases with the charge–discharge cycling from 189.1 Ω in the 1st cycle to 166.5 Ω in the 15th cycle, and the value of R ct increases to 171.5 Ω after 50 cycle. For high surface area porous carbons, the increase of R ct with cycling implies that sectional porous structure is disintegrated.Reference Wang, Yu, Shi, Mao, Chen and Liu13
As shown in Figs. 5(c) and 5(b), there is no inevitable connection between the specific capacity and specific surface area, conforming to the relevant report.Reference Ye, Yin, Xin and Guo30 The electrochemical property of porous carbon materials is bound up with several significant parameters: (i) the heteroatoms (such as O, P, S, B, and N), exist in carbon materials, can enhance the polarity of porous carbon electrode, thus contributing to adsorption of atoms and ion. Moreover, heteroatom doping contributes to the pseudocapacitance to improve the capacity of batteries. The heteroatom doping with destructing faultless carbon network is detrimental to the conductivity. (ii) Extent graphitization, determining the carbon materials conductivity, can be advanced by high temperature carbonization with “self-healing” of the graphite lattice. However, the carbon materials containing heteroatoms will be decomposed more easily, thereby lessening the content of heteroatoms at high temperature treatment to impair carrier concentrate. (iii) A larger surface area can support more active sites and storage space; however, it also can increase the side reactions and form more SEI on the activation material surface, thus leading to a high irreversibility, with a low Coulombic efficiency. (iv) Pore shape usually includes cylindrical, slits, conical, spherical, ink bottle, interstices, etc. (v) Pore size distribution: The micropores (<2 nm) provide large surface areas and storage space for the active substance to enhance capacity, and the mesopores (2–50 nm) serves as the aisle for the various kind of ions and electrons rapidly arriving at the active surface to accelerate reaction as well as the bridge between micropores and macropores. The macropores (>50 nm) resemble the ion-buffer reservoir to ensure that the electrode materials sufficiently penetrated into the electrolyte.Reference Qiao, Chen, Wang and Yuan38 Hence, the electrochemical performance of porous carbon materials may not be measured by only or a few independent factors. For all PTPC materials in this study, taking into consideration various factors, such as the transfer and storage of Na+, the transfer and permeation of the electrolyte, and all reaction (reversible and irreversible reaction) charge–discharge cycling, the PTPC-5 synthesized via the mass rate of 1:5 KOH activation exhibits the best performance as the anode for SIBs.
IV. CONCLUSION
In this work, for the first time fruit shells of the FSPT are introduced as the precursor of porous carbon by KOH-activation for SIBs. In a general view, the mechanisms of sodium storage in carbon include surface adsorption–desorption (physisorption and chemisorption) at high potential as well as the insertion/extraction of sodium at graphite interlayers at low potential. These PTPC samples possess high specific surface area up to 2275 m2/g and well-fabricated hierarchical porosity with a great deal of micropores and slight minor mesopores, leading to advance the electrochemical performance. As the anodes for SIBs, PTPC-5 can deliver a reversible specific capacity of 179 mA h/g at 50 mA/g after 100 cycles and a rate capability of 100 mA h/g at 1 A/g. Meanwhile, it should be noteworthy that the initial Coulombic efficiency is only about 25%. The initial capacity fading and reversible specific capacity are likely to be improved by suitably controlling the porous structure, using the appropriate binder and electrolyte and to improve the carbon materials. Hence, we believe that the PTPC may possess a promising prospect as the anode material for SIBs and even for other energy storage devices.
Supplementary Material
To view supplementary material for this article, please visit https://doi.org/10.1557/jmr.2017.452.
ACKNOWLEDGMENTS
This research was supported by the National Natural Science Foundation of China (51572194 and 51672189), The Key Project of the Tianjin Science & Technology Support Program (17YFZCGX00550), and Academic Innovation Funding of Tianjin Normal University (52XC1404).