

DISCUSSION POINT
▪ C-dots set an example that low-cost, non-toxic materials can effectively supplant highly engineered, yet toxic compounds in challenging applications.
Introduction
The emergence of carbogenic nanoparticles (otherwise known as C-dots) as a new class of photoluminescent (PL) nanoemitters has led to worth mentioning paradoxes about the fascinating story of molecular carbons. First, it is the realization that those nanoparticles are abundant in the planet (in the form of tiny graphitic fragments or combustion products), but they have gone unnoticed until recently. Chronologically, the first observation of C-dotsReference Xu, Ray, Gu, Ploehn, Gearheart, Raker and Scrivens1 falls close to the isolation of graphene by mechanical exfoliation,Reference Novoselov, Geim, Morozov, Jiang, Zhang, Dubonos, Grigorieva and Firsov2 but those ground-breaking advances only took place few years after the development of fullerenesReference Kroto, Heath, O’Brien, Curl and Smalley3 and carbon nanotubesReference Iijima4 (CNTs).
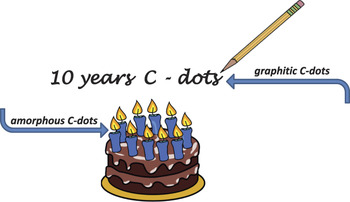
Second, it is the realistic perspective that those, oftentimes naturally or incidentally occurring nanoparticles (Fig. 1), can adequately replace highly engineered semiconductor emitters (commonly referred as heavy metal-based quantum dots) in demanding applications where extensive optical absorption, excitation wavelength-dependent emission, multiphonon excitation, and upconversion are needed. While ultra-long, defect-free graphene sheets are ideal for electronics, the exact opposite features, e.g., surface defects and fragmentation, seem to be a precondition for PL.
Cartoon demonstrating the generation of graphitic and amorphous C-dots from everyday activities.

Third, systematic efforts are currently directed to the development of well-defined C-dots, at a time where a rigorous definition of C-dots is notably absent in the literature. The problem relates to their great compositional diversity in terms of elemental content and graphitization degree. That being said, it is surprising that structurally very dissimilar C-dots share common patterns in their behavior (such as excitation-dependent emission and upconversion).
By virtue of their PL properties, C-dots are extensively explored in a broad range of technological applications including multicolor printing, bioimaging, optical sensors, photocatalysis, and solar cells.Reference Baker and Baker5–Reference Zhang, Zhang, Chen and Qu11 Compared to organic dyes and heavy metal-based quantum dots, they show minimal toxicity for humans and environment, low preparation cost, enhanced solubility in a variety of solvents, and improved chemical and colloidal stability.
The rapidly expanding body of experimental work centered on C-dots has been summarized in extensive reviews.Reference Baker and Baker5–Reference Zhang, Zhang, Chen and Qu11 In those studies, it appears that the terms C-dots, carbon quantum dots, carbon nanoparticles, carbogenic nanoparticles, quantum-sized carbon dots, graphene quantum dots are used rather loosely in the literature. Within this somewhat confusing framework, this review describes the properties of C-dots with respect to the structure of their cores that vary from highly graphitic all the way to completely amorphous. It should be noted that certain synthetic approaches tend to generate a mixture of carbogenic cores with inhomogeneous graphitization degree. A systematic classification on that basis can promote our understanding on their photoactive behavior and can contribute in further advancing their performance.
Discussion
Synthesis and structure
Highly graphitic C-dots
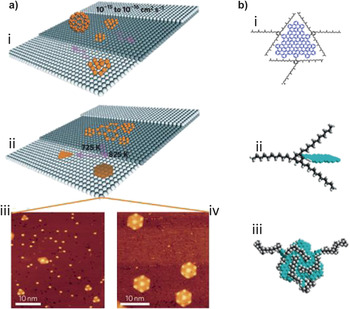
Disks of single-layer graphene (referred hereafter as graphene quantum dots or GQ-dots) are considered for the purposes of this review as a subgroup of the highly graphitic C-dots (gC-dots). Their technological importance stems from their supreme electronic conductivity and structural stability, even if graphene is broken down to the level of a few aromatic groups.Reference Ponomarenko, Schedin, Katsnelson, Yang, Hill, Novoselov and Geim12 GQ-dots are produced via hydrothermal etching of CNTs,Reference Yongqiang, Hongchang, Shuyan, Congqiang, Yuwu and Ting13 high resolution electron beam lithography,Reference Ponomarenko, Schedin, Katsnelson, Yang, Hill, Novoselov and Geim12 or oxygen plasma treatment of graphene.Reference Gokus, Nair, Bonetti, Böhmler, Lombardo, Novoselov, Geim, Ferrari and Hartschuh14 The cage opening of fullerenes is a rather unique process where the C60–Ru attractive forces induce surface vacancies in the Ru crystal to accommodate C60 particles. At elevated temperatures, the embedded molecules undergo diffusion and aggregation to form GQ-dotsReference Lu, Yeo, Gan, Wu and Loh15 [Fig. 2(a)].
(a) GQ-dots derived via cage opening of fullerenes: (i) adsorption of C60 molecules to the terraces of Ru crystals; (ii) temperature-dependent growth of GQ-dots with triangular and hexagonal equilibrium shape; (iii) and (iv) scanning tunneling microscope images of the triangular and hexagonal GQ-dots, respectively. (Reprinted with permission from Ref. 15, © 2011 Macmillan Publishers Ltd.) (b) GQ-dots produced by all-organic synthesis: (i) structure of QC-dots; (ii) bulky moieties chemically attached to the edges of the dot to enhance colloidal stability; (iii) an energy-minimized configuration of QC-dots. (Reprinted with permission from Ref. Reference Yan, Cui, Li and Li17, © 2010 American Chemical Society.)

All-organic, chemical approaches allow the synthesis of large, yet colloidal stable GQ-dots with excellent uniformity and size tuneability.Reference Yan, Cui and Li16,Reference Yan, Cui, Li and Li17 The synthetic strategy relies on the oxidation of polyethylene dendritic precursors to create graphene moieties that are further stabilized against self-aggregation by attaching bulky 2,4,6-trialkyl phenyl groups to their edgesReference Yan, Cui and Li16,Reference Yan, Cui, Li and Li17 [Fig. 2(b)].
Solvothermal approaches, such as the high pressure hydrothermal fragmentation of sucrose, afford the ring opening of the hydrolyzed compounds, formation of dehydrated furfural compounds, followed by hydronium-catalyzed polymerization and carbonization toward gC-dots.Reference Sadhanala, Khateia and Nanda18
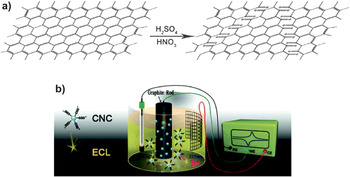
Alternatively, gC-dots were produced via laser ablation of graphite powders followed by HNO3 oxidation, but the resultant nanoparticles became photoactive only after surface passivation with amine-terminated oligomers or polymers.Reference Sun, Zhou, Lin, Wang, Fernando, Pathak, Meziani, Harruff, Wang, Wang, Luo, Yang, Kose, Chen, Veca and Xie19 gC-dots consisting of 1–3 layers are derived by chemical oxidation and cutting of micrometer-sized carbon fibers,Reference Peng, Gao, Gupta, Liu, Romero-Aburto, Ge, Song, Alemany, Zhan, Gao, Vithayathil, Kaipparettu, Marti, Hayashi, Zhu and Ajayan20 exfoliation and disintegration of graphitic flakes and CNTs,Reference Lin and Zhan21 and hydrothermal breakdown of preoxidized graphite sheets.Reference Pan, Zhang, Li and Wu22 A proposed mechanism for the chemical splitting of graphitic materials toward gC-dots is depicted in Fig. 3(a).
(a) A proposed mechanism for the production of gC-dots via oxidative splitting of a graphitic plane. (Reprinted with permission from Ref. Reference Peng, Gao, Gupta, Liu, Romero-Aburto, Ge, Song, Alemany, Zhan, Gao, Vithayathil, Kaipparettu, Marti, Hayashi, Zhu and Ajayan20, © 2012 American Chemical Society.) (b) A typical electrochemical cell used for the production of gC-dots. (Reprinted with permission from Ref. Reference Zheng, Chi, Dong, Lin and Wang24, © 2009 American Chemical Society.)

Another well-explored strategy relies on the electrochemical oxidation of CNTsReference Zhou, Booker, Li, Zhou, Sham, Sun and Ding23 or graphiteReference Zheng, Chi, Dong, Lin and Wang24–Reference Yu, Liu, Zhang and Cao26 that serve as the working electrodes in typical electrochemical cells [Fig. 3(b)]. Suitable electrolytes include ultrapure water,Reference Ming, Ma, Liu, Pan, Yu, Wang and Kang27 phosphate buffer solutions,Reference Zheng, Chi, Dong, Lin and Wang24 NaOH/ethanol,Reference Yu, Liu, Zhang and Cao26,Reference Ming, Ma, Liu, Pan, Yu, Wang and Kang27 ionic liquid–water mixtures,Reference Lu, Yang, Wang, Lim, Wang and Loh28 and acetonitrile.Reference Zhou, Booker, Li, Zhou, Sham, Sun and Ding23 Upon application of a scanning potential, extensive electrode exfoliation facilitates the release of gC-dots. Mechanistically, the electro-oxidation has been related to the formation of hydroxyl and oxygen radicals (produced by the electrolysis of the solvent) that attack the graphitic anode on defect and edge sites. This process allows the electrolyte to intercalate the graphitic layers, leading to electrode chipping and the formation of gC-dots.Reference Lu, Yang, Wang, Lim, Wang and Loh28
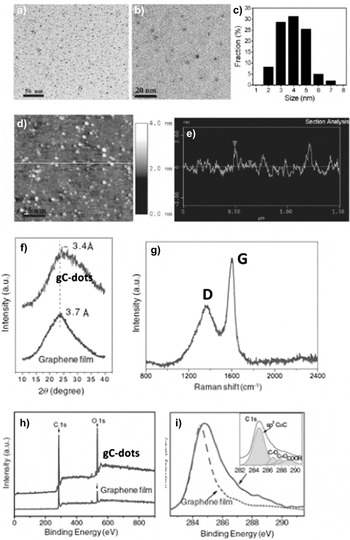
Based on this approach, green luminescent gC-dots were prepared using a graphene film as the working electrode, Pt wire as the counter electrode, Ag/AgCl as the reference electrode, and a phosphate buffer solution with pH 6.7 as the electrolyte (cycling voltammetry window ± 3V).Reference Li, Hu, Zhao, Shi, Deng, Hou and Qu29 Transmission electron microscopy (TEM) images suggest a narrow size distribution of gC-dots with diameters in the range 3–5 nm [Figs. 4(a)–4(c)], while their atomic force microscopy (AFM) topographic heights are lower than 2 nm consistent with the stacking of 1–3 graphene layers [Figs. 4(d) and 4(e)]. The x-ray diffraction (XRD) pattern of gC-dots [Fig. 4(f)] displays a broad peak at 3.4 Å compared with 3.7 Å for the parental graphene electrode. The Raman spectrum of gC-dots [Fig. 4(g)] is dominated by two peaks centered at 1365 and 1596 cm−1 that correspond to the D and G bands of the amorphous and graphitic carbon, respectively. The G peak is associated with the E2g vibration mode of the sp2-bonded carbon and the D peak is assigned to the A1g (zone-edge) breathing vibration phonon that becomes active only in close proximity to a sp3 defect.Reference Niyogi, Bekyarova, Itkis, Zhang, Shepperd, Hicks, Sprinkle, Berger, Lau, de Heer, Conrad and Haddon30 In a first approximation, the intensity ratio of the D over G band is an index of the disordered carbon; the value I D/I G = 0.5 found here implies a high graphitization degree for the gC-dots. X-ray photoelectron spectroscopy (XPS) patterns of gC-dots are compared with the initial graphene electrode in Fig. 4(h). Both spectra show the C1s peak at 284.8 eV and the O1s peak at 532 eV; however, the oxygen content is higher in gC-dots as a direct consequence of the electro-oxidation. The deconvolution of C1s peak of gC-dots [Fig. 4(i)] reveals the presence of C = C (284.8 eV), C–O (286.8 eV), C = O (287.8 eV) and COOH (289 eV) bonds due to hydroxyl, carbonyl and carboxylic acid groups, respectively. Those surface functionalities account for the remarkable colloidal stability of gC-dots.
gC-dots derived by electro-oxidation of a graphene film: (a) and (b) TEM images, (c) size distribution, (d) AFM image on a Si substrate, (e) The height profile along the line in (d), (f) XRD pattern compared to the initial graphene film, (g) Raman spectrum, (h) XPS spectra compared to the initial graphene film, (i) C 1s peak compared to paternal film; the inset refers to the C 1s of gC-dots. (Reprinted with permission from Ref. Reference Li, Hu, Zhao, Shi, Deng, Hou and Qu29, © 2011 John Wiley & Sons, Inc.)

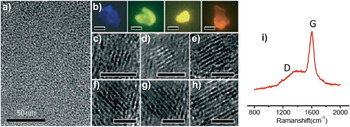
In another approach,Reference Li, He, Kang, Huang, Liu, Liu, Lian, Tsang, Yang and Lee25 alkali-assisted electrochemical synthesis of gC-dots was achieved using graphite rods as both anode and cathode and a mixture of NaOH/ethanol as the electrolyte. TEM images suggest that the diameters of the resultant nanoparticles fall within the range 1.2–3.8 nm [Fig. 5(a)]. Because the sample is a mixture of nanoparticles emitting at different wavelengths, it shows various emission colors under a fluorescent microscope [Fig. 5(b)]. High resolution TEM (HRTEM) images of gC-dots with different diameters [Figs. 5(c)–5(h)] show that they all have lattice spacing close to 0.32 nm, consistent with the (002) facet of graphite. The Raman spectrum [Fig. 5(i)] indicates an exceptionally low value for the ratio I D/I G, further confirming their highly graphitic structure.
gC-dots derived by alkali-assisted electro-oxidation of graphite rod: (a) TEM image, (b) fluorescent microscopy images with an excitation wavelength of 360 nm (scale bar: 50 mm), (c–h) HRTEM images of typical nanoparticles with different diameters (scale bar: 2 nm), (i) Raman spectrum. (Reprinted with permission from Ref. Reference Li, He, Kang, Huang, Liu, Liu, Lian, Tsang, Yang and Lee25, © 2010 John Wiley & Sons, Inc.)

Amorphous C-dots
Amorphous C-dots (aC-dots) can be derived by cracking of a non-graphitic carbon source following, for example, the ultrasonic treatment of a peroxidized suspension of active carbon,Reference Li, He, Liu, Yu, Kang and Lee31 but the most popular approaches rely on the pyrolytic treatment of carbon-rich molecular precursors. Those strategies are usually described as “bottom-up”; however, there is growing evidence to suggest that they tend to generate large carbon clusters that are eventually filtered out or broken down to the nanoscale via ultrasonication, oxidation, etc.
Within this general synthetic scheme, carbohydrates,Reference Peng and Travas-Sejdic32,Reference Zhou, He and Huang33 grass,Reference Liu, Tian, Wang, Zhang, Qin, Luo, Asiri, Al-Youbi and Sun34 gelatine,Reference Liang, Ma, Shi, Li and Yang35 orange juice,Reference Sahu, Behera, Maiti and Mohapatra36 soy milk,Reference Zhu, Zhai and Dong37 strawberry juice,Reference Huang, Lv, Zhou, Bao, Xu, Wang and Feng38 bovine albumin,Reference Zhang, Hao, Zhang, Zhang and Tang39 and polyacrylamideReference Gu, Wang, Zhang, Meng, Jia and Xi40 are hydrothermally converted to aC-dots. Similarly, hollowReference Wang, Huang, Long, Wang, Zhang, Zhu, Liang, Teng and Zheng41 and silica-supportedReference Liu, Wu, Liu, Koynov, Knoll and Li42 aC-dots are prepared by hydrothermal carbonization protocols, while aC-dots are derived by direct pyrolysis of coffee groundsReference Hsu, Shih, Lee and Chang43 or grass,Reference Krysmann, Kelarakis and Giannelis44 plasma-induced pyrolysis of eggs,Reference Wang, Wang and Chen45 barbeque char,Reference Wang, Sahu, Sonkar, Tackett, Sun, Liu, Maimaiti, Anilkumar and Sun46 and the plant soot.Reference Tan, Zhang, Tang, Song, Li, Wu, Wang, Lv, Liu and Maa47
Luminescent aC-dots with average particle size 3.5–5.5 nm were realized by microwave-mediated caramelization of polyethylene glycol (PEG) in the presence of water.Reference Jaiswal, Ghosh and Chattopadhyay48 HRTEM imaging of the aC-dots does not reveal any discernible lattice fringes, and the XRD pattern shows a broad peak at 4.1 Å, consistent with highly disordered carbon.
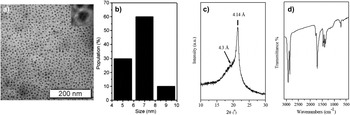
In another report, hydrophilic and organophilic aC-dots were synthesized by thermal treatment of diethylene glycolammonium citrate and octadecylammonium citrate, respectively.Reference Bourlinos, Stassinopoulos, Anglos, Zboril, Karakassides and Giannelis49 The TEM images of the organophilic aC-dots [Fig. 6(a)] display geometrically uniform nanoparticles with an average diameter of 7 nm [Fig. 6(b)]. The XRD pattern shows two reflection peaks; one centered at 4.3 Å attributed to highly disordered carbon and a sharp one at 4.14 Å consistent with the interchain distance of densely packed alkyl chains [Fig. 6(c)].
aC-dots derived by thermal treatment of octadecylammonium citrate salt: (a) TEM images, (b) size distribution, (c) XRD pattern, and (d) IR spectrum. (Reprinted with permission from Ref. Reference Bourlinos, Stassinopoulos, Anglos, Zboril, Karakassides and Giannelis49, © 2008 John Wiley & Sons, Inc.)

In situ formation of functional groups
Oftentimes, the Achilles's heel of the as-prepared C-dots is their relatively weak PL emission, but this behavior is generally improved by surface passivation. Common surface treatments include reflux with HNO3/H2SO4 to generate polar groups,Reference Kelarakis, Yoon, Sics, Somani, Hsiao and Chu50 reduction via sodium borohydrate,Reference Zheng, Wang, Long, Zhang, Huang and Zhu51 functionalization with PEG-based aminesReference Sun, Zhou, Lin, Wang, Fernando, Pathak, Meziani, Harruff, Wang, Wang, Luo, Yang, Kose, Chen, Veca and Xie19 or small molecules,Reference Qian, Ma, Shan, Shao, Zhou, Chen and Feng52 and coating with ZnO and ZnS.Reference Sun, Wang, Lu, Cao, Meziani, Luo, Gu and Veca53
Apart from those post-synthesis surface treatments, controlled carbonization approaches allow the formation of surface functionalities in situ with the synthesis of C-dots. To that end, the presence of an external corona shown in the inset in Fig. 6(a) points to the self-passivation of aC-dots pyrolytically derived by octadecylammonium citrate.Reference Bourlinos, Stassinopoulos, Anglos, Zboril, Karakassides and Giannelis49 The IR spectrum of the aC-dots [Fig. 6(d)] reveals characteristic absorption peaks due to the octadecyl chains tethered to the surface along with a strong peak at 1700 cm−1 suggestive of amide linkages.Reference Bourlinos, Stassinopoulos, Anglos, Zboril, Karakassides and Giannelis49
Similarly, water dispersible C-dots were prepared by controlled pyrolysis of dopamine,Reference Qu, Wang, Ren and Qu54 lauryl gallate,Reference Bourlinos, Karakassides, Kouloumpis, Gournis, Bakandritsos, Papagiannouli, Aloukos, Couris, Hola, Zboril, Krysmann and Giannelis55 polyethylenimine,Reference Shen, Zhang, Chen, Chen and Wang56 or a mixture of ethanolamine and citric acid.Reference Krysmann, Kelarakis, Dallas and Giannelis57,Reference Zhu, Meng, Wang, Zhang, Song, Jin, Zhang, Sun, Wang and Yang58 In a remarkably time-efficient modification of the method, microwave-assisted thermal treatment of an aqueous solution containing PEGReference Jaiswal, Ghosh and Chattopadhyay48 or a mixture of PEG and a saccharideReference Zhu, Wang, Li, Wang, Yang and Yang59 leads rapidly to self-passivated colloidal aC-dots. Ultrasmall aC-dots with quantum yield up to 47% have been derived by 1 min pyrolysis of anhydrous citric acid in N-(β-aminoethyl)-γ-aminopropyl methyldimethoxy silane.Reference Wang, Xie, Zhang, Liu and Zhang60 At the same time, sulfuric acid dehydration of the single molecule precursor g-butyrolactone gives rise to gC-dots,Reference Mirtchev, Henderson, Soheilnia, Yipc and Ozin61 while laser irradiation of suspended graphite powder in PEG or amines also leads to self-passivated luminescent C-dots with a diamond-like structure.Reference Hu, Niu, Sun, Yang, Zhao and Du62
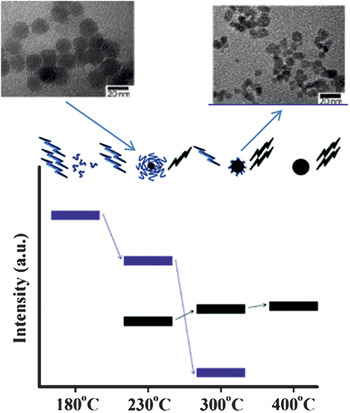
Chemical groups generated in situ during the synthesis of C-dots can impart additional functionalities. For example, the gC-dots derived by hydrothermal treatment of dopamineReference Qu, Wang, Ren and Qu54 bear distinctive catechol groups on their surface, offering a sensing platform for the detection of Fe(III) ions and dopamine. In another approach, the thermal treatment of a mixture of citric acid and ethanolamine results in the evolution of a series of photoactive materials.Reference Krysmann, Kelarakis, Dallas and Giannelis57 At the initial steps of pyrolysis, a crosslinked, highly viscous polymer network is formed due to intermolecular condensation and the subsequent formation of a precursor material that exhibits strong excitation-independent PL due to the presence of amide-containing fluorophores (blue groups in Fig. 7). Annealing at higher temperatures gives rise to aC-dots that show dual PL emission; an excitation-independent mode stemming from the amide fluorophores and an excitation-dependent mode directly related to the evolution of carbogenic core (black spheres in Fig. 7). Because the carbogenic core is formed at the expense of the organic fluorophores, the amide-driven mode diminishes as the pyrolysis proceeds (Fig. 7). The PL emission of the aC-dots is quenched in the presence of 3d metal ions Cr(III) and Co(II) due to a selective metal−fluorophore complexation.
Progressive evolution of a series of photoactive spices based on controlled pyrolysis of a mixture of CA and ethanolamine. (Reprinted with permission from Ref. Reference Krysmann, Kelarakis, Dallas and Giannelis57, © 2012 American Chemical Society.)

Heteroatoms and functional groups
Besides carbon and oxygen, several heteroatoms can be introduced to C-dots, altering the charge distribution and the electron-donating properties of the carbon atoms. To that end, N-rich C-dots are prepared by post-synthesis doping via NH3, hydrazine, or N2 treatments. Alternatively, the heteroatoms are incorporated to the nanoparticles directly from the starting materials; N-doped aC-dots are derived from soy milkReference Zhu, Zhai and Dong37 or plant soot.Reference Tan, Zhang, Tang, Song, Li, Wu, Wang, Lv, Liu and Maa47 The N-doped gC-dots derived electrolytically from graphite using tetrabutylammonium perchlorate in acetonitrile as the electrolyteReference Li, Zhao, Cheng, Hu, Shi, Dai and Qu63 exhibit significant electrocatalytic activity against the oxygen reduction reaction (ORR). The PL signal of gC-dots with 7% N content derived hydrothermally by strawberry juiceReference Huang, Lv, Zhou, Bao, Xu, Wang and Feng38 is quenched in the presence of Hg(II).
Nitrogen and sulfur co-doped C-dots (N,S-C-dots) (with total heteroatom content up to 10%) are realized via sulfuric acid carbonization of hair fibersReference Sun, Ban, Zhang, Wu, Zhang and Zhu64 or hydrothermal treatment of a mixture of citric acid and L-cysteine produceReference Dong, Pang, Yang, Guo, Shao, Chi, Ming Li and Yu65 (in which case C-dots exhibit an intriguing excitation-independent emission), or citric acid and thiourea.Reference Qu, Zheng, Du, Zhou, Zhang, Li, Tan, Zhao, Xie and Sun66 Controlled carbonization of a mixture of citric acid, ethylenediamine, and Mg(OH)2 leads to Mg-, N-co-doped C-dots with improved PL intensity suitable for in vivo cell imaging.Reference Li, Liu, Yang, Wang, Liu and Tian67 Iron oxide–doped aC-dotsReference Srivastava, Awasthi, Tripathi, Rai, Agarwal, Agrawal, Gajbhiye and Gupta68 and gadolinium-doped aC-dotsReference Bourlinos, Bakandritsos, Kouloumpis, Gournis, Krysmann, Giannelis, Polakova, Safarova, Holaf and Zboril69 (via pyrolysis of tris(hydroxymethyl)aminomethane, betaine hydrochloride, and gadopentetic acid) show great potential for multimodal magnetic resonance imaging simultaneously with fluorescent monitoring. Boron/nitrogen co-doped C-dots (via hydrothermal treatment of N-(4-hydroxyphenyl)glycine and boric acid) exhibit a reversible “switching on and off” PL mechanism in response to the presence of protoporphyrin and carcinogenic dyes.Reference Jahan, Mansoor, Naz, Lei and Kanwal70
Properties
Photoluminescence behavior
An ideally π-conjugated monolayer of pristine graphene has zero electronic bandgap and is not photoactive. However, finite-sized GQ-dots and nanosized graphitic fragments exhibit characteristic PL properties. It is exactly this intriguing behavior that actually allowed the first detection of C-dots as the fast moving fluorescent front during electrophoretic purification of arc-discharged soot containing single-walled CNTs.Reference Xu, Ray, Gu, Ploehn, Gearheart, Raker and Scrivens1 In principle, the PL behavior of C-dots has been attributed to quantum confinement effects and surface defects.
In semiconductors, quantum confinement occurs when the crystal size approaches the exciton Bohr radius and implies an inverse relationship between the bandgap and the crystal size. Theoretical studies in GQ-dots suggest that the energy gap between the highest occupied molecular orbital (HUMO) and the lowest unoccupied molecular orbital (LUMO) decreases with the number of fused aromatic rings from 7 eV for a single benzene ring to 2 eV for 20 π-conjugated aromatic rings.Reference Eda, Lin, Mattevi, Yamaguchi, Chen, Chen, Chen and Chhowalla71
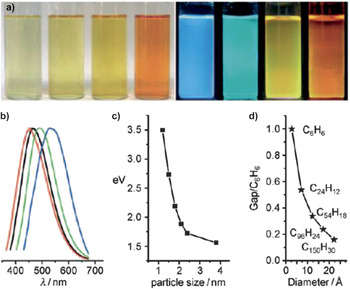
A series of differently sized gC-dots were synthesized by alkali-assisted electro-oxidation of graphiteReference Li, He, Kang, Huang, Liu, Liu, Lian, Tsang, Yang and Lee25 and the optical images in water (under white and UV light) are shown in Fig. 8(a). Their corresponding PL spectra, plotted in Fig. 8(b), critically depend upon the size of the gC-dots [Fig. 8(c)].Theoretical calculations on the size dependence of the HUMO–LUMO energy gap [Fig. 8(d)] indicate that nanoparticles with diameter 1.4–2.2 nm have gap energy in the visible region, in agreement with the experimental observations. Hydrogen plasma treatment (to eliminate the surface oxygen) leaves their PL spectra intact, thus confirming the prominent role of the quantum confinement to the photophysical properties in highly graphitic nanoparticles.
(a) Typical sized gC-dots (derived from alkali-assisted electro-oxidation) optical images illuminated under white (left; daylight lamp) and UV light (right; 365 nm), (b) PL spectra of typical sized gC-dots: the red, black, green, and blue lines are the PL spectra for blue-, green-, yellow-, and red-emission gC-dots, respectively, (c) relationship between the gC-dot size and the PL properties, (d) HOMO–LUMO gap dependence on the size of the graphene fragment. (Reprinted with permission from Ref. Reference Li, He, Kang, Huang, Liu, Liu, Lian, Tsang, Yang and Lee25, © 2010 John Wiley & Sons, Inc.)

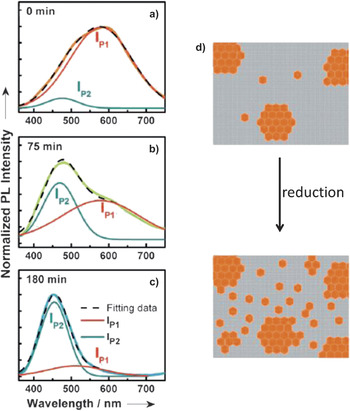
At the same time, several aspects of the PL behavior in C-dots cannot be explained in terms of quantum confinement alone. Specifically, the PL spectra of a graphite oxide (GO) thin film can be deconvoluted into two Gaussian bands [I p1 and I p2 in Figs. 9(a)–9(c)], indicating the parallel action of two distinct photophysical contributions.Reference Chien, Li, Lai, Yeh, Chen, Chen, Chen, Chen, Nemoto, Isoda, Chen, Fujita, Eda, Yamaguchi, Chhowalla and Chen72 Gradual chemical reduction of GO sheets preferentially favors the removal of oxygen atoms positioned far from a π-conjugated domain. This results in the formation of small and isolated sp2 islands, rather than the expansion of the pre-existing sp2 clusters [Fig. 9(d)]. During the stepwise chemical reduction toward a graphene film, the relative intensity of I p2 systematically increases with time and is, therefore, attributed to the intrinsic PL of graphene fragments. Moreover, I p2 shifts to lower wavelengths, consistent with quantum confinement effects originating from the non-percolated small sp2 domains. At the same time, I p1 monotonously decreases with reduction time due to the gradual elimination of the surface defects.
Deconvolution of PL spectra of GO at various reduction times t red: (a) 0 min, (b) 75 min, (c) 180 min. (d) Schematic depiction of the evolution of sp2 islands via chemical reduction of GO. (Reprinted with permission from Ref. Reference Chien, Li, Lai, Yeh, Chen, Chen, Chen, Chen, Nemoto, Isoda, Chen, Fujita, Eda, Yamaguchi, Chhowalla and Chen72, © 2012 John Wiley & Sons, Inc.)

It has been proposed that photogenerated electron and holes pairs are induced within surface traps in C-dots and are stabilized by the passivation agents.Reference Cao, Meziani, Sahu and Sun73 This approach is in tandem with the observation that PL intensity in C-dots is oftentimes responsive to external stimuli.Reference Bourlinos, Karakassides, Kouloumpis, Gournis, Bakandritsos, Papagiannouli, Aloukos, Couris, Hola, Zboril, Krysmann and Giannelis55,Reference Shen, Zhang, Chen, Chen and Wang56 It has been supported that defects in graphene sheets involving sp3 carbons are structurally no different from carbon atoms placed on the surface of carbogenic nanoparticles and this similarity accounts for the fact that very different types of C-dots share common patterns to their PL behavior.Reference Cao, Meziani, Sahu and Sun73
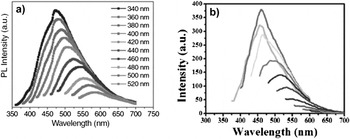
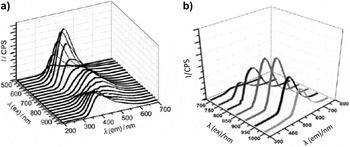
In principle, both aC-dots and gC-dots (as well as their heteroatoms doped counterparts) exhibit excitation wavelength-dependent emission (Fig. 10); as the excitation wavelength increases, the emission peak is displaced to longer wavelengths and a weaker signal is recorded. Upconversion occurs when the emitted radiation has higher energy compared to the incident photons and has also been observed for both gC-dotsReference Li, He, Kang, Huang, Liu, Liu, Lian, Tsang, Yang and Lee25 and aC-dotsReference Li, He, Liu, Huang, Lian, Lee and Kang74 (Fig. 11). The effect is explained in terms of sequential absorption of two or more photons and the formation of metastable, long-lived intermediate states.Reference Haase and Schafer75 Upconversion is a nonlinear optical phenomenon that holds great promise for diagnostics, photodynamic therapy and energy harvest.
The excitation wavelength-dependent PL spectra of aqueous dispersions of (a) gC-dots (via electro-oxidation of a graphene film). (Reprinted with permission from Ref. Reference Li, Hu, Zhao, Shi, Deng, Hou and Qu29, © 2011 John Wiley & Sons, Inc.) (b) aC-dots (via pyrolytic treatment of crude biomass). The excitation wavelength was varied from 350 to 600 nm with a fixed increment of 25 nm. (Reprinted with permission from Ref. Reference Krysmann, Kelarakis and Giannelis44, © 2012 Royal Society of Chemistry.)

Upconversion PL spectra of aqueous dispersions of (a) gC-dots (via alkali-assisted electro-oxidation). (Reprinted with permission from Ref. Reference Li, He, Kang, Huang, Liu, Liu, Lian, Tsang, Yang and Lee25, © 2010 John Wiley & Sons, Inc.) (b) aC-dots (via ultrasonic treatment of glucose). (Reprinted with permission from Ref. Reference Li, He, Liu, Huang, Lian, Lee and Kang74, © 2011 Elsevier.)

Nontoxic character
By virtue of their PL nature, the cell uptake and biodistribution of C-dots can be easily monitored. C-dots exhibit excellent photochemical stability and multiphoton excitation, enabling deeper in vivo imaging with minimal tissue damage.Reference Cao, Wang, Meziani, Lu, Wang, Luo, Lin, Harruff, Veca, Murray, Xie and Sun76,Reference Yang, Cao, Luo, Lu, Wang, Wang, Meziani, Liu, Qi and Sun77 In particular, gC-dots undergo two-photon absorption with the pulsed laser in the near infrared to cause emission in the visible and the absorption cross-section is comparable to the best-performing nanoemitters reported in the literature.Reference Cao, Wang, Meziani, Lu, Wang, Luo, Lin, Harruff, Veca, Murray, Xie and Sun76
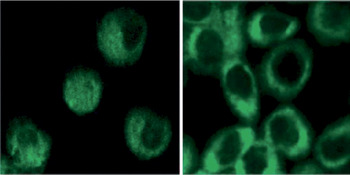
Experimental evidence suggests that gC-dots and aC-dots are preferentially localized in the cytoplasm rather than the cell nucleusReference Cao, Wang, Meziani, Lu, Wang, Luo, Lin, Harruff, Veca, Murray, Xie and Sun76–Reference Zhang, Wu, Wang, He, Li and Feng79 (Fig. 12). Intravenously injected gC-dots (derived from laser ablation and passivated with ZnS and PEG diamine) in mice for whole body circulation follow the urine excretion pathway, after being temporarily accumulated to kidneys. Following interdermal injection into the front extremity, the gC-dots were seen to migrate along the arm to the axillary lymph node, albeit in a somewhat slower speed compared with heavy metal quantum dots.Reference Yang, Cao, Luo, Lu, Wang, Wang, Meziani, Liu, Qi and Sun77
Two-photon luminescence image of human breast cancer MCF-7 cells with internalized C-dots. (Reprinted with permission from Ref. Reference Cao, Wang, Meziani, Lu, Wang, Luo, Lin, Harruff, Veca, Murray, Xie and Sun76, © 2007 American Chemical Society.)

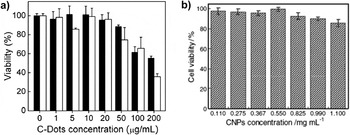
Moreover, C-dots are generally nontoxic, possessing an overwhelming advantage over semiconductor quantum dots. For example, when 4,7,10-trioxa-1,13-tridecanediamine (TTDDA)-passivated gC-dots were incubatedReference Zhang, Wu, Wang, He, Li and Feng79 at concentration levels below 500 mg mL−1 with HeLa cells for 24 h, the cell viability exceeds 90%. Similarly, addition of gC-dots to the culture medium containing human kidney cells did not induce significant cytotoxicity,Reference Zhao, Zhang, Huang, Peng, Zhang and Pang80 while no obvious organ damage was observed for mice treated with carboxylated gC-dots.Reference Nurunnabi, Khatun, Huh, Park, Lee, Cho and Lee81 PEG-passivated gC-dots at high concentrations are relatively toxic to cancer cells, but this effect stems from the passivation agent itself rather than the carbogenic coreReference Yang, Wang, Wang, Lu, Luo, Cao, Meziani, Liu, Liu, Chen, Huang and Sun82 [Fig. 13(a)]. Moreover, a series of studies indicate that incubation with aC-dots has a minimal impact to the viability of HeLa cells (incubation period 24 h and 74 h)Reference Shen, Zhang, Chen, Chen and Wang56,Reference Ding, Cheng, Ma, Kong and Xiong78 [Fig. 13(b)] and to HT 29 cells (incubation period 24 h).Reference Jaiswal, Ghosh and Chattopadhyay48
Viability of (a) human cancer cells incubated with PEG1500-passivated gC-dots (black columns) compared with the passivation agent PEG1500 (white columns). (Reprinted with permission from Ref. Reference Yang, Wang, Wang, Lu, Luo, Cao, Meziani, Liu, Liu, Chen, Huang and Sun82, © 2009 American Chemical Society.) (b) HeLa cells incubated for 24 h with polyethylenimine-derived aC-dots. (Reprinted with permission from Ref. Reference Shen, Zhang, Chen, Chen and Wang56, © 2013 Elsevier.)

Energy applications
Catalytic activity
Amorphous carbon/silica nanocomposites with a high density of sulfonic groups function as environmentally benign, acid solid state catalysts. In particular, sulfonated aC-dots/SiO2 catalyze the dimerization of a-methylstyrene,Reference Nakajima, Okamura, Kondo, Domen, Tatsumi, Hayashi and Hara83 esterification of acetic acid with n-butanol,Reference Liu, Chen, Yao, Lu, Zhang and Liu84 and degradation of cellulose into glucose.Reference Van de Vyver, Peng, Geboers, Schepers, de Clippel, Gommes, Goderis, Jacobs and Sels85
Photogenerated electrons in gold or platinum coated C-dots are trapped in the metallic interface and can catalyze challenging photoreductions. Specifically, gold-doped aC-dots and gC-dots are effective catalysts for the conversion of carbon dioxide into formic acidReference Wang, Sahu, Sonkar, Tackett, Sun, Liu, Maimaiti, Anilkumar and Sun46 and the photocatalytic splitting of water to hydrogen.Reference Cao, Sahu, Anilkumar, Bunker, Xu, Shiral Fernando, Wang, Guliants, Tackett and Sun86
Highly PL C-dots anchored to TiO2 extend the range of visible spectrum harnessed by the nanoparticles. Upon illumination of gC-dot/TiO2 or gC-dot/SiO2 hybrid catalysts, the upconverted radiation excites TiO2 or SiO2 to generate electron/hole pairs. The electron/hole pairs react with absorbed oxidants (O2 or OH-) to produce active oxygen radicals, which expedite the decomposition of dyes.Reference Li, He, Kang, Huang, Liu, Liu, Lian, Tsang, Yang and Lee25 The electrons are shuttled freely within the carbon network and are injected to TiO2 or SiO2 (the relative position of the band edge permits such an electron injection), inducing and stabilizing charge separation. Similarly, porous gC-dot/SiO2 nanocomposites show catalytic capability for photoenhanced hydrocarbon selective oxidation.Reference Han, Han, Huang, Zhang, Zhang, Liu, Liu and Kang87
In analogy, gC-dot/Fe2O3 and gC-dot/ZnO compositesReference Zhang, Ming, Lian, Huang, Li, Zhang, Liu, Kang and Lee88,Reference Yu, Zhang, Li, Huang, Liu, Ming and Kang89 exhibit enhanced photocatalytic activity for the degradation of toxic gases under visible light. The overall effect is attributed to three factors: upconversion, the excellent electron-donating capability of gC-dots, and the strong π–π interactions between the aromatic rings of the pollutants and the sp2 domains of the nanoparticles.
Catalysts for fuel cells
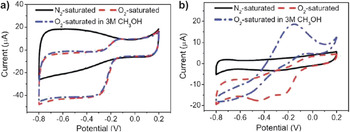
Inexpensive N-doped carbogenic nanomaterials catalyze the, otherwise slow, ORR that remains a major challenge for the advancement of fuel cells. The cyclic voltammograms (CV) for ORR at N-doped aC-dot electrodesReference Zhu, Zhai and Dong37 (in O2-saturated KOH solution) revealed a cathodic reduction peak at around 0.35 V, although the effect was rather limited compared to standard Pt/C catalysts. At the same time, the CV at N-doped gC-dots electrodesReference Li, Zhao, Cheng, Hu, Shi, Dai and Qu63 shows a ORR onset potential at −0.16 V with a reduction peak at −0.27 [Fig. 14(a)], and the catalytic effect is comparable to that achieved by commercial Pt/C catalysts [Fig. 14(b)]. Significantly, N-doped gC-dots fully retained their catalytic activity in the presence of methanol, while metal-based catalysts fail to do so. In other words, N-doped gC-dots exhibit unprecedented tolerance against methanol crossover and can contribute toward the advancement and commercialization of fuel cells. It is conceivable that incorporation of N atoms to carbogenic materials creates charged sites that enhance the adsorption of O2. The introduction of nitrogen not only increases the charge mobility of the graphitic lattice, but also lowers the energy band gap. Theoretical calculations suggest that the maximum charge mobility is encountered in carbon atoms with pyrrole nitrogen-containing groups at the edges of graphene planes and those with pyrrole nitrogen atoms in combination with ‘valley’ nitrogen atoms.Reference Strelko, Kuts and Thrower90
Cyclic voltammograms (reference electrode Ag/AgCl) for oxygen reduction reaction of (a) N-doped gC-dots and (b) commercial Pt/C electrodes in N2- and O2-saturated 0.1M KOH and O2-saturated 3M in CH3OH. (Reprinted with permission from Ref. Reference Li, Zhao, Cheng, Hu, Shi, Dai and Qu63, © 2012 American Chemical Society.)

Solar cells
C-dots as the sensitizer
Owing to their unique PL properties, C-dots act as sensitizers in solar cells, effectively replacing standard ruthenium complexes-based dyes. In a proof of concept demonstration, colloidal stable GQ-dots containing 168 π-conjugated carbon atoms (derived via all-organic chemistry) were shown to exhibit molar extinction coefficient εm = 1.0 × 10⁵ M−1 cm−1, nearly an order of magnitude larger than the metal complexes commonly used in similar applications. Moreover, the absorption spectra include the 900 nm limit, the optimal energy threshold that enables the thermodynamic limit of energy conversion efficiency in photovoltaic cells.Reference Yan, Cui, Li and Li17 The GQ-dots were used to stain a nanocrystalline TiO2 film for a solar cell assembly where they induced a significant sensitizing effect.Reference Yan, Cui, Li and Li17
In another study,Reference Mirtchev, Henderson, Soheilnia, Yipc and Ozin61 the gC-dots (derived by dehydration g-butyrolactone) sensitized solar cell show a short-circuit current density (J sc) of 0.53 mA cm−2 and an open-circuit voltage (V oc) of 0.38 V with a fill factor (FF) of 0.64, for a power conversion efficiency of 0.13%. Indium tin oxide photoelectrodes spin-coated with aC-dots generated reasonable photocurrents, but their pegylated analogs resulted in twice higher intensity.Reference Shen, Zhu, Yang, Zong, Zhang and Li91
gC-dots as electron acceptors
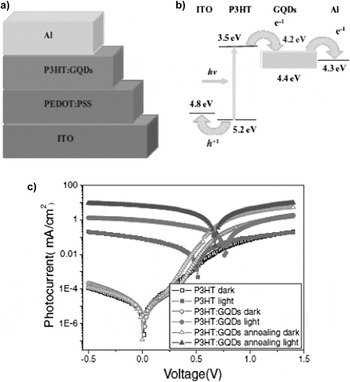
In organic photovoltaic cells, GQ-dots improve the electron acceptor capability and, thereby, the power efficiency. To that end, a solar cell assembly of ITO/PEDOT:PSS/P3HT:GQ-dots/Al [ITO, PEDOT, PSS, and P3HT stand for indium tin oxide, poly(3,4-ethylenedioxythiophene), poly(styrenesulfonate), and poly(3-hexylthiophene), respectively] outperforms (more than 2 orders of magnitude improvement) its GQ-dot free analog in terms of power conversion efficiency and short-circuit current. Incorporation of GQ-dots not only affords extensive p–n interfaces for charge separation, but also facilitates the transport of charge carriers within their highly conductive infrastructureReference Li, Hu, Zhao, Shi, Deng, Hou and Qu29 (Fig. 15).
Schematic (a) and energy band (b) diagrams of the ITO/PEDOT:PSS/P3HT:GQDs/Al device. (c) J–V characteristic curves for the ITO/PEDOT:PSS/P3HT/Al, ITO/PEDOT:PSS/P3HT:GQDs/Al and ITO/PEDOT:PSS/P3HT: GQDs/Al devices after annealing at 140 °C for 10 min. (Reprinted with permission from Ref. Reference Li, Hu, Zhao, Shi, Deng, Hou and Qu29, © 2011 John Wiley & Sons, Inc.)

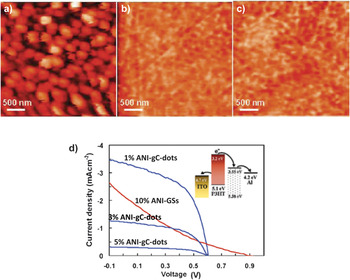
In another demonstration,Reference Gupta, Chaudhary, Srivastava, Sharma, Bhardwaj and Chand92 P3HT/ANI-gC-dot (ANI-gC-dot stands for aniline functionalized gC-dot) based organic solar cells show improved efficiency compared to P3HT/ANI-GSs (ANI-GS stands for aniline functionalized graphene sheets). The effect points out to the improved morphology of the gC-dot-based film that results in enhanced exciton migration to the donor/acceptor interface and lower internal resistance. In particular, gC-dot-based films show nanoscale phase separation and fine structural elements, as opposed to GS-based film that displays large domains (about 100–200 nm in diameter) indicating phase separation at a scale much larger than the diffusion length of excitons (10 nm) (Fig. 16).
AFM images of (a) P3HT/ANI-gC-dots; (b) P3HT/ANI-gC-dots; (c) MEH-PPV/MB-gC-dots; (d) J–V curves of the photovoltaic devices based on ANI-gC-dots with different nanoparticle content compared to the best performing ANI-GS based counterpart annealed at 160 °C for 10 min, in AM 1.5G 100 mW illumination. (Reprinted with permission from Ref. Reference Gupta, Chaudhary, Srivastava, Sharma, Bhardwaj and Chand92, © 2011 American Chemical Society.)

A poly(3-hexylthiophene):[6,6]-phenyl-C61-butyric acid methyl ester based bulk heterojunction solar cell achieved improved power conversion efficiency by 12% due to the integration of a luminescence downshifting layer containing gC-dots (derived hydrothermally and protected against self-aggregation).Reference Huang, Zhong, Rong, Zhou, Chen and Zhang93
An ultrasensitive, all carbon photodetector has been constructed by selective deposition of a layer of GQ-dots to graphene sheets.Reference Cheng, Weng, Lu, Tan, Chen and Chen94 The remarkable photocurrent responsivity and detectivity observed for the all carbon detector have been attributed to the synergy of three parameters: the large optical absorptivity of GQ-dots, the efficient separation of photogenerated electron–hole pairs due to the band alignment across the GQ-dots/graphene sheet interface, and the highly conductive channels of graphene.
Conclusions
C-dots demonstrate significant potential as low-cost photoluminescence nanoemitters with tuneable structure and functionalities. Graphitic and amorphous of C-dots share common characteristics such as nontoxic nature, excitation wavelength-dependent emission, upconversion, while their PL intensity is selectively quenched in the presence of certain compounds. Moreover, aC-dots/SiO2 densely covered with sulfonic groups are green, solid acid catalysts, while gC-dots/SiO2 (and their TiO2, SiO2, Fe2O3, ZnO based counterparts) exhibit enhanced photocatalytic activity for the degradation of toxic compounds under visible light. Au- or Pt-coated aC-dots and gC-dots function as electron reservoirs, catalyzing challenging photoreductions. In fuel cells, N-doped gC-dots are promising methanol tolerant electrocatalysts for the ORR. In solar cells, gC-dots induce significant sensitizing effects and they also function as electron acceptors, improving the power conversion efficiency.