I. INTRODUCTION
During the last few years, perovskite manganites have attracted broad research interest because of their unusual magnetic and transport characteristics. The magnetic and resistive behavior in the colossal magnetoresistance compoundsReference Hasanian, Shah, Akhtar and Nadeem1, Reference Ramirez, Cheong and Schiffer2 is well known to be a sensitive function of the lattice strain produced, for example, by doping on various sites.Reference Tokunaga, Miura, Tomioka and Tokura3–Reference Mahesh and Itoh5 The effects of substituting on the Mn sites by other transition elements are further knownReference Hasanain, Shah, Mumtaz, Akhtar and Nadeem6 to affect the properties because of the changes produced in the average electron concentration and the shifts in the positions of the e g and t g subbands. A number of studiesReference Hasanain, Shah, Mumtaz, Akhtar and Nadeem6–Reference Chechersky, Nath, Isaac, Franck, Ghosh, Ju and Greene10 have been conducted on the effects of replacement of Mn by various transition elements, which have included both global and local measurements such as Mossbauer spectroscopy. The case of Fe is particularly interesting because of the large extent to which it can replace Mn. It is apparent from various studies that the Fe atom substitutes for Mn in the +3 state and does not take part in the double exchange (DE) process, thereby leading to a lowering of T C. It has also been shownReference Chechersky, Nath, Isaac, Franck, Ghosh, Ju and Greene10, Reference Teresa, Ibarra, Algarabel, Ritter, Marquina, Blasco, Garcia, del Moral and Arnold11 that Fe and Co doping leads to the formation of locally antiferromagnetically coupled spins or clusters with localized spin excitations. Several recent studies including those by neutron scattering have shown that the onset of the paramagnetic (PM) to ferromagnetic (FM) transition is accompanied by a divergence of the correlation length, signaling the growth of the infinite correlation and an inhomogeneousReference Borges, Ott, Thomas, Skumryev, Coey, Arnaudas and Ranno12 type of FM transition. It can therefore be expected that the effect of the Fe doping, which results in the formation of clusters and suppression of conductivity, would also be reflected in the effective activation energies for hopping transport, both above and below the temperature corresponding to the resistivity maximum T p. As shown by various studies on colossal Magnetoresistive (CMR) compounds,Reference Mott13–Reference Kagan, Kugel and Khomskii21 the resistive behavior both above and below T p can be described in terms of an activated conductivity, albeit with a magnetization-dependent activation barrier for T < T C.
We have conducted a study of the magnetic and transport properties in a series of Fe-doped CMR compounds of compositions La0.65Ca0.35Mn1xFexO3, (0.01 ≤ x ≤ 0.10). Our studies are particularly focused on the effects at low fields, H ≤ 1100 Oe, as compared with previous studies in ac susceptibility characterization. This field range is also of interest from the point of view of potential applications. Using the technique of ac susceptibility, we have studied the development of spin correlations and their magnetic field dependence in our system. We focus particularly on the magnetic transition and the effects related to short-range ordering. In general, the out-of-phase part of the ac response,Reference White22 which contains much useful information about the loss mechanisms at and away from a transition, has been studied. It is the objective of this work to investigate both the in-phase and out-of-phase ac responses of this composition, as a function of temperature and field and at fixed frequency (f = 311Hz). We relate the temperature and the field dependence of the susceptibilities to the development of magnetic order and the growth or suppression of fluctuations and also relate these observations to the changes in the resistivity.
II. EXPERIMENTAL
All samples reported in this study were synthesized by standard solid state reaction procedure. After the final heat treatment, x-ray diffraction (XRD) measurements were carried out to confirm that single phase materials had been prepared.Reference Hasanain, Shah, Mumtaz, Akhtar and Nadeem6 We did not observe any appreciable change in the lattice parameters with increasing Fe concentration. The electrical resistivity was measured by using the standard four-probe technique using an air drying conducting silver pasteReference Aslam, Shah, Ali, Hasanain, Akhtar and Nadeem20 in the temperature range of 4–300 K. AC susceptibility studies were conducted using a self-made ac probe with a split secondary (astatically wound) and a commercial lock-in amplifier. The ac susceptibilities were measured using the digital signal processing lock-in amplifier (SR830; Stanford Research Systems, Sunnyvale, CA). The sample could be moved between the two secondary coils that enabled a careful cancellation of the background. The uncompensated coil background was temperature dependent but was cancelled to a good accuracy by making measurement in each of the two counter wound coils and taking their difference.Reference Goldfarb, Lelental, Thompson and Hein23 The susceptometer had been tested for linearity with ac field amplitudes and frequency-independent behavior in our range of studies (h ac = 5Oe, f = 311 Hz, and 0 < H dc < 1100 Oe). DC magnetic fields were obtained from a homemade solenoid magnet with the dc field direction parallel to the direction of ac field. For some selected samples, we apply a dc field up to 1100 Oe. DC magnetic fields were obtained from a homemade solenoid magnet with the dc field direction parallel to the direction of ac field. Studies with superposed dc fields were conducted during warm up after the sample had been cooled down to 81 K.
III. RESULTS AND DISCUSSION
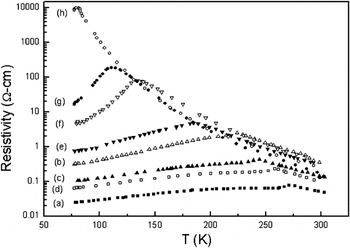
All the samples studied here showed a metal–insulator transition with a characteristic peak in the resistivity at the transition temperature T p. FM transition temperatures T C will be shown to be very close to these insulator–metal transition temperatures. Figure 1 shows the dependence of resistivity as a function of temperature for the La0.65Ca0.35Mn1-xFexO3 (x = 0.0–0.10) samples. It is clearly seen that transition temperatures are systematically lowered and that peak resistivity values increase with the increase in Fe concentration. This is a very important investigation in this system that doping with Fe tends to result in a weakening of DE interaction, thereby lowering T C. This effect is understood to be primarily due to the Fe ions being in the +3 state and hence not participating in the DE process. The resistivity changes on doping are observed by us to be gradual and linear below 4% Fe concentration, while above this concentration, changes are very large. Note that the resistivity is plotted on a log scale for convenience. We note that the substitution of 10% Fe for Mn leads to a change of almost six orders of magnitude in the peak resistivity. Between 8 and 10% concentration, the peak resistivity changes by almost two orders of magnitude while the critical temperature decreases by 30 K. The very pronounced change in the resistivity for x > 8% is a very important result, which suggests that the disorder exceeds a critical threshold beyond 8%. It might be possible that the threshold is connected with the percolation paths in the doped materials. The transport results shown above clearly demonstrate that the partial replacement of Mn by Fe favors insulating and anti-ferromagnetic (AFM) behavior, opposing the effect of double exchange. Since Fe doping is the direct replacement of Mn+3 by Fe+3, the experimental results suggest that the sites that are now occupied by Fe+3 can no longer effectively participate in the DE process. The mechanism that Fe+3 terminates the DE process arises purely from the electronic structure of the materials.
The dependence of resistivity as a function of temperature for the La0.65Ca0.35Mn1-xFexO3 with 0.01 ≤ x ≤ 0.1. The symbols used in different curves for different composition are ▪, □, ▲, △, ▼, ▽, •, and ○ for x = 0.00, 0.01, 0.02, 0.03, 0.05, 0.07, 0.08, and 0.10, respectively.

A. AC susceptibility studies
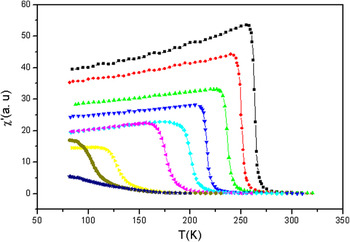
AC susceptibility studies were conducted using a self-made ac probe with a split secondary (astatically wound) and a commercial lock-in amplifier. The in-phase part of the susceptibility, χ/, for Fe-doped compositions is studied in detail as shown in Fig. 2 for h ac = 5 Oe and f = 311Hz for La0.65Ca0.35Mn1-xFexO3 (x = 0.0–0.1). All the compositions go from PM to FM at a Curie temperature, T C. With increasing the Fe concentration, the sharpness in the transition region from PM to FM is decreased. The magnitude of susceptibility decreased from lower concentration toward high Fe concentration. The decrease from the peak to the lowest temperature value is also decreased. The increase in Fe concentration leads to increased spin disorder and dissipation at low temperature, which is the most important result of this study. The resistivity peak matches with the tail of the χ/, for all the compositions.
Temperature dependence of the real part of the susceptibility for La0.65Ca0.35Mn1-xFexO3 with 0.01 ≤ x ≤ 0.1, taken zero field-cooled (ZFC) (warming) curves at 5 Oe ac probing field at a fixed frequency of 131 Hz. The symbols used in different curves for different composition are ▪, •, ▲, ▼, ◆, +, ×, *, and − for x = 0.00, 0.01, 0.02, 0.03, 0.04, 0.05, 0.07, 0.08, and 0.10, respectively.

One consistent feature to emerge from the χ/ measurement is the presence of the decrease in χ/ for T < or close to T C, consistent with the dc magnetization behavior. The ac response χ/ was studied in the more truly FM La0.65Ca0.35MnO3, and a very similar increase in χ/ was observed with increasing temperature culminating in a very sharp drop at T C. Thus both the dc and ac magnetization show consistent behavior for both the compositions. Obviously, the PM to FM transition temperature T C decreases with increasing Fe concentration. This is corroborated by the insulator-to-metal transition temperature as a large anomaly in the electrical resistivity measurements.
B. DC field effect on in-phase part (χ/)
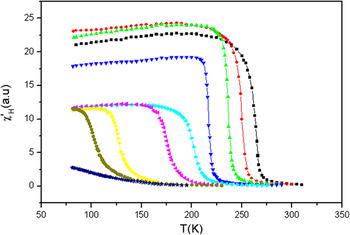
Studies with superposed dc fields were conducted during warm up after the sample had been cooled down to 81 K. The data for χ/ in the zero field-cooled state as shown in Fig. 3 depicts the typical behavior seen in our range of h ac and H dc. First, there is a general decrease of χ/ due to the applied dc field. For a field of 550 Oe, there is a decrease of about 27–47% at the χ/ maximum for different Fe concentrations. We note that for relatively higher fields, the general response of both the dc and ac susceptibilities is almost the same. The decrease in the in-phase part of χ/ due to an applied dc field at low temperatures (T << T C) is not surprising. The ac susceptibility χ/ = (dm //dh) is the so-called “reversible susceptibility,”Reference White22 which corresponds to the local slope of the “minor loop” traced by the magnetization because of the cycling of the ac field. In the FM state, this slope, in general, decreases with increasing applied field, accordingly, so does the susceptibility. On the other hand, the dc slope in the low-field region, the so-called differential susceptibility,Reference White22 is understood to go through a maximum with increasing fields. Thus, the effect of the dc field on the dynamic response can be divided into two parts. In the low-temperature part of Fig. 3, the almost temperature-independent (normalized) change is due to the change in the local susceptibility. The effect of dc magnetic field is different on different Fe-substituted compositions. The 4 and 5% Fe compositions have abrupt change as we increase the Fe contents in the system. The 4–5% Fe has large magnetic field effects as compared with 7 and 8% Fe, that is why they seem to merge at low temperature. However, in the high-T region (T > T C) where the maximum effects are observed, these may be ascribed to the spin dynamics within and around the critical region, which is a very crucial result of this work, and this is first time in the history of CMR materials that we did this important investigation. In the critical region, the growth of the correlations implies that the long-range spin alignments are in a state of rapid dynamic growth.Reference Stanley24 These correlations are suppressed by the application of static biasing fields, particularly in soft FM materials, as shown by Williams et al.Reference Williams and Hein25 This would lower the ac response very strongly, as is observed. This picture will be seen to be supported by the behavior of the out-of-phase part χ//.
Temperature dependence of the real part of the susceptibility for La0.65Ca0.35Mn1-xFexO3 with 0.01 ≤ x ≤ 0.1, taken ZFC (warming) curves at 5 Oe ac probing field with the superimposed dc field up to 550 Oe at a fixed frequency of 131 Hz. The symbols used in different curves for different composition are ▪, •, ▲, ▼, ◆, +, ×, *, and − for x = 0.00, 0.01, 0.02, 0.03, 0.04, 0.05, 0.07, 0.08, and 0.10, respectively.

The other feature observed on application of the dc field is the flattening out of the low-T decline of χ/. For example, for H = 0, the decline down to 81 K was seen earlier to be about 0–25%. However, for H = 550, we find that this decrease in χ/ is reduced to 0–9%. For an applied field of 1100 Oe, we find that the decline is completely eliminated, and the moments at T = 81 K and at the previous peak are equal. We have studied this effect in a number of compositions and find similar behavior. This field dependence is consistent with the dc behavior discussed earlier. The dc fields, while suppressing the overall response, due to change in the local susceptibility, act to incorporate the smaller clusters into the extended cluster, suppressing the tendency for AFM alignments.
C. Out-of-phase response χ//
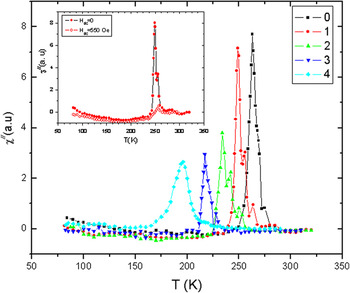
The out-of-phase response of a driven system (such as the spin system) is proportional to the losses taking place. These losses are typically large at and around a phase transition. The temperature variation of the out-of-phase response was studied for ac field amplitudes h ac = 5 Oe, frequency f = 311 Hz, and dc field 0 ≤ H ≤ 550 Oe. The out-of-phase part of the pure composition has a very sharp maximum peak and no shoulder. The compositions with y = 0.01, 0.02, and 0.03 Fe have a shoulder before the main peak as shown in Fig. 4. As we increase the Fe concentration, the peak becomes broad, the sharpness becomes less, and also the peak value is decreased. The shoulder disappeared at 4% Fe concentration and above. Above the 5% Fe concentration, there is no remarkable response of χ// at 5 Oe ac field and f = 311 Hz. There is a clear increase below about 260 K, which in this case has a shoulder at 257 K, and maximum at 250 K for the undoped composition. The response then decreases continuously as T is lowered. A significant part of these data is the appearance of a shoulder. It will be seen that these features are retained at the application of dc field, albeit with somewhat less sharpness. We note that the response does not fall to zero below this broad peak and the shoulder but settles down to a finite value. This low-temperature dissipation is in the same region where the in-phase part of χ// reaches a maximum. The continued presence of losses in the low-temperature region is consistent with the picture of a gradual process of incorporation of small clusters into the main extended cluster, which generates the low temperature losses, which is a very important conclusion. However, the first peak or shoulder in χ// appears (257 K) for 1% Fe composition, somewhat below the maximum in resistance R, and just at the mid of the susceptibility. For a system undergoing a magnetic transition, the loss components are, according to the fluctuation–dissipation theorem,Reference White22 proportional to the fluctuations in the magnetization. This loss component can be associated with the dynamical changes taking place in the critical region. As the dynamical correlations of the spin develop in this region, they are accompanied by energy losses and these are correspondingly reflected in the χ// behavior. This would correspond to the increase of χ// at 260 K (1% Fe) and to the maximum around the mid-point of the transition, around 250 K. The main peak in χ//, however, occurs close to T C, the temperature where the magnetization M(T) shows no particular structure except for the slowing down of the changes in magnetization. The resistive curve R(T), however, shows a clear inflection point close to this temperature (see Fig. 1). This suggests that the mechanisms responsible for the slowing down of the resistivity decrease are magnetic in origin and are associated with the increase in the loss component at 260 K. It is notable that the loss component does not exhibit the global maximum at the middle of the magnetic transition, as is generally seen, but at a temperature (250 K) significantly below it. It would appear from this that the losses continue to grow well up to the point where the magnetization continues to increase rapidly. Similar behavior is also observed in the sample with other Fe composition. We understand this to be originating in the continued rapid growth of the smaller clusters in this region, below T C itself. It is interesting to note that the muon spin resonance (μSR)Reference Teresa, Ibarra, Algarabel, Ritter, Marquina, Blasco, Garcia, del Moral and Arnold11 and small angle neutron spectroscopy (SANS) data also shows the continued development of the small clusters down to a temperature about 20 K below T C. At lower temperatures, the corresponding μSR amplitude decreases indicating the decrease in the number of smaller clusters.
Temperature dependence of the out-of-phase part of the susceptibility for La0.65Ca0.35Mn1-xFexO3, taken ZFC (warming) curves at 5 Oe ac probing field at a fixed frequency of 311 Hz. The symbols used in different curves are ▪, •, ▲, ▼, and ◆ are for x = 0.00, 0.01, 0.02, 0.03, and 0.04% Fe composition. The inset shows the dc field (H = 550 Oe) effects on the imaginary part of the susceptibility for 1% Fe composition.

We studied the dc field effect on the out-of-phase response. As is evident from the inset of Fig. 4 for 1% Fe composition, the response is very strongly suppressed by the applied dc fields of the typical value of a few hundred Oe. This is true for the entire range of temperatures, albeit for different reasons. The out-of-phase response is completely suppressed by fields of the order of a few hundred Oe. It may be pointed out here that the suppression of χ// is much stronger than that of χ/.
We understand the strong field dependence of the loss components at higher temperatures (T > T C) as being due to the suppression of dynamical spin fluctuations in the transition region, as already mentioned in the context of the in-phase part. With the application of the applied dc field, the fluctuations are suppressed and the dc field immobilizes part of the spins, leading to a decrease in the in-phase part as well. The suppression of the peak with field probably corresponds to the removal of local correlations due to the dc applied magnetic field.
IV. CONCLUSIONS
We conclude that the effect of the dc magnetic field is to decrease the spin disorder, both above and below T C, thereby increasing the spin correlations and the conductivity. At T C where the correlations are not fully established, the field apparently helps stabilize the FM correlations and leads to large change in susceptibility. Our results show that with the development of an extended cluster or region, the critical fluctuations and their related losses are strongly suppressed with the application of dc fields. We find that the pattern of the losses is consistent with the rapid growth of clusters probably up to some temperature and continued presence of these smaller clusters well below this temperature. It is also noticeable that below T C, both resistivity and ac magnetization show the effects we may attribute to increasing spin disorder. This latter effect is consistent with increasing magnetic anisotropy. The effects of the dc magnetic field on the susceptibilities, χ/ and χ//, are explainable within the context of changes in the local slope of the magnetization curve and the suppression of fluctuations, away and close to the critical region, respectively. What is remarkable here is the very strong suppression of the out-of-phase part even for moderate dc fields ∼550s of Oe. This very strong sensitivity of the out-of-phase response, and the very low ac fields required, suggests that the effect could be utilized to sense magnetic fields, for example, in recording devices. If the ac response of the CMR sensing head is monitored, the very rapid change in the out-of-phase component with field could be used as a signal. It is noticeable that the field sensitivity is strongest close to T C; hence, in CMR compounds with T C’s exceeding room temperatures, the applicability could become more feasible.