Introduction
The alkane technique has been investigated thoroughly and shown to be an effective method for the estimation of herbivore intake (Mayes et al., Reference Mayes, Lamb and Colgrove1986; Dove and Mayes, Reference Dove and Mayes1996 and Reference Dove and Mayes2005). The prerequisite for the method is that the alkane pattern in the diet sample should be representative of that consumed by the experimental animals. For simple plant communities such as sown pastures, this can be achieved by hand-gathering or by collecting oesophageal samples from fistulated animals (Vulich et al., Reference Vulich, Hanrahan and O’Riordan1993; Dove and Mayes, Reference Dove and Mayes1996). However, under complex plant communities such as rangelands, it is difficult to obtain representative diet samples (Dove and Mayes, Reference Dove and Mayes1996). Theoretically, the alkane technique can also provide an estimate of diet composition and hence the alkane concentrations of the representative diets of individual animals, which would enable the determination of intake (Dove and Mayes, Reference Dove and Mayes1996 and Reference Dove and Mayes2005). Nevertheless, the reliability of the technique appears to decline as the number of dietary components increases (Dove and Mayes, Reference Dove and Mayes1991 and Reference Dove and Mayes1996). This is because the diet components may contain low concentrations of alkanes which are insufficient to permit the estimation of diet composition (e.g. even-chain alkanes), or because some diet components may exhibit similar alkane patterns (Lin et al., Reference Lin, Liu and Zhang2006). Also, there is an increased likelihood that different combinations of components could result in the same faecal alkane patterns (Dove and Mayes, Reference Dove and Mayes1996 and Reference Dove and Mayes2005; Mayes and Dove, Reference Mayes and Dove2000; Brosh et al., Reference Brosh, Henkin, Rothman, Aharoni, Orlov and Arieli2003; Elwert et al., Reference Elwert, Kluth and Rodehutscord2004; Lin et al., Reference Lin, Luo, Zhang and Shu2007).
One potential approach to improve the reliability of diet composition estimates is to use more classes of plant wax compounds to extend the range of available faecal markers (Dove and Mayes, Reference Dove and Mayes1996 and Reference Dove and Mayes2005; Mayes and Dove, Reference Mayes and Dove2000). Recently, long-chain alcohols (alcohols) and long-chain fatty acids (acids) have received the most attention (Kelman et al., Reference Kelman, Bugalho and Dove2003; Bugalho et al., Reference Bugalho, Dove, Kelman, Wood and Mayes2004; Ali et al., Reference Ali, Mayes, Hector, Verma and Ørskov2004, Reference Ali, Mayes, Hector and Ørskov2005a and Reference Ali, Mayes, Lamb, Hector, Verma and Ørskov2005b; Dove and Charmley, Reference Dove and Charmley2008), as the alcohols and acids can be separated and quantified by an extension of the existing procedure used to analyse alkanes (Ali et al., Reference Ali, Mayes, Lamb, Hector, Verma and Ørskov2004, Bugalho et al., Reference Bugalho, Dove, Kelman, Wood and Mayes2004). Previous studies indicated that alcohols had great potential, when combined with alkanes, to estimate the composition of complex diets, and acids also showed substantial between-species differences and high faecal recoveries (Bugalho et al., Reference Bugalho, Dove, Kelman, Wood and Mayes2004; Ali et al., Reference Ali, Mayes, Hector and Ørskov2005b; Dove and Charmley, Reference Dove and Charmley2008). However, diet estimation using acids was less accurate (Ali et al., Reference Ali, Mayes, Hector and Ørskov2005b). Therefore, further indoor validation studies are needed before alcohols and acids can be used routinely in diet composition estimates, particularly in relation to the estimation of faecal recoveries and the evaluation of the accuracy of diet composition estimates (Bugalho et al., Reference Bugalho, Dove, Kelman, Wood and Mayes2004; Ali et al., Reference Ali, Mayes, Hector and Ørskov2004 and Reference Ali, Mayes, Lamb, Hector, Verma and Ørskov2005b).
The experimental work described in this paper was designed to: (i) investigate the effects of the dietary herbage species and animal live weight on faecal recovery rates of alcohols and acids; (ii) assess the accuracy of using alcohols and acids, combined with alkanes, as markers in estimation of diet composition. These experiments were also used to examine the effects of dietary species and live weight on faecal recovery of alkanes, and the accuracy of diet composition estimates using alkanes. Such work has been published before by Lin et al. (Reference Lin, Luo, Zhang and Shu2007).
Material and methods
A detailed description of the experiment design were presented earlier (Lin et al., Reference Lin, Luo, Zhang and Shu2007), but for the sake of clarity are also summarized here. The study was conducted at the Guyuan State Key Monitoring and Research Station of Grassland Ecosystem (China). All the animal experiments received approval from China Agricultural University Laboratory Animal Care Advisory Committee.
Animals and diets
Experiment 1
A total of 36 wethers (Inner Mongolia fine wool sheep × Mongolia sheep), 6 to 8 months of age, were housed individually indoors and allocated to four groups of nine animals on the basis of live weight (I, 21.2 ± 1.2 kg; II, 26.7 ± 0.5 kg; III, 32.1 ± 1.1 kg; IV, 37.5 ± 1.5 kg). Three wethers from each group were assigned at random to one native Chinese grass species: Leymus chinensis, L. dasystachys or Elymus sibiricum. During the sampling period, two sheep given E. sibiricum from group III and IV, respectively, refused to eat an increasing amount of the diet, and the other two sheep given L. dasystachys from group II and IV, respectively, got diarrhoea. Therefore, these data were discarded.
Experiment 2
Six wethers (38.5 ± 0.6 kg live weight), of the same breed as above, fed on a three-component mixed diet consisting of L. chinensis, L. dasystachys and E. sibiricum in equal proportions on a fresh matter (FM) basis (1 : 1 : 1). The average dry matter (DM) of L. chinensis, L. dasystachys and E. sibiricum during the sampling period were similar (0.47 ± 0.036, 0.46 ± 0.025 and 0.48 ± 0.036 DM/FM for L. chinensis, L. dasystachys and E. sibiricum, respectively). Therefore, on a DM basis, the diet composition in the present study, expressed on a DM basis, was similar to the FM basis (1 : 1 : 1).
In both experiments, fresh herbage was harvested daily and divided into three approximate equal portions and offered at 0900, 1200 and 1600 h. The amount fed to each sheep was adjusted before the adaptation period, so ensure less than 5% refusals (Brosh et al., Reference Brosh, Henkin, Rothman, Aharoni, Orlov and Arieli2003). The material was chopped into approximately 20 mm lengths and it was assumed that the sheep were unable to select leaves or stem (Hameleers and Mayes, Reference Hameleers and Mayes1998). Fixed wooden feed containers were used to supply the chop forages. The feed occupied only one-fourth of the container. Consequently, spoiling of the chopped forage was avoided as much as possible. Moreover, the presence of supervising technicians during the day ensured that all wasted forage was picked up and put back to the relevant container. These measures guaranteed the accuracy of the determined intake and diet composition. Refusals were, therefore, not evaluated for their botanical composition or chemical composition.
Sampling procedures
Experiment 1 consisted of an adaptation period of 10 days followed by a 7-day faecal and herbage collection period. On the 5th day of the adaptation period, faecal collection bags were fitted on each sheep for adaptation. Experiment 2 consisted of a 16-day adaptation period and a 7-day sampling period. Faecal collection bags were fitted on the sheep from 7 days before the sampling period and throughout the collection period.
Total faecal output was collected by faecal collection bags which were emptied daily at about 0800 h during the 7-day collection period. The weight of the faeces was recorded and a representative sample of 20% was taken (Elwert et al., Reference Elwert, Kluth and Rodehutscord2004). Refusals were recorded daily at 1800 h to estimate the actual DM intake.
The feeding scheme adopted in this study was designed according to local farmers’ habit. Generally, the sheep graze freely until sunset. During the night, sheep are kept in a pen with free access to water but without any feed offered. However, it should be pointed out that this feeding schedule might not be the most appropriate setup for the aims of the current experiments.
Sample preparation
Samples of the diet herbage and faeces were immediately dried at 65°C for 48 h in a forced-air oven. Afterwards, subsamples (about 20% by weight) of the diet herbage and faeces were bulked for each diet and sheep, respectively, and then ground through a 1 mm screen and stored at room temperature until analysed for alcohols and acids.
Extraction and analysis of alcohols and acids
The analytical procedures of alcohols and acids have been described in detail by Lin et al. (Reference Lin, Luo, Wang, Zhang and Shu2009). Briefly, alcohols and acids were extracted and analysed according to the method of Bugalho et al. (Reference Bugalho, Dove, Kelman, Wood and Mayes2004) and Ali et al. (Reference Ali, Mayes, Lamb, Hector, Verma and Ørskov2004), respectively, with the exception that C27-alcohol and C21-acid were used as internal standards for alcohols and acids, respectively. The method involved saponification (KOH), followed by solvent separation, purification through silica gel columns and gas chromatography.
Calibration
A standard solution containing a mixture of synthetic alcohols or acid-methyl esters (1-Eicosanol, 1-Docosanol, 1-Tetracosanol, 1-Hexacosanol, 1-Octacosanol and 1-Triacontanol – C20-ol, C22-ol, C24-ol, C26-ol, C28-ol and C30-ol, respectively; Eicosanoic acid-methyl ester, Docosanoic acid-methyl ester, Tetracosanoic acid-methyl ester, Hexacosanoic acid-methyl ester, Octacosanoic acid-methyl ester and Triacontanoic acid-methyl ester – C20-acid, C20-acid, C24-acid, C-26 acid, C28-acid and C30-acid, respectively) (Dr Ehrenstorfer GmbH, Augsburg, Germany) was prepared in five different concentrations. This external standard series was used for the calibration by linear regression. The response factors for individual alcohol or acid were calculated from peak areas and the known concentrations.
Calculations
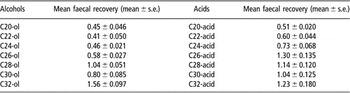
Diet proportions were estimated using a non-negative least square algorithm as supplied by the software EatWhat (Dove and Moore, Reference Dove and Moore1995), which calculates faecal concentrations of alkanes, alcohols and acids from the concentrations in the diet components by selecting multipliers that minimize the sum of the squared discrepancies between the observed (adjusted for the incomplete faecal recoveries) and the calculated faecal concentrations. The faecal concentrations of individual alkanes, alcohols and acids were corrected using the mean recovery values from the six animals in Experiment 2 (For alkanes, see Table 3 in Lin et al., Reference Lin, Luo, Zhang and Shu2007; for alcohols and acids, see Table 1). Only the five alkanes (C25, C27, C29, C31 and C33) that were found in relatively higher concentrations were used in this study, while all available alcohols and acids, except C20-ol which showed low concentrations in the three herbages, were used for diet proportion estimates.
Mean faecal recovery rates for C20–C32 alcohols and acids measured in Experiment 2 with the six sheep on a mixed grass diet

The accuracy of estimates was also assessed by the mean square of errors (E.M.S.), this was done by summing the squares of differences between the actual and estimated proportions within a diet treatment and dividing by replicates in the treatment, as follows (Ali et al., Reference Ali, Mayes, Hector, Verma and Ørskov2005a):

Statistical analysis
All statistical analyses were performed using SPSS (Statistical Package for the Social Sciences) version 11.5 for Windows. The faecal alcohol and acid recovery rates in Experiment 1 were examined by analysis of variance (ANOVA) to evaluate the effects of herbage species and live weight of wethers on the faecal recovery rates of individual alcohols and acids. Deviation of the estimates from the actual composition (1/3 of each of the compounds) was assessed using a t-test (as applied by Dove and Charmley (Reference Dove and Charmley2008) and Elwert et al. (Reference Elwert, Dove and Rodehutscord2008) for a similar purpose).
Results
Experiment 1: effects of herbage species and live weight of wethers on the faecal recoveries of alcohols and acids
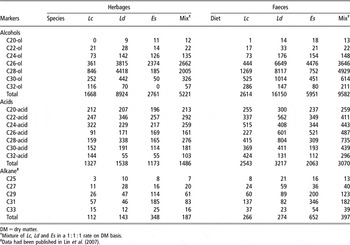
The data presented in Table 2 shows that the three species used in the experiment contained considerable amounts of even-chain alcohols and acids. The between-species differences in alcohols were large, while they were relatively small for acid patterns in the three forage species. The most abundant alcohols in the herbages were C26-ol (E. sibiricum) or C28-ol (L. dasystachys and L. chinensis), followed by C24-ol and C30-ol. The highest individual alcohol concentration was reported for C28-ol in L. dasystachys, which also had the highest total alcohol concentration. The species, L. Chinensis, had the lowest total alcohol concentration. Shorter even-chain acids were detected in higher concentrations than longer even-chain acids. Generally, the differences between the concentrations of individual even-chain acids were smaller than those of alcohols (Table 2).
Alcohol, acid and alkane concentrations (μg/g DM) in Leymus chinensis (Lc), L. dasystachys (Ld) and Elymus sibiricum (Es) and faeces in Experiments 1 and 2

DM = dry matter.
†Mixture of Lc, Ld and Es in a 1 : 1 : 1 rate on DM basis.
‡Data had been published in Lin et al. (Reference Lin, Luo, Zhang and Shu2007).
As would be expected, the alcohol and acid concentrations in faeces were higher than those in the herbage species offered to the wethers. However, the diet and faeces showed similar alcohol and acid patterns (Table 2).
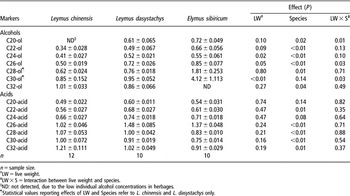
The results from ANOVA indicated herbage species had a significant effect on faecal recovery rates of alcohol and acid (P < 0.05), except for C30-ol, C20-acid and C24-acid (P > 0.05) (Table 3). For faecal alcohol recoveries, the effects of live weight were significant for C24-ol and C30-ol (P < 0.05), and nearly significant for C26-ol (P = 0.05). The effects of interactions between live weight and herbage species were also significant for C20-ol, C26-ol and C30-ol (P < 0.05) (Table 3). However, the faecal acid recoveries were unaffected by live weight or interactions between live weight and herbage species (P > 0.05).
The mean faecal recoveries of alcohol and acid (mean ± s.e.) and the results of ANOVA in Experiment 1

n = sample size.
†LW = live weight.
‡LW × S = Interaction between live weight and species.
§ND: not detected, due to the low individual alcohol concentrations in herbages.
¶Statistical values reporting effects of LW and Species refer to L. chinensis and L. dasystachys only.
In general, acids had consistently higher faecal recoveries compared with alcohols. Faecal recoveries of alcohols and acids increased with increasing carbon chain length (Tables 1 and 3).
Experiment 2: estimation of mixed diet composition fed to wethers
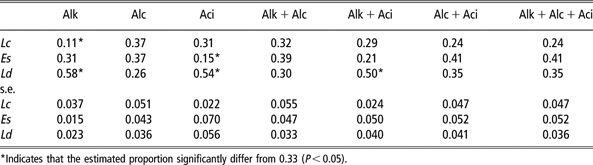
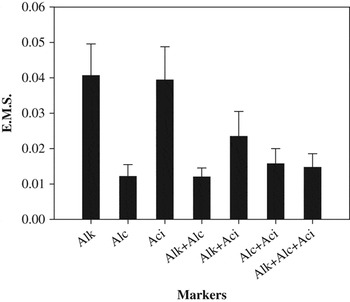
The diet composition estimated using alcohols as markers were not significantly different from actual values (P > 0.05), while alkanes and acids gave acceptable estimates only for E. sibiricum and L. chinensis proportions, respectively (Table 4). Generally, combinations of different marker types produced lower E.M.S. values than those of individual markers (Figure 1). However, results of diet composition based on the combinations of different marker types were not significantly different from actual values (P > 0.05), except for the proportion of L. dasystachys as estimated by Alk + Aci (P < 0.05). When other classes of markers were used along with alcohols, better estimates of diet composition could be achieved (Table 4, Figure 1) (Alk v. Alk + Alc; Aci v. Aci + Alc). However, including acids for composition assessment resulted in poorer diet composition estimations (Table 4, Figure 1) (Alc v. Alc + Aci; Alk + Alc v. Alk + Alc + Aci).
Diet compositions estimated using alkanes (Alk), alcohols (Alc), acids (Aci) or their combinations as markers in Experiment 2 with six sheep fed a three-component mixed diet consisting of Leymus chinensis (Lc), L. dasystachys (Ld) and Elymus sibiricum (Es) in equal portions (n = 6)
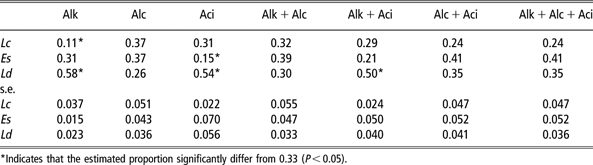
*Indicates that the estimated proportion significantly differ from 0.33 (P < 0.05).
Mean squares of errors (E.M.S. ± s.e.) between actual and estimated diet proportions using alkanes (Alk), alcohols (Alc), acids (Aci) and their combinations as markers.

E.M.S. values revealed the best diet composition estimates were achieved using alcohols alone or in combination with alkanes (Figure 1).
Discussion
Experiment 1: effects of herbage species and live weight of wethers on the faecal alcohol and acid recovery rates
The results in Table 2 confirmed previous reports that alcohols and acids with even-number carbon chains were predominant and exhibited considerable between-species differences, and the total concentrations of alcohols or acids in a plant species were generally higher than those obtained for alkanes (Grace and Body, Reference Grace and Body1981; Kelman et al., Reference Kelman, Bugalho and Dove2003; Bugalho et al., Reference Bugalho, Dove, Kelman, Wood and Mayes2004; Ali et al., Reference Ali, Mayes, Hector, Verma and Ørskov2004, Reference Ali, Mayes, Hector and Ørskov2005a and Reference Ali, Mayes, Lamb, Hector, Verma and Ørskov2005b; Dove and Mayes Reference Dove and Mayes2005).
Leymus dasystachys and L. chinensis belong to the same genus, showing very similar alkane patterns (Lin et al., Reference Lin, Luo, Zhang and Shu2007) while the alcohol patterns of these two species were clearly discriminated (Table 2). Ali et al. (Reference Ali, Mayes, Hector, Verma and Ørskov2005a) also found that species with similar patterns of one marker type could have different patterns of another. This finding indicated that each class of marker provided different discriminatory information (Bugalho et al., Reference Bugalho, Dove, Kelman, Wood and Mayes2004; Dove and Mayes, Reference Dove and Mayes2005).
The results in Tables 1 and 3 support previous reports that the faecal recoveries of alcohols and acids increase with increasing chain length (Ali et al., Reference Ali, Mayes, Lamb, Hector, Verma and Ørskov2004; Dove and Mayes, Reference Dove and Mayes2005). In general, faecal alcohol and acid recovery rates found in the present experiment were comparable with those summarized by Dove and Mayes (Reference Dove and Mayes2005). The faecal recoveries of acids were generally higher than those of alcohols. This contrasts with the results of Ali et al. (Reference Ali, Mayes, Lamb, Hector, Verma and Ørskov2004) who generally showed higher recoveries of alcohols than acids.
Unexpectedly, the faecal recoveries of C26-acids in the present study were all higher than of other acids, ranging from 1.02 to 1.48 (Tables 1 and 3). An experiment conducted by Lin et al. (unpublished data) using five different dietary treatments also showed higher faecal recoveries of C26-acids compared to other acids. Most probably, endogenous synthesis of C20, C22 and eventually C24-acids is more important than of longer chain length fatty acids. Hence, it is unlikely that the high faecal recoveries of C26-acids were mainly caused by endogenous synthesis. A possible explanation could be a co-elution, during GC-analysis, of unsaturated C20 or C22-acids and the C26-acids, erroneously resulting in higher recoveries. In addition, high faecal recoveries were found in some alcohols such as C28-ol and C30-ol in sheep given E. sibiricum in Experiment 1 (Table 3) and C32-ol in Experiment 2 (Table 1). The reasons for the abnormal high faecal recoveries of alcohols and acids might be related to analytical errors arising from the relatively low concentrations in the currently studied grasses (Table 2). The reliability of faecal recovery data is likely to be poorer for plant-wax markers with relatively low concentrations in dietary plants (Brosh et al., Reference Brosh, Henkin, Rothman, Aharoni, Orlov and Arieli2003; Elwert et al., Reference Elwert, Dove and Rodehutscord2008).
While there are few publications evaluating the effects of faecal recoveries of alcohols and acids on diet composition estimates, many studies focused on faecal alkane recoveries (Dillon, Reference Dillon1993; Dove et al., Reference Dove, Mayes, Lamb and Ellis2002; Brosh et al., Reference Brosh, Henkin, Rothman, Aharoni, Orlov and Arieli2003; Elwert et al., Reference Elwert, Dove and Rodehutscord2004, Reference Elwert, Dove and Rodehutscord2006 and Reference Elwert, Kluth and Rodehutscord2008; Ferreira et al., Reference Ferreira, Garcia, Rodrigues, Celaya, Dias-da-Silva and Osoro2005 and Reference Ferreira, Oliván, Garcia, Rodrigues, Garcia and Osoro2007; Lin et al., Reference Lin, Luo, Zhang and Shu2007). Generally, not absolute faecal recoveries, but the ‘relative’ recovery (i.e. recovery of one individual marker compound relative to another marker compound, or recoveries of marker compounds in one dietary plant species relative to the recoveries of marker compounds in other dietary plants) is important for diet composition estimates (Dove and Mayes, Reference Dove and Mayes1991; Mayes and Dove, Reference Mayes and Dove2000). Nevertheless, a number of studies indicated that the use of faecal corrections improved the estimates of diet composition (Brosh et al., Reference Brosh, Henkin, Rothman, Aharoni, Orlov and Arieli2003; Ferreira et al., Reference Ferreira, Oliván, Garcia, Rodrigues, Garcia and Osoro2005); more accurate diet composition estimations were obtained if more accuracy of information were available on faecal recovery values (e.g. diet-specific recoveries) (Elwert et al., Reference Elwert, Dove and Rodehutscord2004 and Reference Elwert, Kluth and Rodehutscord2008; Lin et al., Reference Lin, Luo, Zhang and Shu2007). As a consequence, when using alkanes for estimating diet composition, faecal alkane concentrations must be adjusted for the incomplete recoveries (Dove and Mayes, Reference Dove and Mayes1991; Brosh et al., Reference Brosh, Henkin, Rothman, Aharoni, Orlov and Arieli2003; Ferreira et al., Reference Ferreira, Oliván, Garcia, Rodrigues, Garcia and Osoro2005; Elwert et al., Reference Elwert, Dove and Rodehutscord2006). Similarly, faecal recoveries of alcohols and acids should also be an important factor that could influence the accuracy of diet composition estimates.
Faecal plant-wax markers recovery rates are possibly influenced by diet factors such as herbage species, and animal factors such as live weight (Dove and Mayes, Reference Dove and Mayes1991; Brosh et al., Reference Brosh, Henkin, Rothman, Aharoni, Orlov and Arieli2003; Elwert et al., Reference Elwert, Kluth and Rodehutscord2004; Lin et al., Reference Lin, Luo, Zhang and Shu2007). Some studies have indicated that faecal alkane recoveries are unaffected by diet (Mayes et al., Reference Mayes, Lamb and Colgrove1986; Brosh et al., Reference Brosh, Henkin, Rothman, Aharoni, Orlov and Arieli2003) or feeding level (Mayes et al., Reference Mayes, Lamb and Colgrove1986; Dove et al., Reference Dove, Mayes, Freer, Coombe and Foot1989; Dove and Oliván, Reference Dove and Oliván1998; Elwert et al., Reference Elwert, Kluth and Rodehutscord2004); whereas others reported that alkane recoveries were influenced by diet types (Dove et al., Reference Dove, Mayes, Freer, Coombe and Foot1989; Hendricksen et al., Reference Hendricksen, Reich, Roberton, Reid, Gazzola, Rideout and Hill2002; Ferreira et al., Reference Ferreira, Garcia, Rodrigues, Celaya, Dias-da-Silva and Osoro2005 and Reference Ferreira, Oliván, Garcia, Rodrigues, Garcia and Osoro2007), feeding level (Dillon, Reference Dillon1993; Dove et al., Reference Dove, Mayes, Lamb and Ellis2002) or herbage species (Lin et al., Reference Lin, Luo, Zhang and Shu2007; Elwert et al., Reference Elwert, Dove and Rodehutscord2008). To date, little published data are available evaluating the effects of herbage species and live weight on faecal alcohol and acid recoveries. Ali et al. (Reference Ali, Mayes, Lamb, Hector, Verma and Ørskov2004) reported that faecal recovery values for alcohols and acids were not affected by feed type (P < 0.05). However, results of the present study indicated that the faecal recoveries of alcohols (C20-ol, C22-ol, C24-ol, C26-ol, C28-ol, C32-ol) and acids (C22, C26, C28, C30, C32) were significantly affected by herbage species (P < 0.01) (Table 3). This observation cannot be easily explained. Though earlier studies reported that there is a negative correlation between diet digestibility and faecal alkane recoveries (Ferreira et al., Reference Ferreira, Oliván, Garcia, Rodrigues, Garcia and Osoro2005; Charmley and Dove, Reference Charmley and Dove2007), in the present study, no significant difference of digestibility was found among the three herbage species (P > 0.05). Elwert et al. (Reference Elwert, Dove and Rodehutscord2008) recently reported that only 3.6% and 7.2% of the total variance of C29 and C31-alkanes were explained by organic matter digestibility. The possible explanation for this is that, as Lin et al. (Reference Lin, Luo, Zhang and Shu2007) discussed, plant cuticular wax morphology is determined mainly by the composition of wax exudates, which vary with the plant species and the age of the tissue (Baker, Reference Baker1982). Therefore, the wax morphology may differ among plant species influencing the degree to which the alcohols and acids can be removed from plant fragments in the gut, and hence affect its potential absorption. Elwert et al. (Reference Elwert, Dove and Rodehutscord2008) found that Trifolium pretense had a significantly higher faecal recovery for alkane C25, C27, C28 and C31 than other single-roughage diets in their studies, indicating that the higher faecal recovery of T. pretense might lie within the characteristic of cuticular waxes.
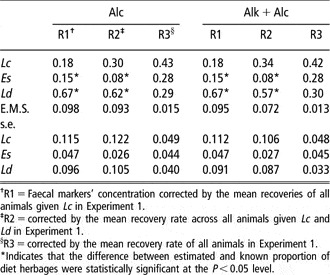
Measures to be taken to overcome these faecal recovery effects could include the use of a default faecal recovery value, provided that the marker patterns of individual plants are not affected. To determine the default value, one could rely on either the mean recovery over all animals and diets or a mean recovery over all animals on a particular diet. The effect of such a default recovery on the accuracy of diet composition prediction has been tested, with results presented in Table 5. Using the combination of alkane and alcohols or only using alcohols as markers, under the conditions of the present study, always led to accurate estimation of diet composition when faecal marker recoveries of the six animals in Experiment 2 were used (Table 4). Reliance upon the mean recovery rate of all animals in Experiment 1 (R3, Table 5) resulted in some loss of accuracy but results are still satisfactory (Table 5). However, when faecal marker concentration corrected by the mean recoveries of all animals given L. chinensis in Experiment 1 (R1, Table 5) or by the mean recoveries across all animals given L. chinensis and L. dasystachys in Experiment 1(R2, Table 5), two thirds of the herbage proportions were significantly different from actual values (Table 5). This result was in agreement with the earlier conclusions that faecal marker recovery is an important and sensitive factor which could influence the accuracy of diet composition estimates (Brosh et al., Reference Brosh, Henkin, Rothman, Aharoni, Orlov and Arieli2003; Elwert et al., Reference Elwert, Kluth and Rodehutscord2004; Ferreira et al., Reference Ferreira, Oliván, Garcia, Rodrigues, Garcia and Osoro2005; Lin et al., Reference Lin, Luo, Zhang and Shu2007). More information on faecal recovery values would allow a better estimation of the default value and hence a more accurate prediction of the dietary composition (Elwert et al., Reference Elwert, Dove and Rodehutscord2008). Obviously, if the faecal recovery data from individual animals were used as correction factors for calculating diet composition, ‘perfect’ estimates of diet composition would be the ultimate result (Ferreira et al., Reference Ferreira, Garcia, Rodrigues, Celaya, Dias-da-Silva and Osoro2007). For indoor studies, diet-specific faecal recoveries or even faecal recoveries of individual animals are possible to obtain. Under field conditions, the estimation of alkane recovery is difficult to make (Dove and Mayes, Reference Dove and Mayes1996 and Reference Dove and Mayes2005; Charmley and Dove, Reference Charmley and Dove2007). An appropriate estimate of the faecal recovery rate then could be obtained from a concomitant indoor experiment on a separate group of animals, given a similar diet or at least a diet with the same composition (Lin et al., Reference Lin, Luo, Zhang and Shu2007; Charmley and Dove, Reference Charmley and Dove2007; Elwert et al., Reference Elwert, Dove and Rodehutscord2008).
Estimated diet composition in the six sheep used in Experiment 2 offered a three-component mixed diet consisting of Leymus chinensis (Lc), L. dasystachys (Ld) and Elymus sibiricum (Es) in equal portions using alcohols (Alc) or alkanes and alcohols (Alk + Alc) as markers

†R1 = Faecal markers’ concentration corrected by the mean recoveries of all animals given Lc in Experiment 1.
‡R2 = corrected by the mean recovery rate across all animals given Lc and Ld in Experiment 1.
§R3 = corrected by the mean recovery rate of all animals in Experiment 1.
*Indicates that the difference between estimated and known proportion of diet herbages were statistically significant at the P < 0.05 level.
Experiment 2: estimation of mixed diet composition fed to wethers
While the use of more markers increases the possibility of determining the composition of more complex diets (Mayes and Dove, Reference Mayes and Dove2000), using more markers does not always imply better diet composition estimates (Bugalho et al., Reference Bugalho, Dove, Kelman, Wood and Mayes2004; Ali et al., Reference Ali, Mayes, Hector and Ørskov2005b). In the present study, the best estimations of diet composition were not from the combination of the three marker types, but from the combination of alcohols with alkanes (Table 3; Figure 1), which numerically, but not significantly, improved the composition prediction compared to alcohols alone. Kelman et al. (Reference Kelman, Bugalho and Dove2003) and Bugalho et al. (Reference Bugalho, Dove, Kelman, Wood and Mayes2004) also found that alcohols provided discriminatory information in addition to that already provided by the alkanes. Therefore, plant species were better separated by the combination of alkanes and alcohols than by alkanes alone (Bugalho et al., Reference Bugalho, Dove, Kelman, Wood and Mayes2004).
Introducing acids into the estimate resulted in poorer diet composition estimations (Table 4; Figure 1). One possible explanation for this is that, although considerable amounts of acids were found in the three herbage species, the difference in acid patterns between herbage species might be insufficient to allow a good discrimination. It is possible that some markers may discriminate better between components, while other markers may prove to be negatively correlated with the capacity to distinguish between dietary components (Lewis et al., Reference Lewis, Magadlela, Jessop and Emmans2003; Dove and Mayes, Reference Dove and Mayes2005). Ali et al. (Reference Ali, Mayes, Hector and Ørskov2005b) evaluated the accuracy of the three marker types in estimating diet composition of sheep and also found that the estimation using acids was less accurate. They discussed that the relatively poor result obtained for acids could be due to the less robust analytical method for quantifying acids. Further work has to be carried out to evaluate the potential of using acids as animal diet composition markers. However, it is necessary to point out that the estimation of each marker type is likely to be dependent upon the particular plant species combinations investigated (Ali et al., Reference Ali, Mayes, Hector, Verma and Ørskov2005a).
Conclusions
Under the conditions of the present study, the results indicate that the faecal recoveries of alcohols and acids were influenced significantly by herbage species (P < 0.05), meaning that the faecal alcohols and acids concentration correction should be based on diet-specific faecal recoveries. The diet composition estimated from alcohols alone or all of the combinations of other marker types with alcohols were not different from actual one (P > 0.05). The best diet composition estimations were achieved by using alcohols alone or the combination of alkanes and alcohols as markers. However, including acids for composition assessment resulted in poorer diet composition estimation.
Acknowledgements
We thank Dr Elaine Grings and Prof. Glenn Shewmaker for their helpful comments on the manuscript. Thanks are extended to the two anonymous reviewers for their constructive comments. This work was supported by the ‘973’ project (No. 2007CB106805) and grassland ecosystem restoration technology research (No. 2006BAD16B01).